XRP saw a 2.5% price decline today as the cryptocurrency drops back towards the %excerpt%.19 level. It attempted to push toward the %excerpt%.20 level yesterday but got rejected at %excerpt%.196. Against Bitcoin, XRP also dropped beneath support at 2680 SAT as it heads toward 2650 SAT support. Key Support & Resistance Levels XRP/USD: Support: %excerpt%.18, %excerpt%.171, %excerpt%.165. Resistance: %excerpt%.191, %excerpt%.2, %excerpt%.208. XRP/BTC: Support: 2650 SAT, 2600 SAT, 2560 SAT. Resistance: 2710 SAT, 2750 SAT, 2800 SAT. XRP/USD – Ripple Continues Sideways Trading In Consolidation Over the past four days, XRP had rebounded from support at %excerpt%.18 (.236 Fib Retracement) and attempted higher toward %excerpt%.20. However, in yesterday’s trading session, the bulls failed to breach %excerpt%.196, which caused the coin to drop back toward %excerpt%.19. The cryptocurrency
Topics:
Yaz Sheikh considers the following as important: Ripple (XRP) Price, XRP Analysis, xrpbtc, xrpusd
This could be interesting, too:
Jordan Lyanchev writes Ripple’s (XRP) Surge to Triggers Over Million in Short Liquidations
Jordan Lyanchev writes Trump Confirms Work on Strategic Crypto Reserve: XRP, ADA, SOL Included
Dimitar Dzhondzhorov writes Is a Major Ripple v. SEC Lawsuit Development Expected This Week? Here’s Why
Mandy Williams writes Ripple Releases Institutional DeFi Roadmap for XRP Ledger in 2025
- XRP saw a 2.5% price decline today as the cryptocurrency drops back towards the $0.19 level.
- It attempted to push toward the $0.20 level yesterday but got rejected at $0.196.
- Against Bitcoin, XRP also dropped beneath support at 2680 SAT as it heads toward 2650 SAT support.
Key Support & Resistance Levels
XRP/USD:
Support: $0.18, $0.171, $0.165.
Resistance: $0.191, $0.2, $0.208.
XRP/BTC:
Support: 2650 SAT, 2600 SAT, 2560 SAT.
Resistance: 2710 SAT, 2750 SAT, 2800 SAT.
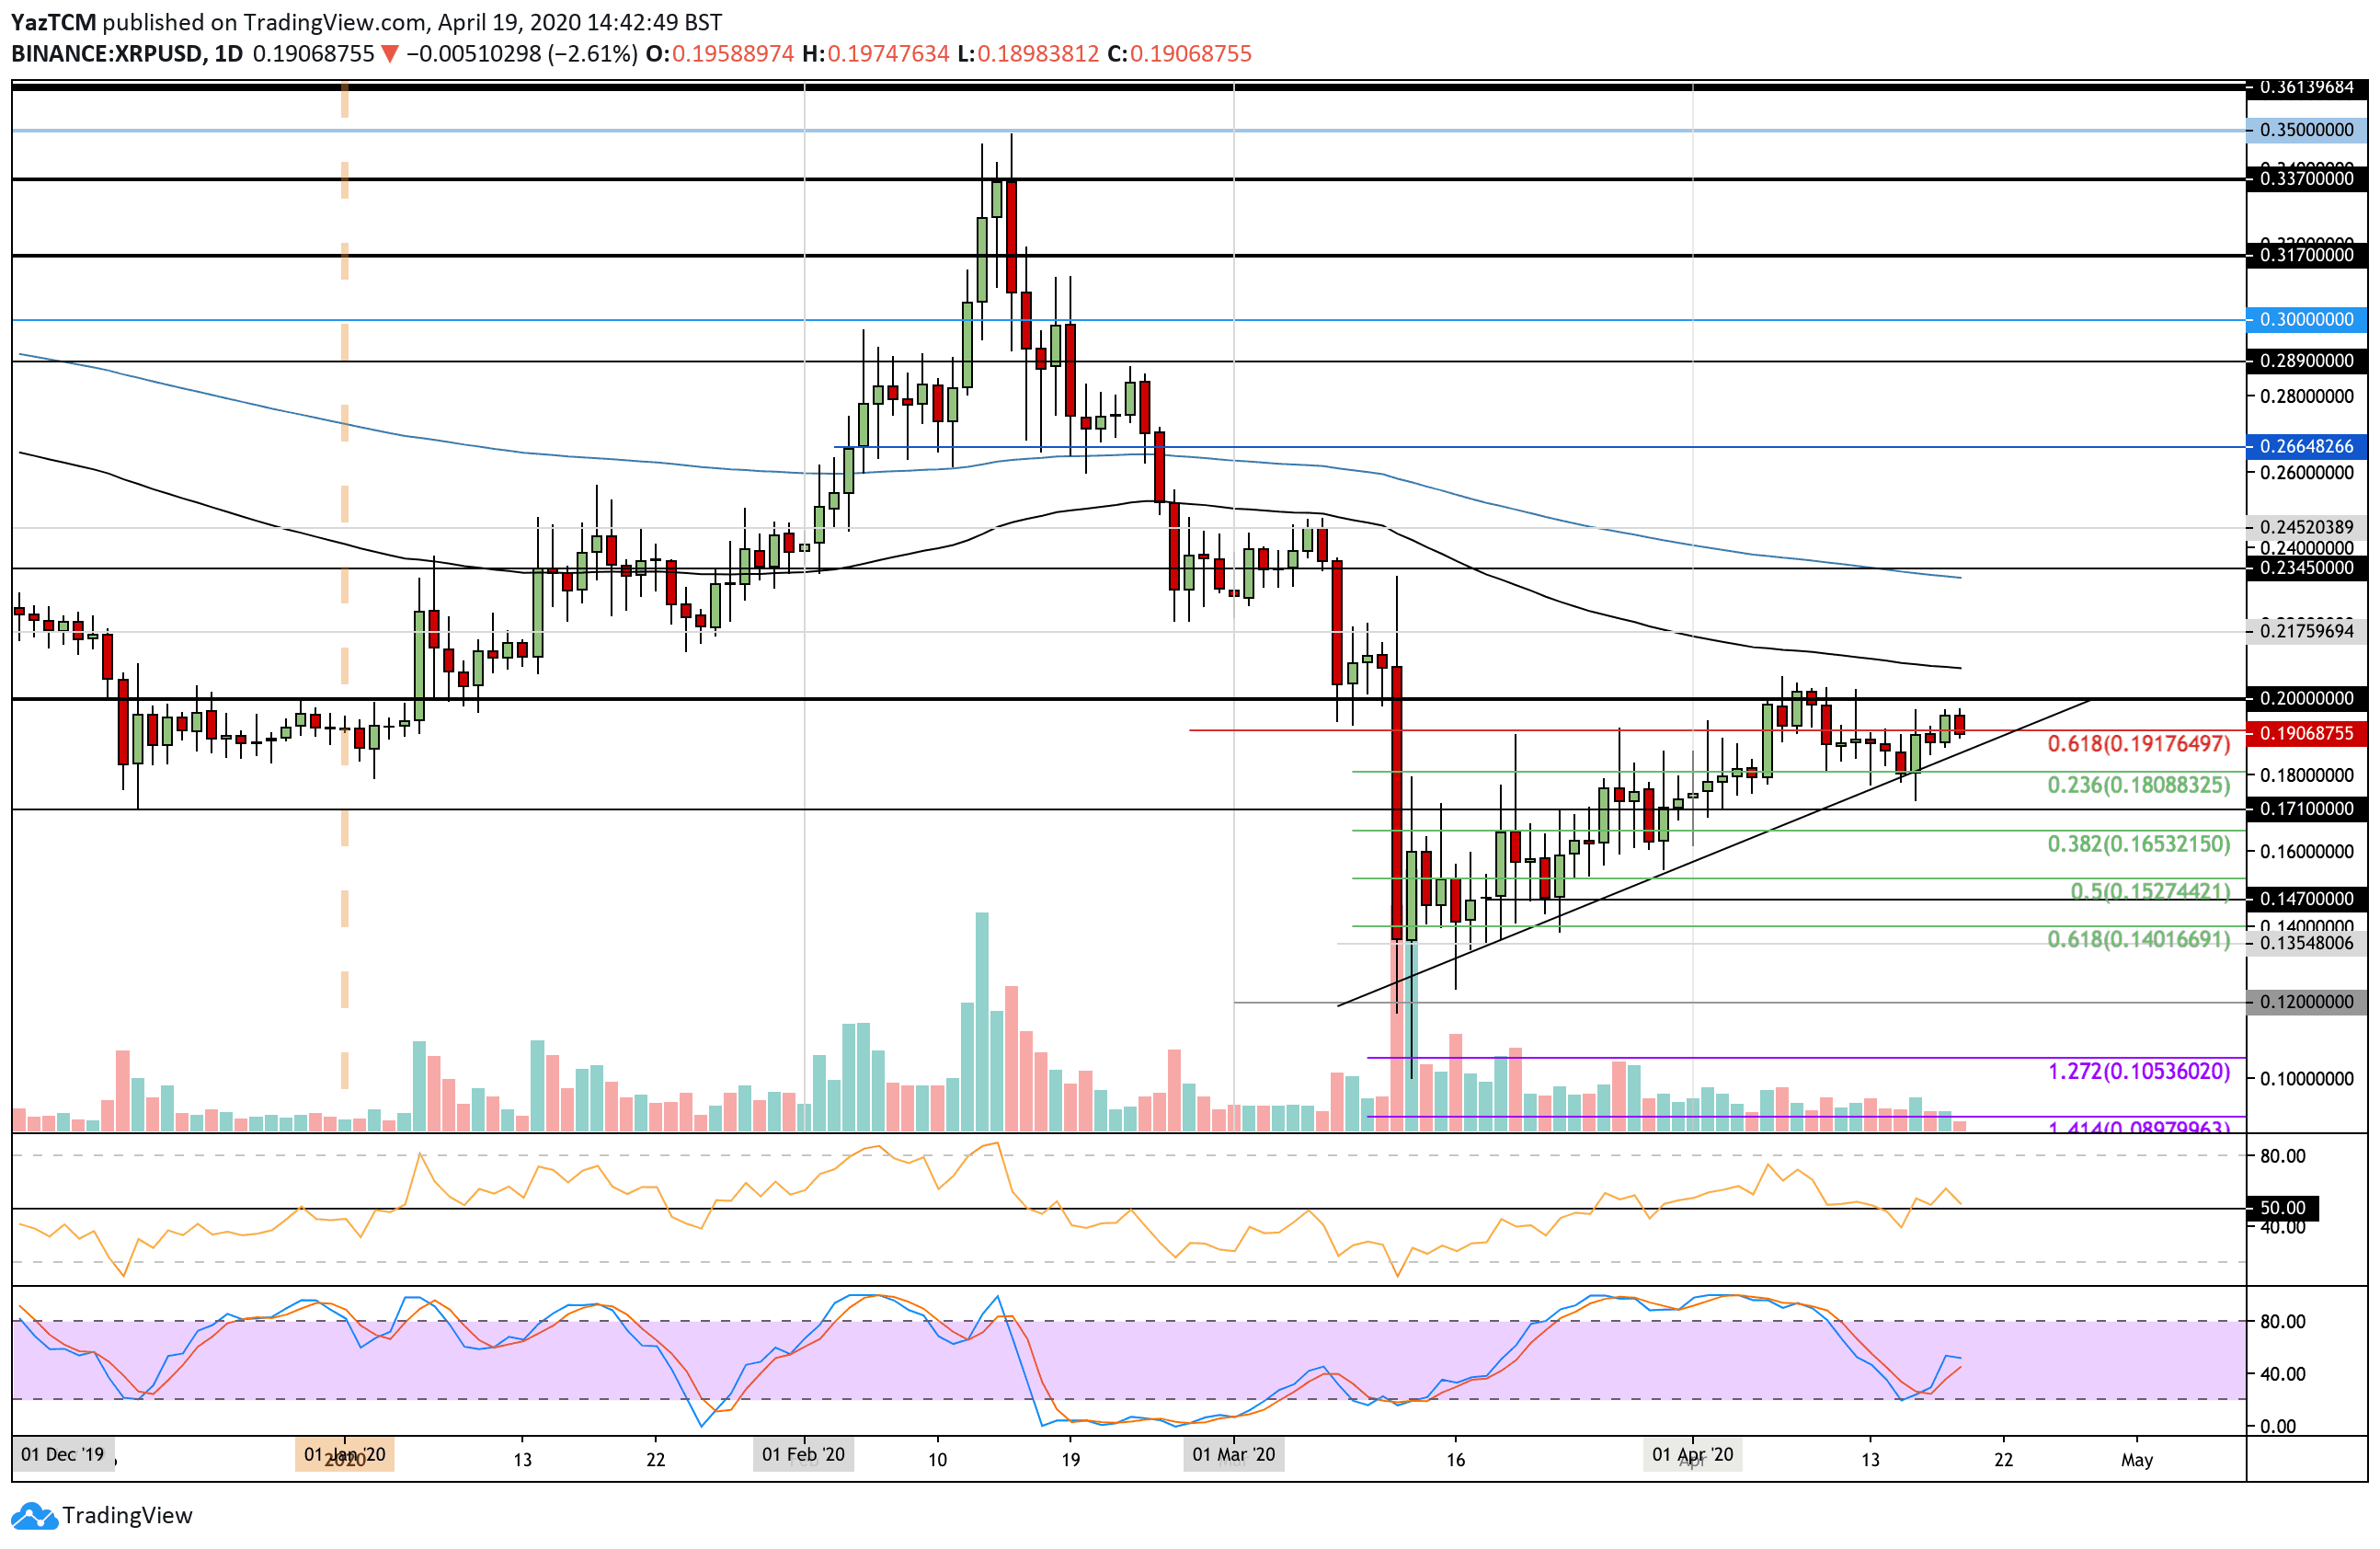
XRP/USD – Ripple Continues Sideways Trading In Consolidation
Over the past four days, XRP had rebounded from support at $0.18 (.236 Fib Retracement) and attempted higher toward $0.20. However, in yesterday’s trading session, the bulls failed to breach $0.196, which caused the coin to drop back toward $0.19.
The cryptocurrency has managed to maintain above a rising support trend line for the past month; however, a break beneath this trend line could cause XRP to drop toward the next support at $0.16 again.
XRP-USD Short Term Price Prediction
If the sellers continue to push lower, the rising trend line should provide the first level of support. Beneath this, support lies at $0.18, $0.171, and $0.165 (.382 Fib Retracement).
Alternatively, if the bulls can rebound at the rising trend line, resistance will be found at $0.191 and $0.20. Above this, higher resistance lies at $0.208 (100-days EMA) and $0.218.
The RSI is approaching the 50 level, indecisive, and a break beneath this will likely push XRP beneath the trend line and into bearish territory.
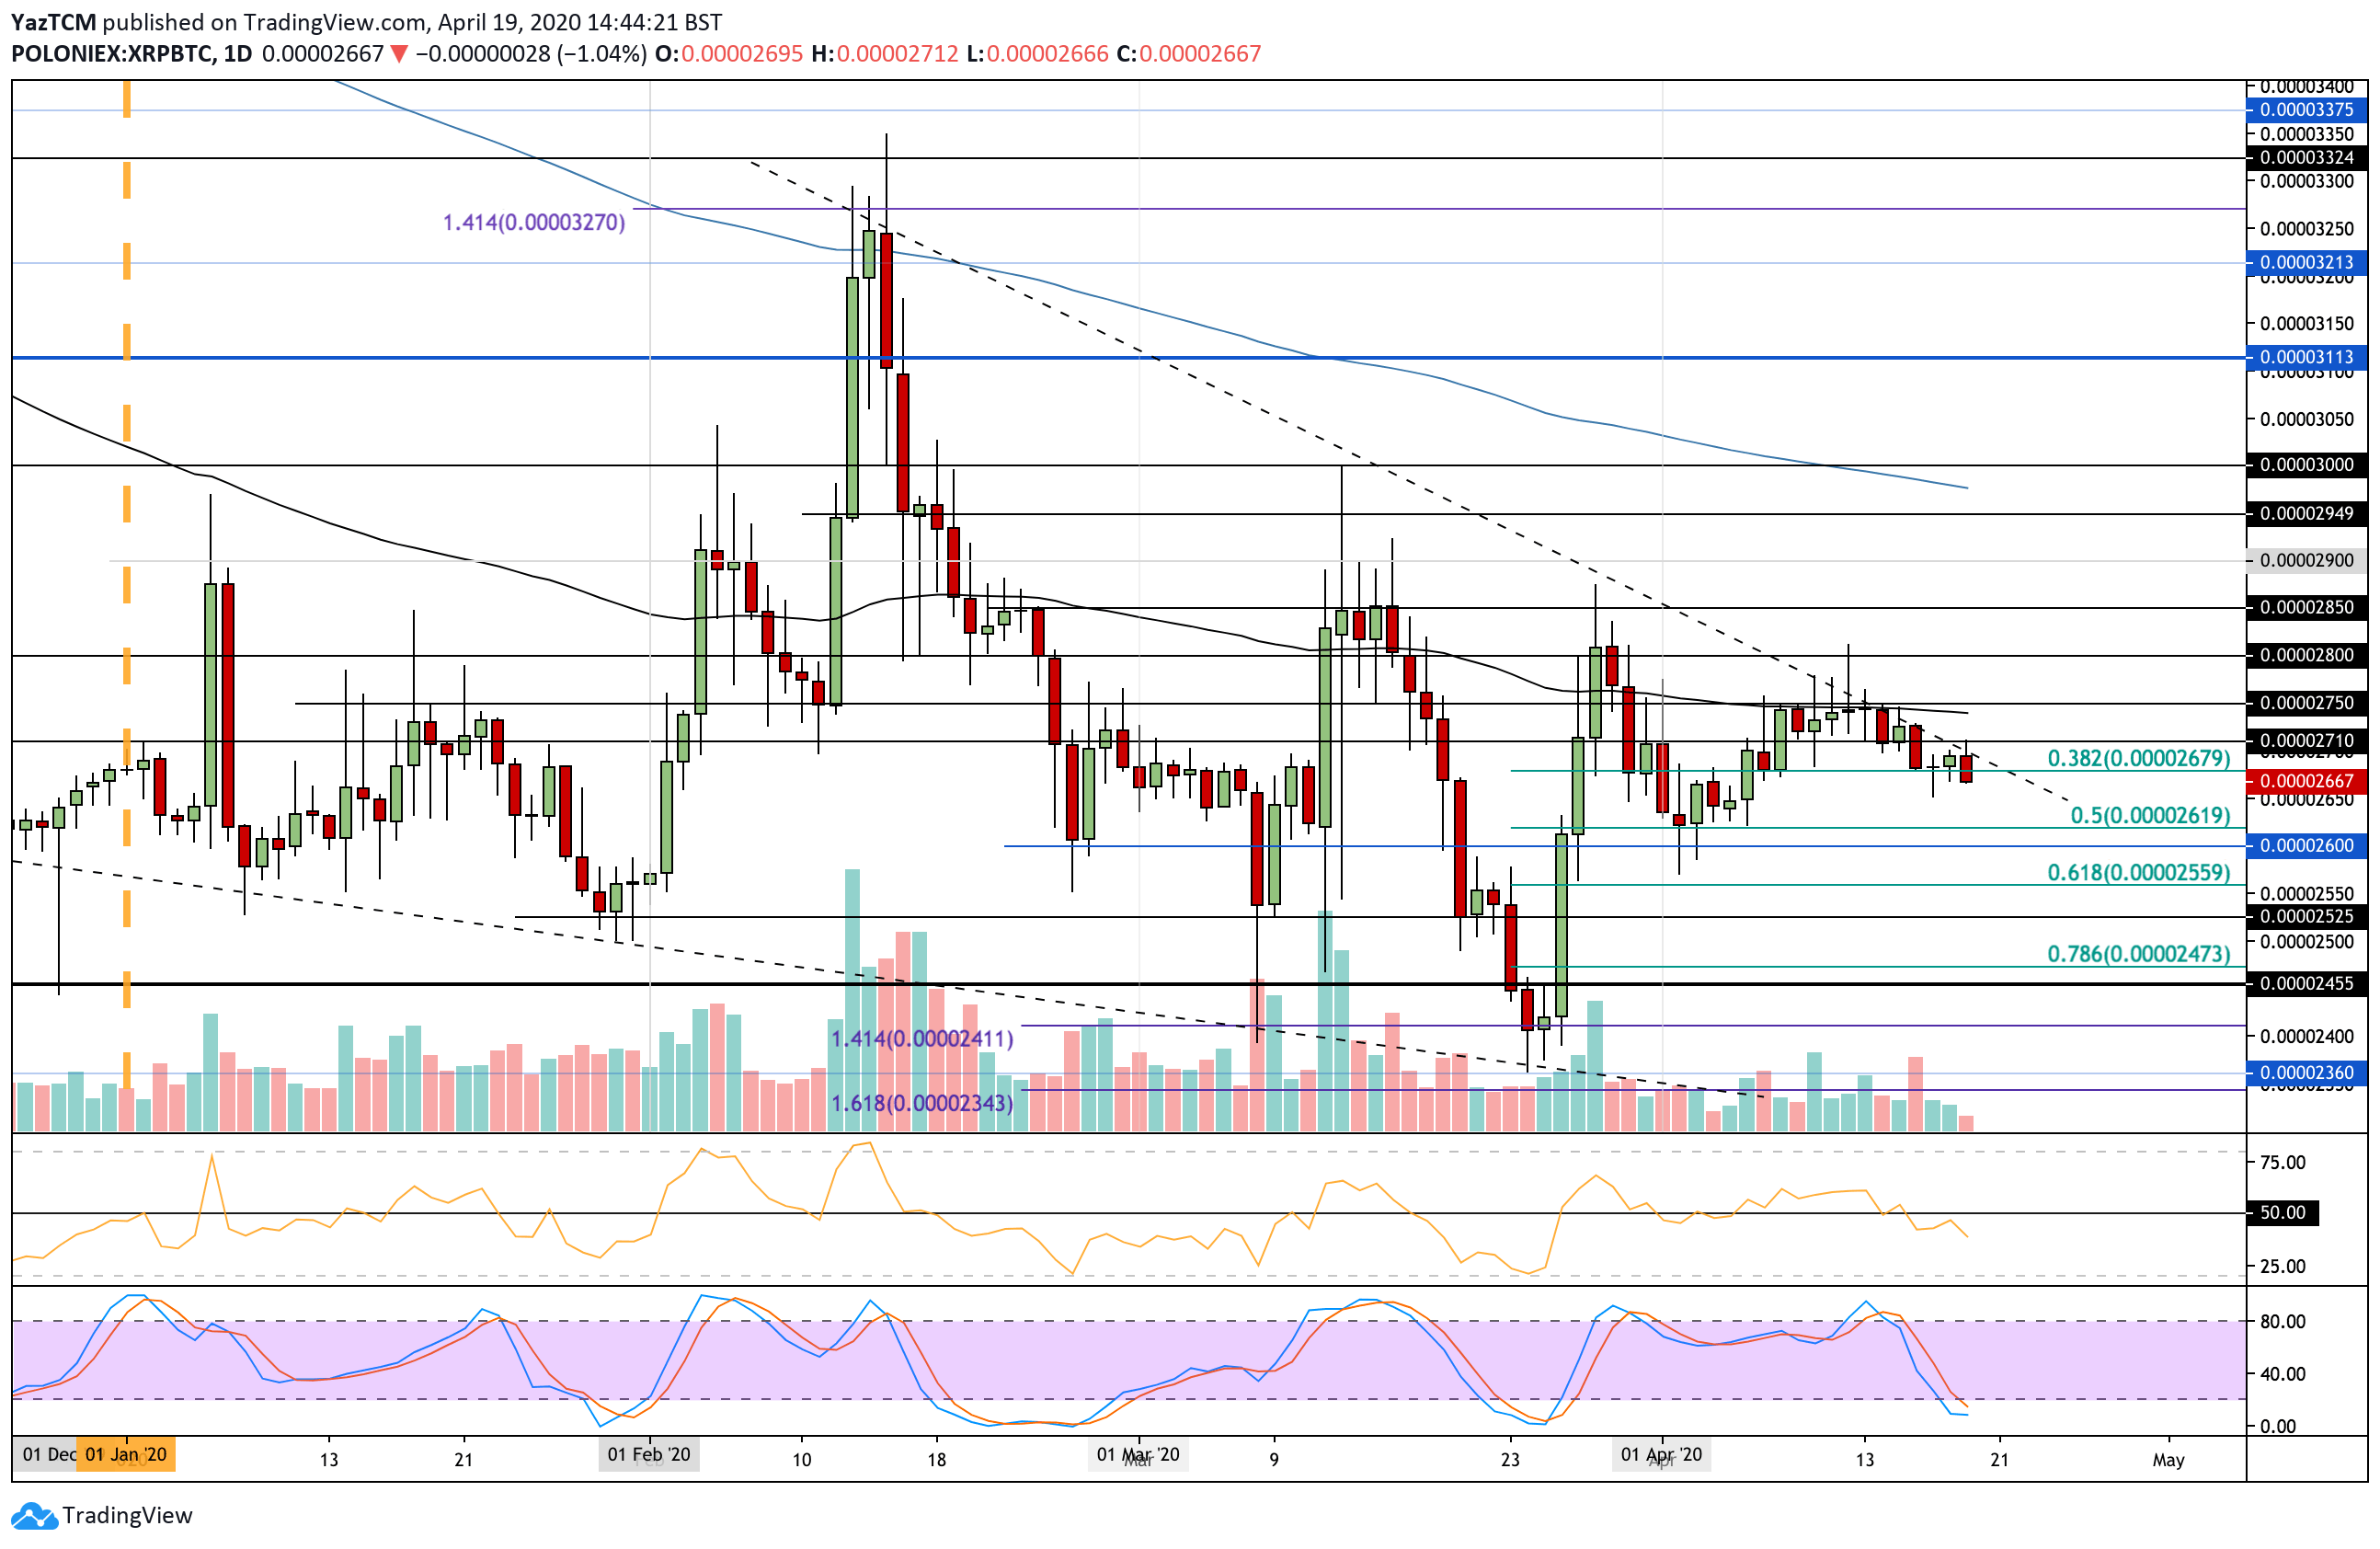
XRP/BTC – Ripple Breaks .382 Fib Support
Against Bitcoin, XRP was trading above support at 2680 SAT (.382 Fib Retracement) throughout the past week. XRP dropped beneath this support as it heads toward 2650 SAT.
The daily candle has not yet closed, however, if it does close beneath 2680 SAT today, XRP can be expected to unwind back toward 2600 SAT.
XRP-BTC Short Term Price Prediction
If the sellers push further beneath 2650 SAT, support can be found at 2620 SAT (.5 Fib Retracement). This is closely followed with support at 2600 SAT and 2560 SAT (.618 Fib Retracement).
On the other side, the first level of major resistance lies at 2710 SAT. Above this, and resistance lies at 2750 (100-days EMA) and 2800 SAT.
The RSI has dropped beneath 50, which indicates that the sellers are in charge of the market momentum. The Stochastic RSI is in oversold conditions, and a bullish crossover signal will be the first sign that the selling pressure is fading.