XRP saw an 8% price increase over the last week as it trades for %excerpt%.161.The cryptocurrency is now trading within an acute ascending triangle pattern as it struggles to break above %excerpt%.171.Against Bitcoin, XRP created fresh lows for 2020 after breaking beneath 2455 SAT to reach 2360 SAT.Key Support & Resistance LevelsXRP/USD:Support: %excerpt%.16, %excerpt%.14, %excerpt%.136.Resistance: %excerpt%.171, %excerpt%.182, %excerpt%.191.XRP/BTC:Support: 2700 SAT, 2650 SAT, 2600 SAT.Resistance: 2410 SAT, 2360 SAT, 2290 SAT.XRP/USD: Ripple Trading Within Ascending Triangle Pattern.XRP has traded within a range between %excerpt%.136 and %excerpt%.171 since the recent price crash seen on March 12th. The cryptocurrency has slowly been grinding higher as it trades above a rising trend line. However, it struggles to make any ground above %excerpt%.171. This means
Topics:
Yaz Sheikh considers the following as important: Ripple (XRP) Price, XRP Analysis
This could be interesting, too:
Jordan Lyanchev writes Ripple’s (XRP) Surge to Triggers Over Million in Short Liquidations
Jordan Lyanchev writes Trump Confirms Work on Strategic Crypto Reserve: XRP, ADA, SOL Included
Mandy Williams writes Ripple Releases Institutional DeFi Roadmap for XRP Ledger in 2025
Jordan Lyanchev writes ChatGPT and DeepSeek Analyze Ripple’s (XRP) Price Potential for 2025
- XRP saw an 8% price increase over the last week as it trades for $0.161.
- The cryptocurrency is now trading within an acute ascending triangle pattern as it struggles to break above $0.171.
- Against Bitcoin, XRP created fresh lows for 2020 after breaking beneath 2455 SAT to reach 2360 SAT.
Key Support & Resistance Levels
XRP/USD:
Support: $0.16, $0.14, $0.136.
Resistance: $0.171, $0.182, $0.191.
XRP/BTC:
Support: 2700 SAT, 2650 SAT, 2600 SAT.
Resistance: 2410 SAT, 2360 SAT, 2290 SAT.
XRP/USD: Ripple Trading Within Ascending Triangle Pattern.
XRP has traded within a range between $0.136 and $0.171 since the recent price crash seen on March 12th. The cryptocurrency has slowly been grinding higher as it trades above a rising trend line. However, it struggles to make any ground above $0.171. This means that XRP is now trading within an ascending triangle pattern.
XRP would need to break this triangle to dictate the next direction it will head toward.
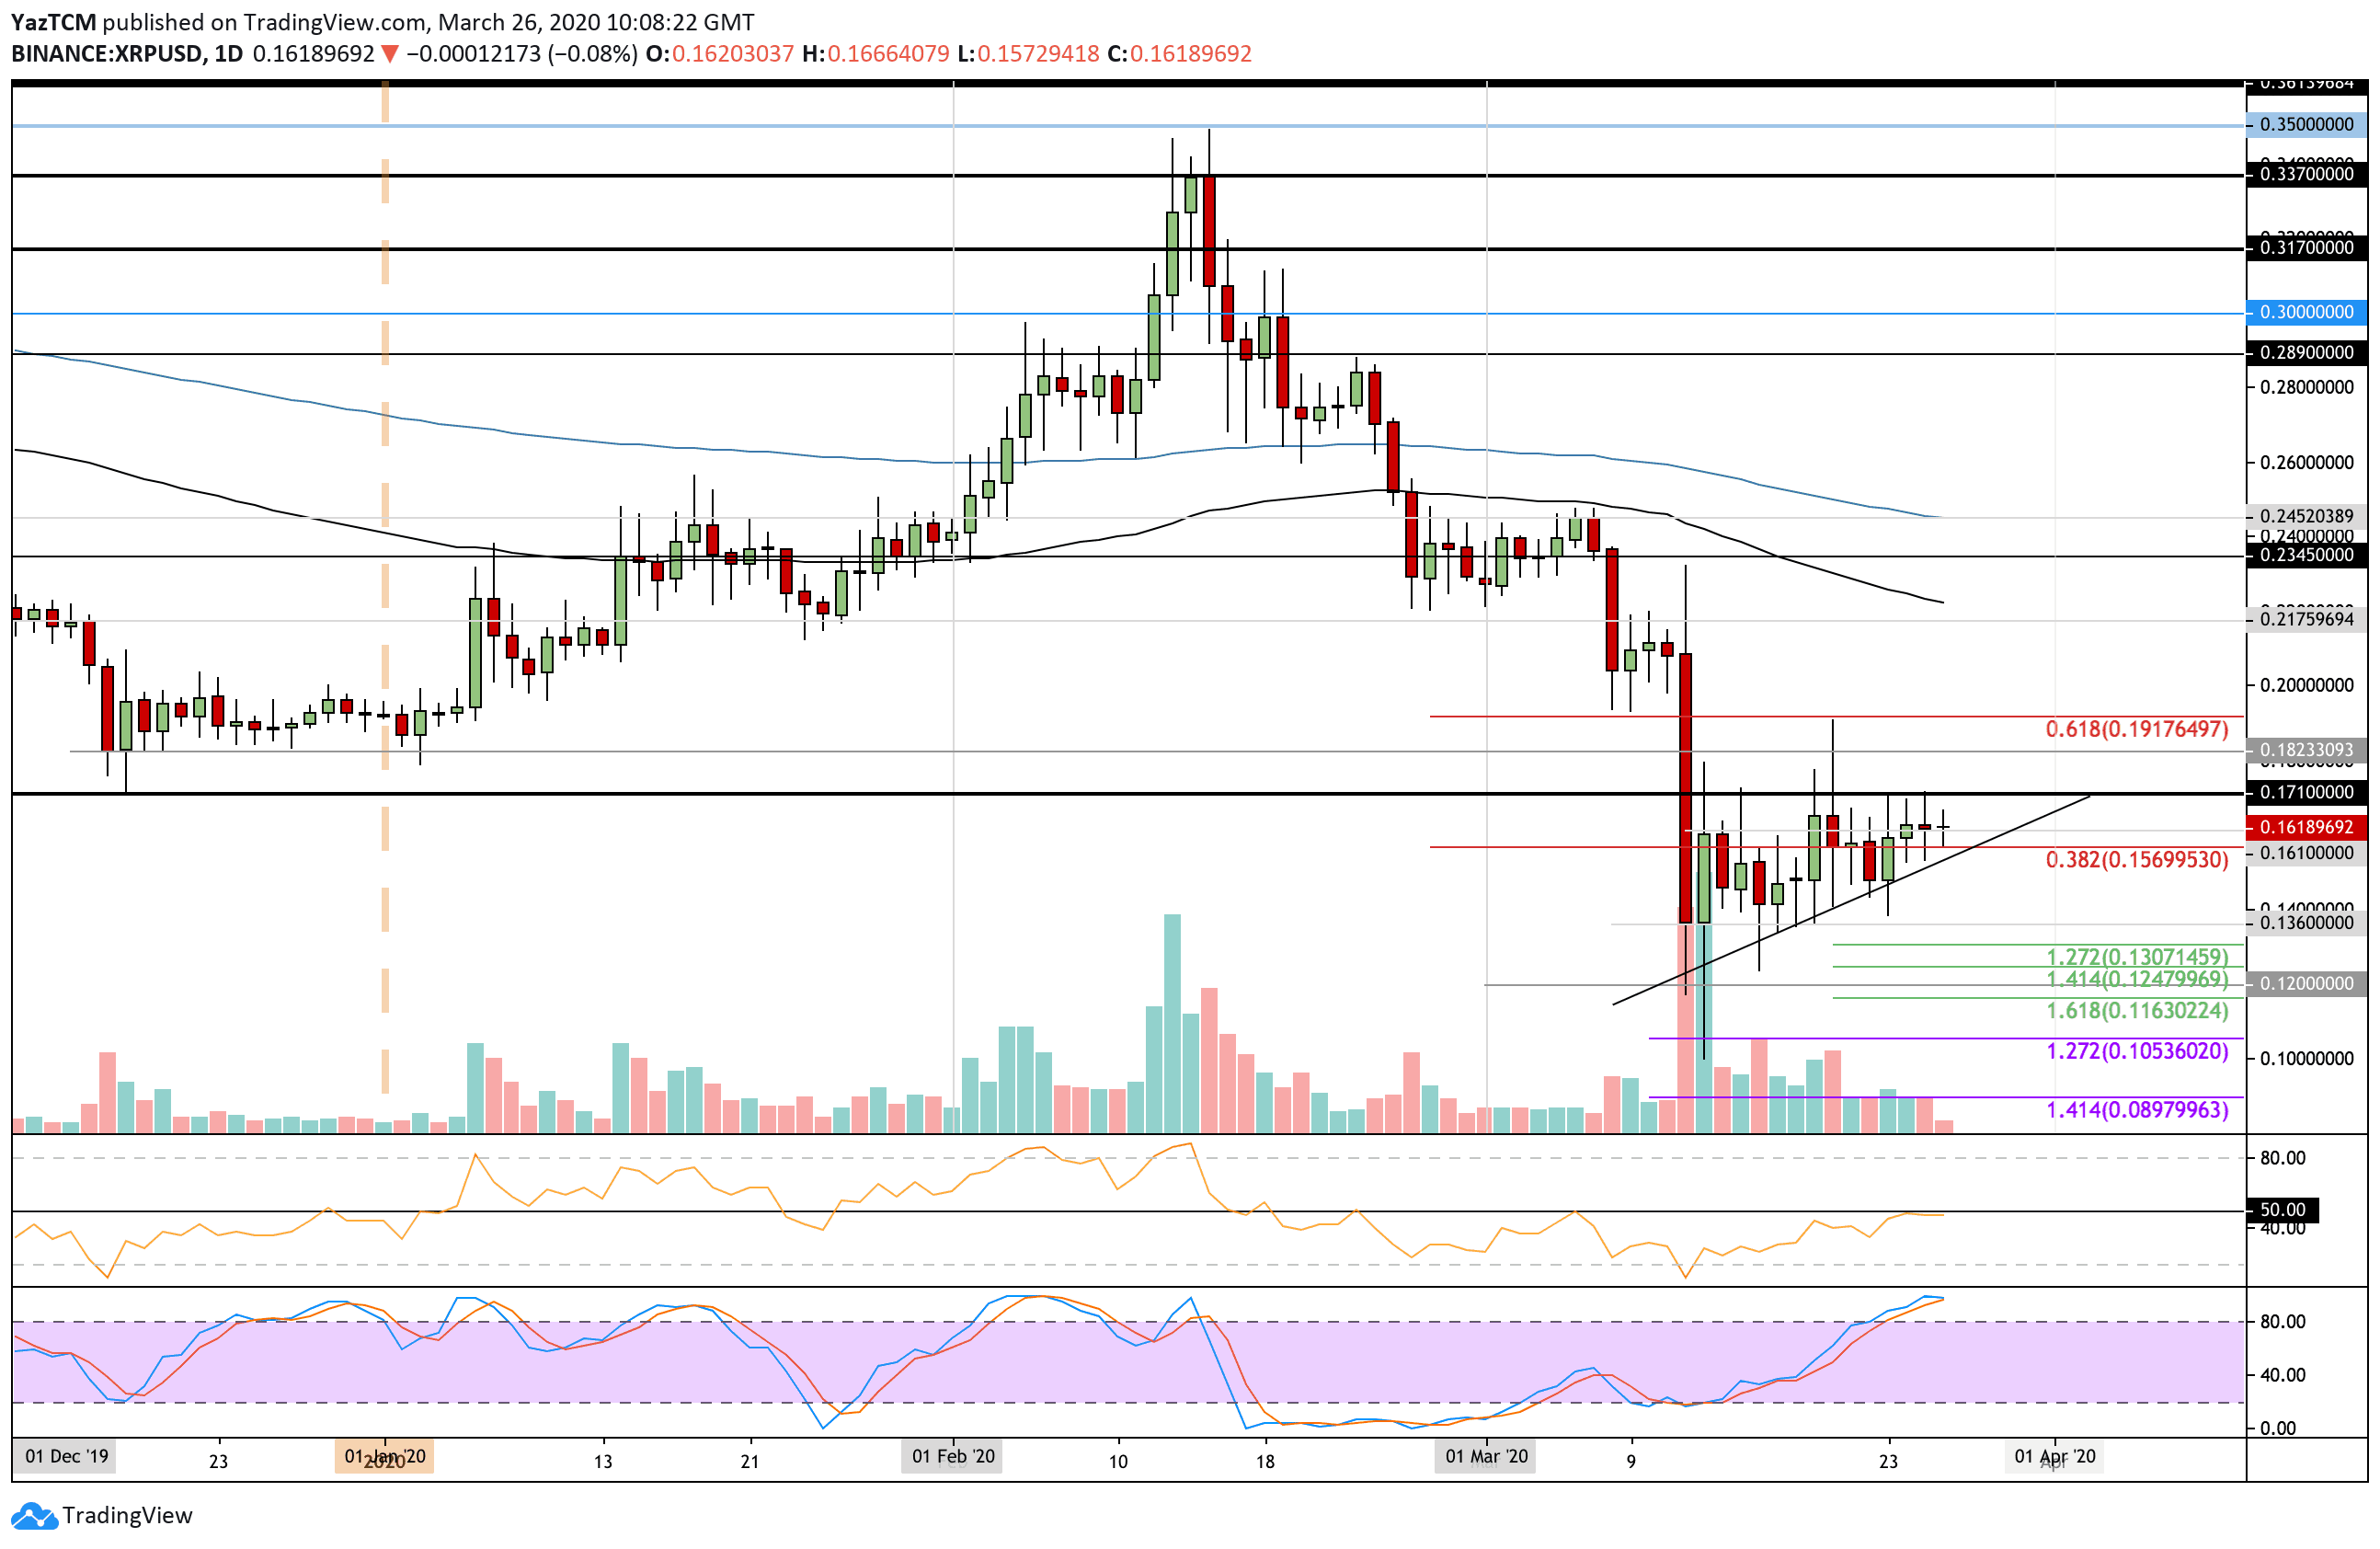
XRP-USD Short Term Price Prediction
From above, resistance is first located at the upper boundary of the triangle at $0.171. Above this, resistance lies at $0.182, $0.191 (bearish .618 Fib Retracement level), and $0.20.
On the other side, the first levels of support lie at $0.16 and the rising trend line. Beneath the trend line, support lies at $0.14, $0.136, and $0.13. If the sellers push beneath $0.13, support is located at $0.125, $0.12, and $0.11.
The RSI has returned to the 50 level to indicate indecision between the bulls and bears. It would need to climb above 50 to be able to break the upper boundary of the triangle.
Worryingly, the Stochastic RSI is in overbought conditions and is primed for a bearish crossover signal that is likely to send the coin beneath the triangle.
XRP/BTC: Ripple Creates Fresh 2020 Lows Against Bitcoin
Against Bitcoin, XRP penetrated beneath the previous support at 2525 SAT and continued to fall to create a fresh low for 2020 at 2360 SAT, which is a price that has not been seen since September 2019.
More specifically, the market found solid support at 2410 SAT (downside 1.414 Fib Extension) that allowed it to bounce back toward 2455 SAT.
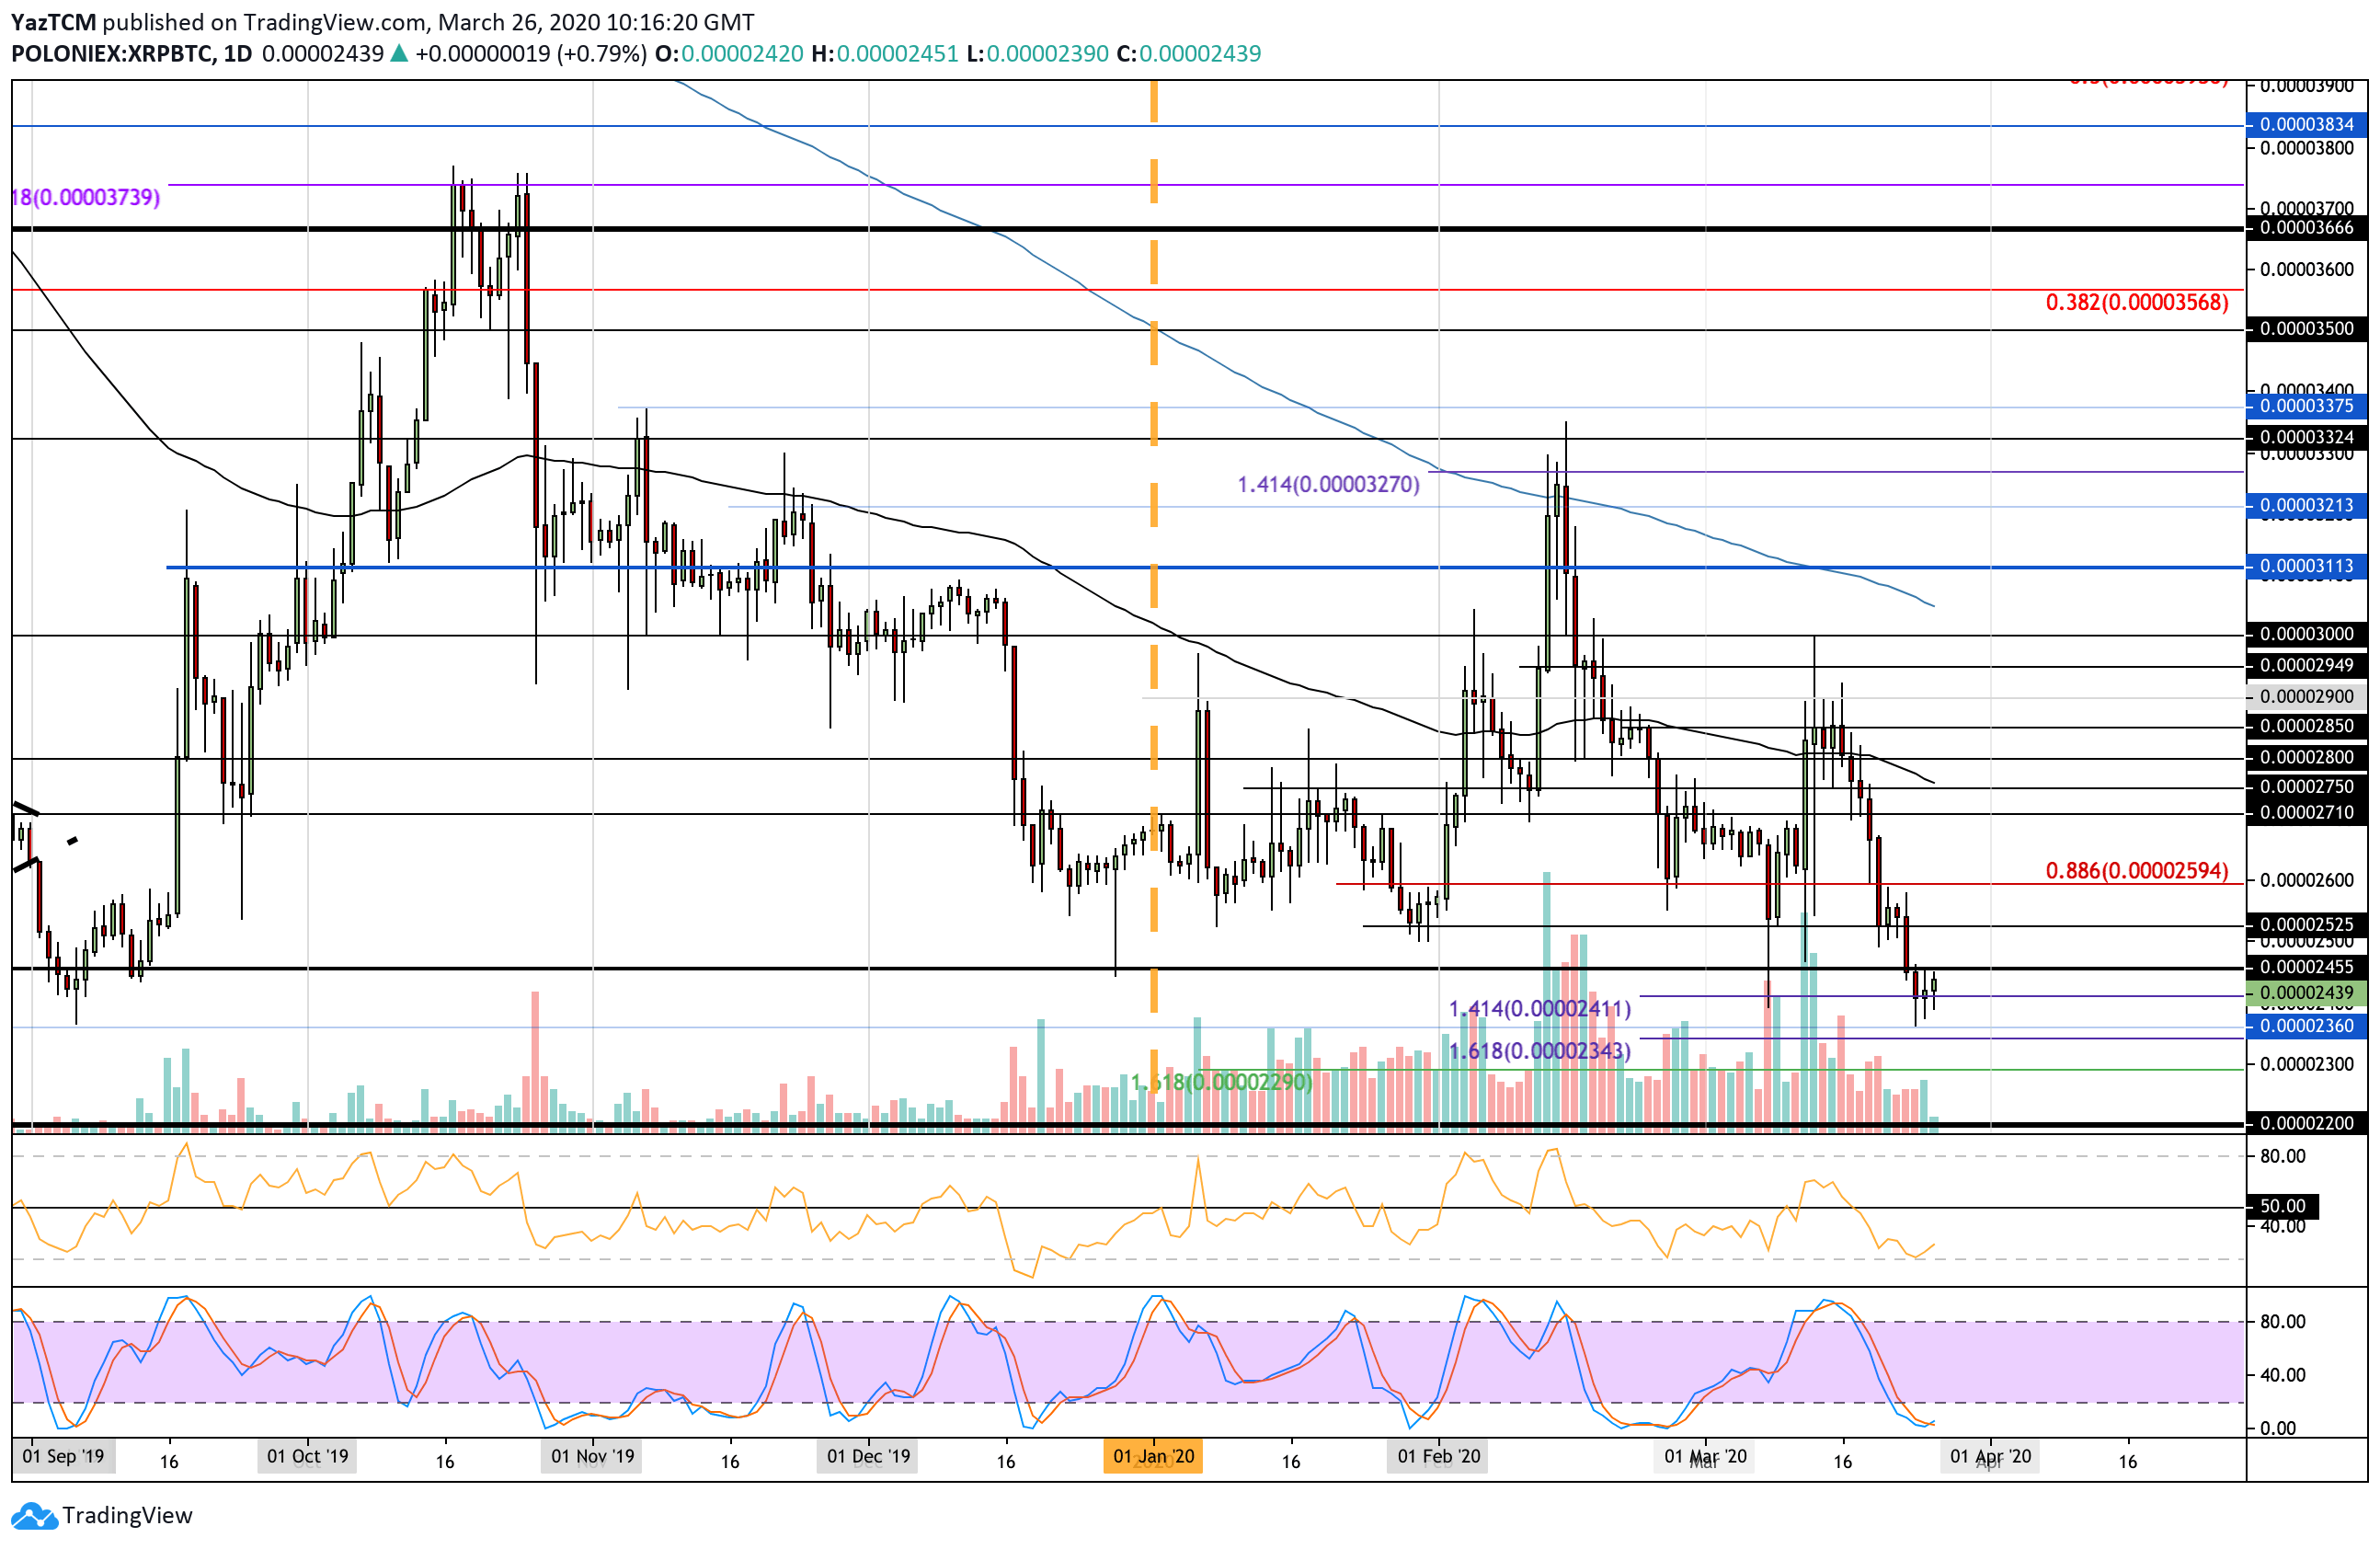
XRP-BTC Short Term Price Prediction
From above, if the bulls can break above 2455 SAT, resistance is expected at 2525 SAT, 2600 SAT, and 2710 SAT.
On the other side, support lies at 2410 SAT and 2360 SAT. Beneath this, support is expected at 2340 SAT and 2290 SAT (downside 1.618 Fib Extension).
The RSI has bounced from extremely oversold conditions as the selling pressure starts to show the initial signs of fading. Additionally, the Stochastic RSI is also extremely oversold and is primed for a bullish crossover signal that should send the market higher.