XRP witnessed a small increase of 2.5% over the past 24 hours as it trades marginally below %excerpt%.16.The cryptocurrency fell from a high of %excerpt%.19 recently but managed to stay above %excerpt%.157 over the past two days.Against Bitcoin, XRP continues to struggle as the buyers try to keep it above 2525 SAT support.Key Support & Resistance LevelsXRP/USD:Support: %excerpt%.15, %excerpt%.14, %excerpt%.136.Resistance: %excerpt%.161, %excerpt%.171, %excerpt%.182.XRP/BTC:Support: 2525 SAT, 2500 SAT, 2455 SAT.Resistance: 2600 SAT, 2710 SAT, 2750 SAT.XRP/USD: Ripple Falls Into Previous Trading RangeSince our last analysis, XRP went on to climb into the resistance at %excerpt%.191 (bearish .618 Fib Retracement) but fell to the current support of %excerpt%.156. It has closed above this support for the past 2-days which shows that the bulls are battling for some form
Topics:
Yaz Sheikh considers the following as important: Ripple (XRP) Price, XRP Analysis
This could be interesting, too:
Mandy Williams writes Ripple Releases Institutional DeFi Roadmap for XRP Ledger in 2025
Jordan Lyanchev writes ChatGPT and DeepSeek Analyze Ripple’s (XRP) Price Potential for 2025
CryptoVizArt writes XRP Breakout Imminent? Ripple Price Analysis Suggests a Decisive Move
Dimitar Dzhondzhorov writes 6 Reasons Why This Finance Expert Dumped His Ripple (XRP) Holdings
- XRP witnessed a small increase of 2.5% over the past 24 hours as it trades marginally below $0.16.
- The cryptocurrency fell from a high of $0.19 recently but managed to stay above $0.157 over the past two days.
- Against Bitcoin, XRP continues to struggle as the buyers try to keep it above 2525 SAT support.
Key Support & Resistance Levels
XRP/USD:
Support: $0.15, $0.14, $0.136.
Resistance: $0.161, $0.171, $0.182.
XRP/BTC:
Support: 2525 SAT, 2500 SAT, 2455 SAT.
Resistance: 2600 SAT, 2710 SAT, 2750 SAT.
XRP/USD: Ripple Falls Into Previous Trading Range
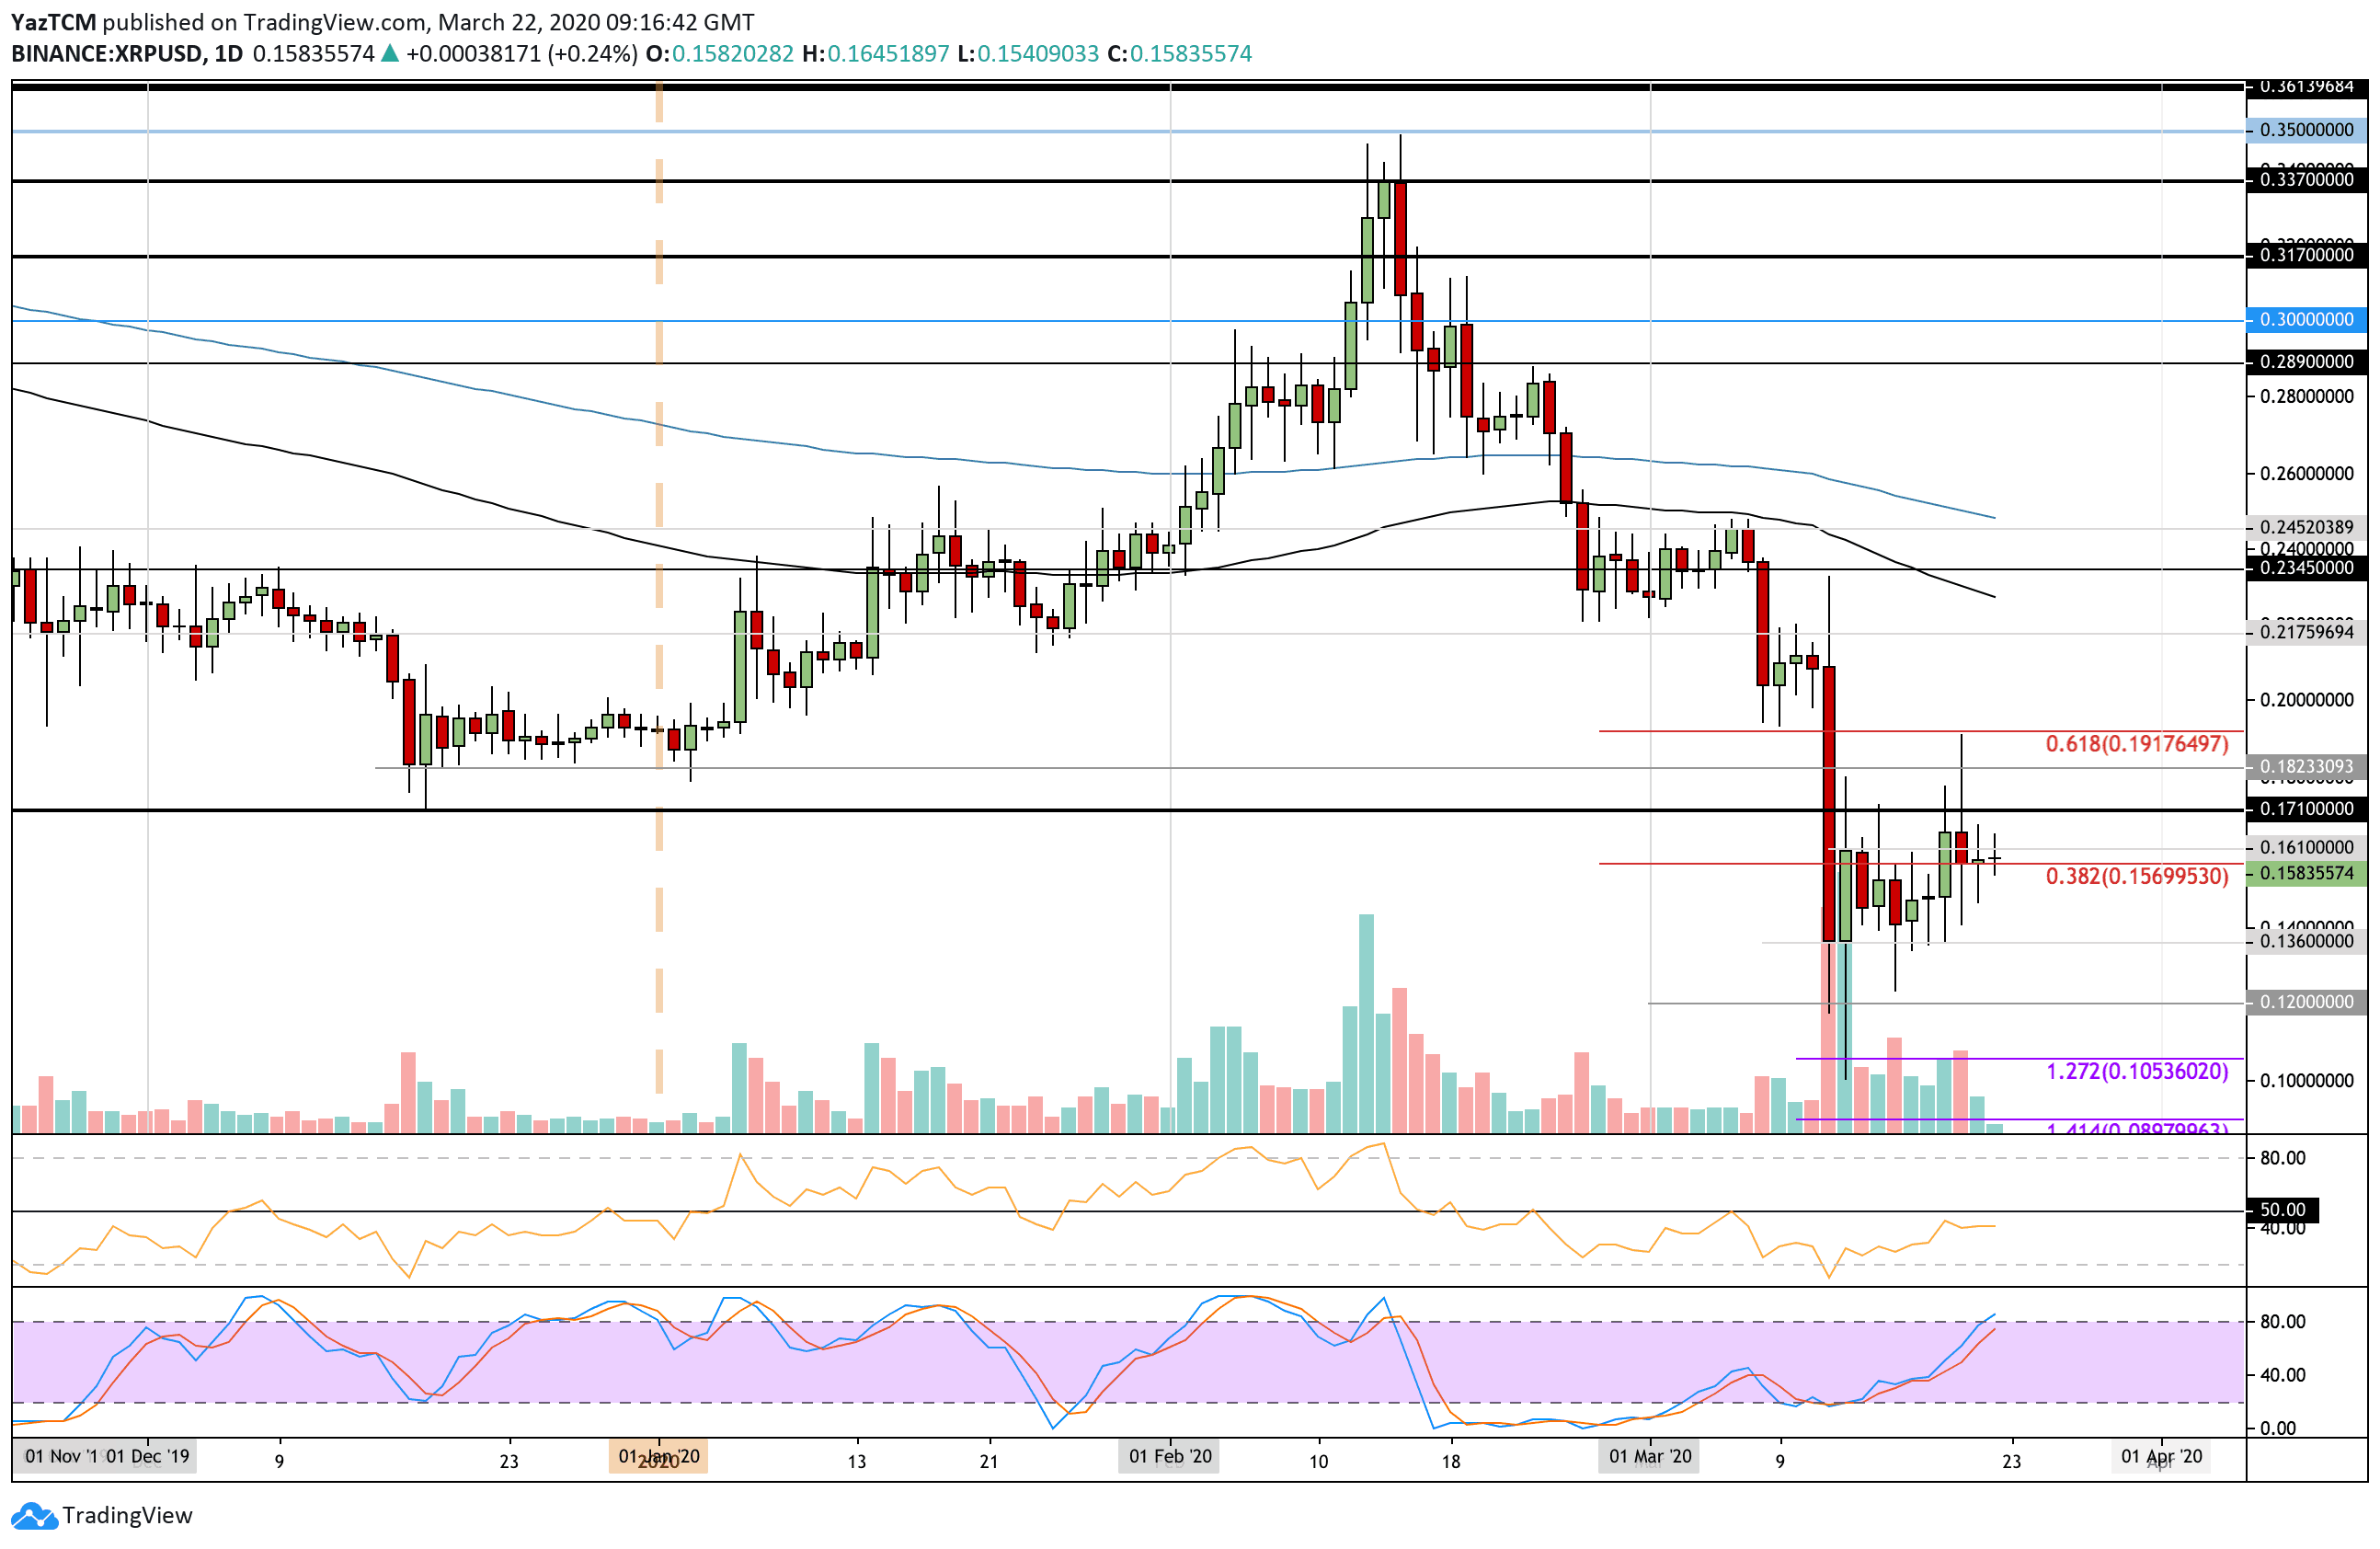
Since our last analysis, XRP went on to climb into the resistance at $0.191 (bearish .618 Fib Retracement) but fell to the current support of $0.156. It has closed above this support for the past 2-days which shows that the bulls are battling for some form of control.
Nevertheless, XRP has returned into last week’s trading range between $0.136 and $0.161 and must close above $0.17 for it to climb higher.

XRP/USD Short Term Price Prediction
If the bulls rebound from the current support and break $0.161, the first level of higher resistance lies at $0.171. Above this, resistance is found at $0.182, $0.191, and $0.20.
On the other side, if the sellers push beneath $0.157, support can be found at $0.15, $0.14, and $0.136. Additional support lies at $0.13, $0.12, and $0.10.
The RSI has been climbing. However, it remains beneath 50, which shows the sellers are still in charge of the market momentum. Additionally, the Stochastic RSI is approaching overbought conditions, and a bearish crossover signal would send XRP lower.
XRP/BTC: Ripple Returns To 2020 Price Support
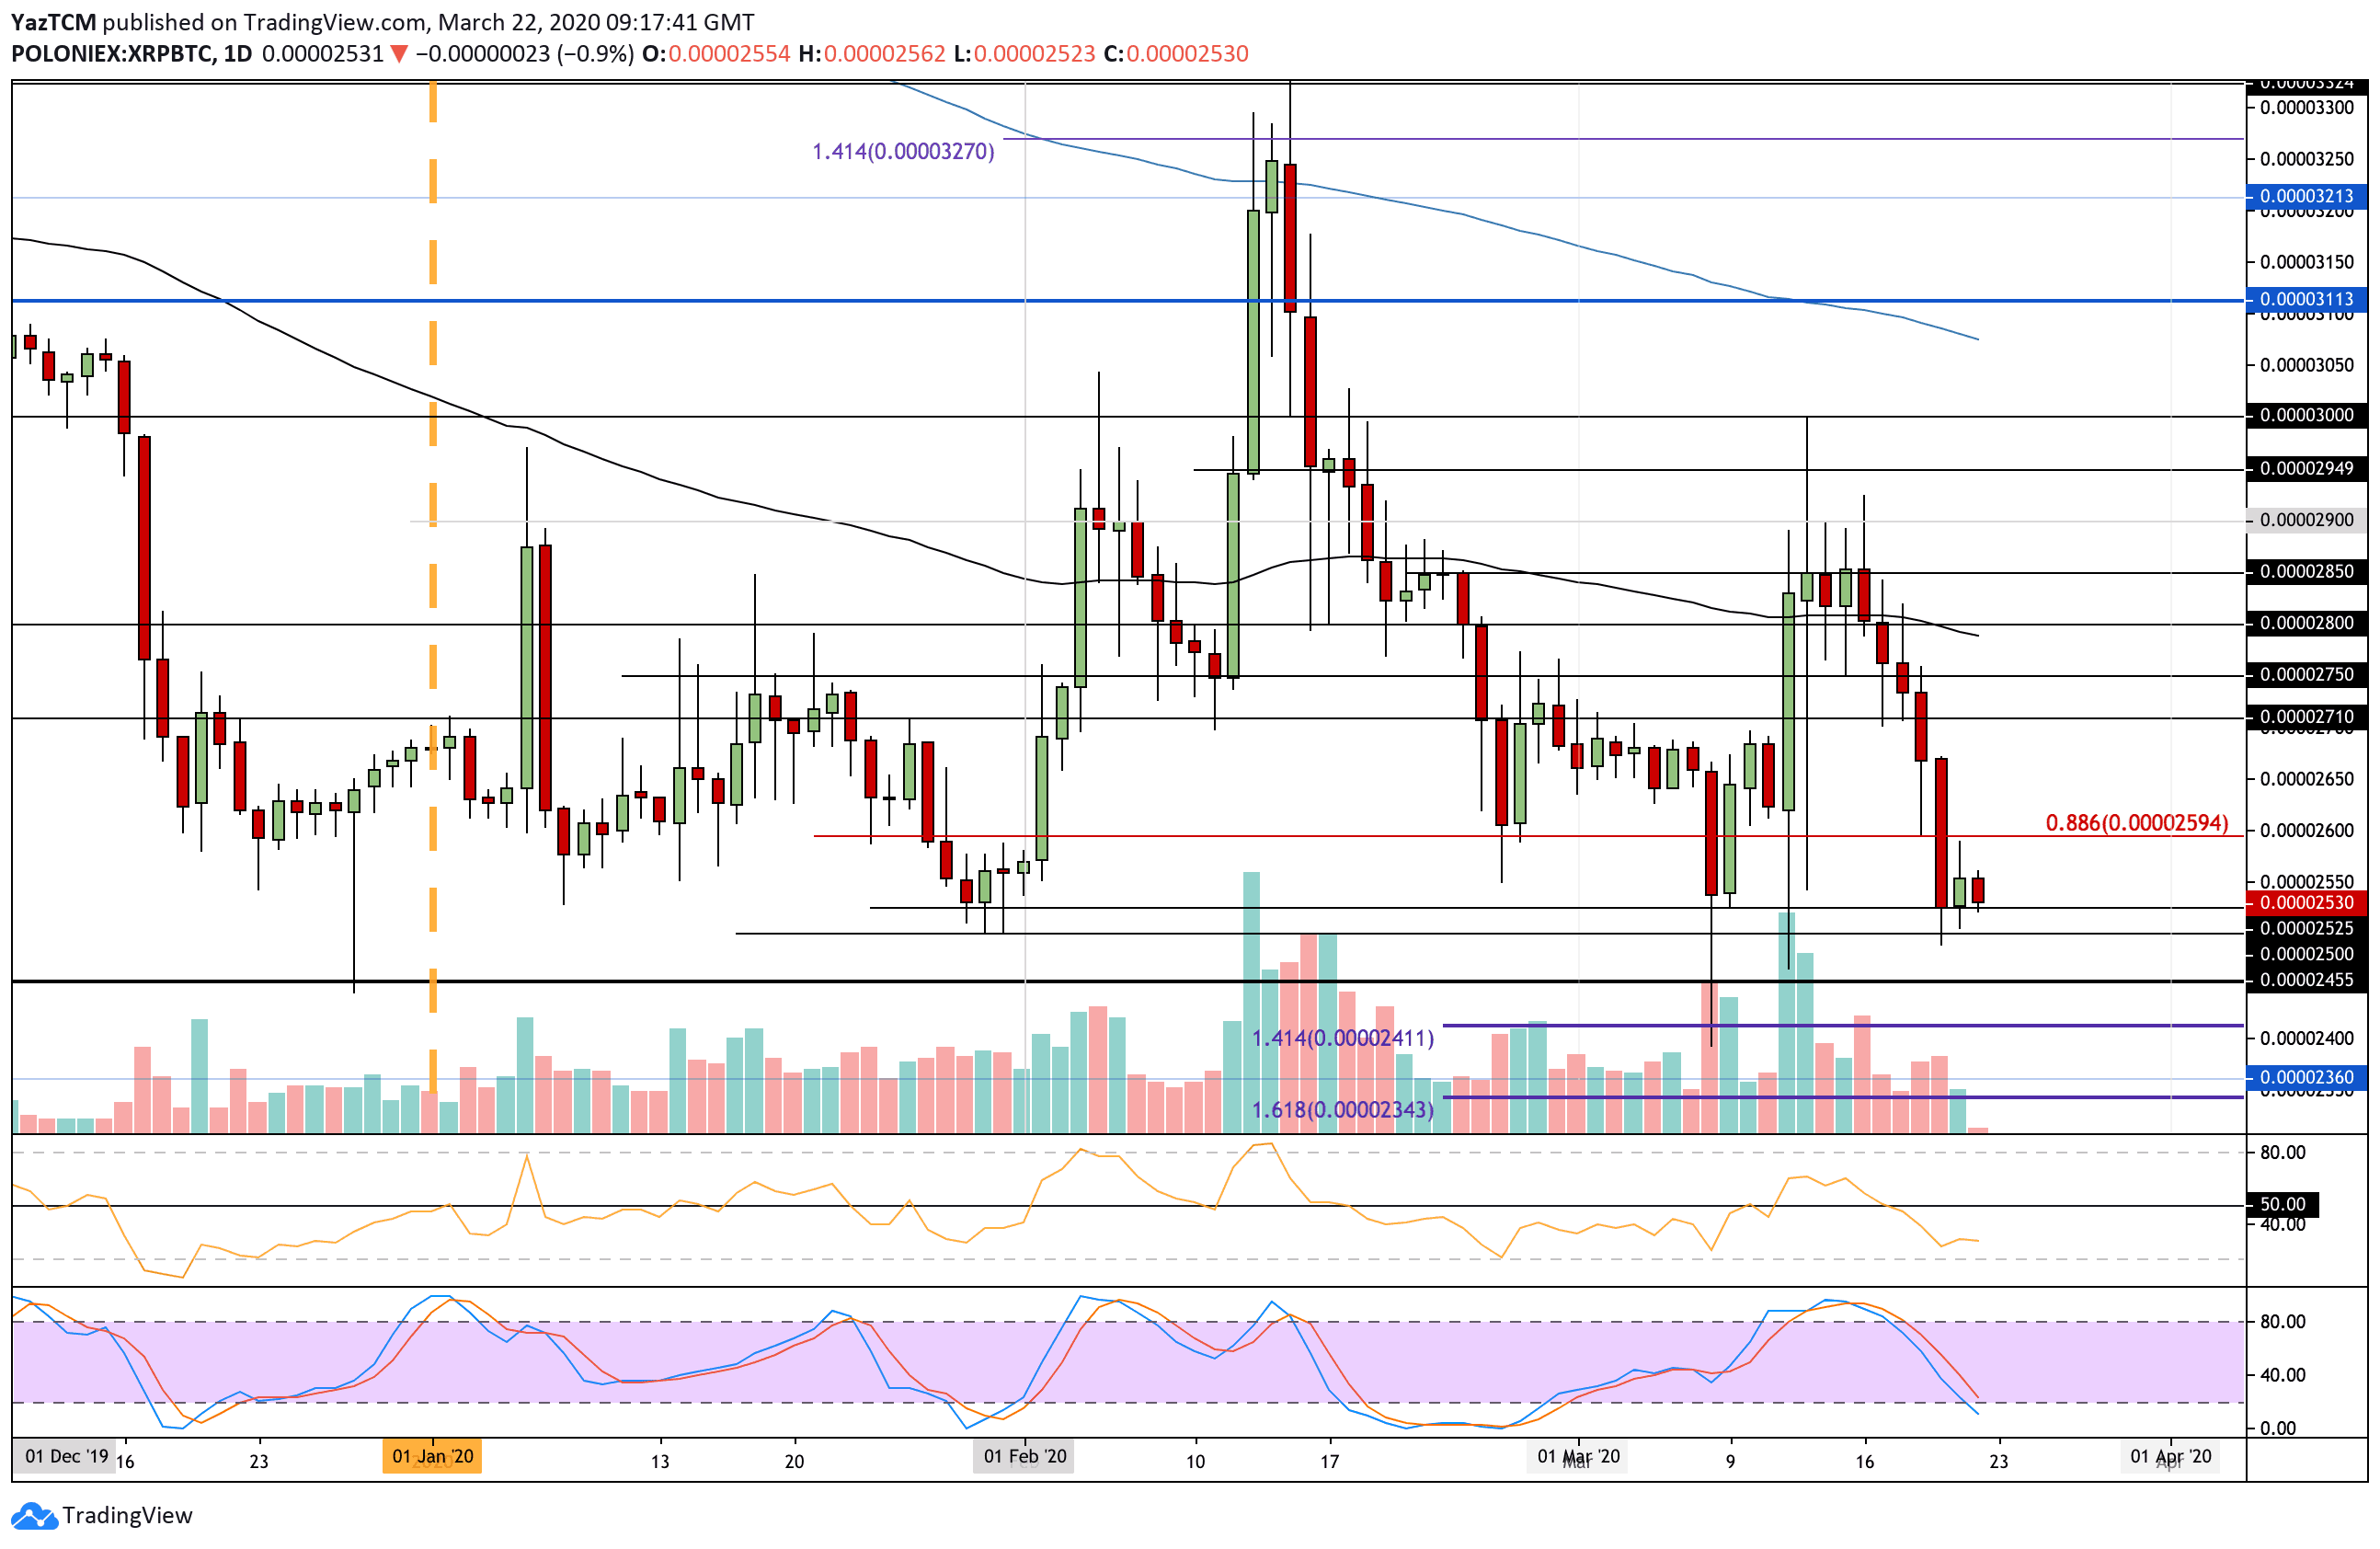
Against Bitcoin, XRP fell beneath the 2710 SAT support and continued to plummet until reaching 2525 SAT, where it currently trades. The cryptocurrency has been bearish against Bitcoin since finding resistance at the 2850 SAT level earlier in the week.
A break beneath 2500 SAT could cause XRP to turn extremely bearish against Bitcoin, and it would likely head toward 2400 SAT.

XRP/BTC Short Term Price Prediction
If the sellers break 2525 SAT, support can be found at 2500 SAT, 2455 SAT, and 2411 SAT. If they push beneath 2400 SAT, added support lies at 2350 SAT.
On the other hand, if the bulls can rebound from here, the first level of resistance lies at 2600 SAT. Above this, resistance lies at 2710 SAT, 2750 SAT, and 2800 SAT.
The RSI has plummetted beneath the 50 level as the sellers take control over the market momentum. Luckily, the Stochastic RSI is approaching oversold conditions, and a bullish crossover signal here would show the selling pressure is starting to fade.
