Over the past three days, we saw Bitcoin breaking above the ,000 milestone, and even succeeding in breaking the next significant resistance at 00 for a few hours, including toping above K on some exchanges.However, Bitcoin got quickly rejected and retraced back to the K range, yes, the same price range from the second half of 2018.Just as a side note, the 40 top that was reached on Bitstamp is not a coincidence: Looking at the following daily chart, we can see the Golden Fibonacci retracement level of 61.8% lies around that price area (70).This also becomes the critical level Bitcoin must overcome in order to turn the short-term bearish momentum.Optimism Above K?As of writing these lines, Bitcoin is forming a bullish triangle pattern on the hourly chart, which can also be
Topics:
Yuval Gov considers the following as important: Bitcoin (BTC) Price, BTC Analysis, btcusd
This could be interesting, too:
Chayanika Deka writes XRP, SOL, and ADA Inclusion in US Crypto Reserve Pushes Traders on Edge
Chayanika Deka writes Why Arthur Hayes Is Bullish on Bitcoin Under Trump’s Economic Strategy
Mandy Williams writes Why the Bitcoin Market Is Stuck—and the Key Metric That Could Change It: CryptoQuant CEO
Wayne Jones writes Metaplanet Acquires 156 BTC, Bringing Total Holdings to 2,391
Over the past three days, we saw Bitcoin breaking above the $6,000 milestone, and even succeeding in breaking the next significant resistance at $6400 for a few hours, including toping above $7K on some exchanges.
However, Bitcoin got quickly rejected and retraced back to the $6K range, yes, the same price range from the second half of 2018.
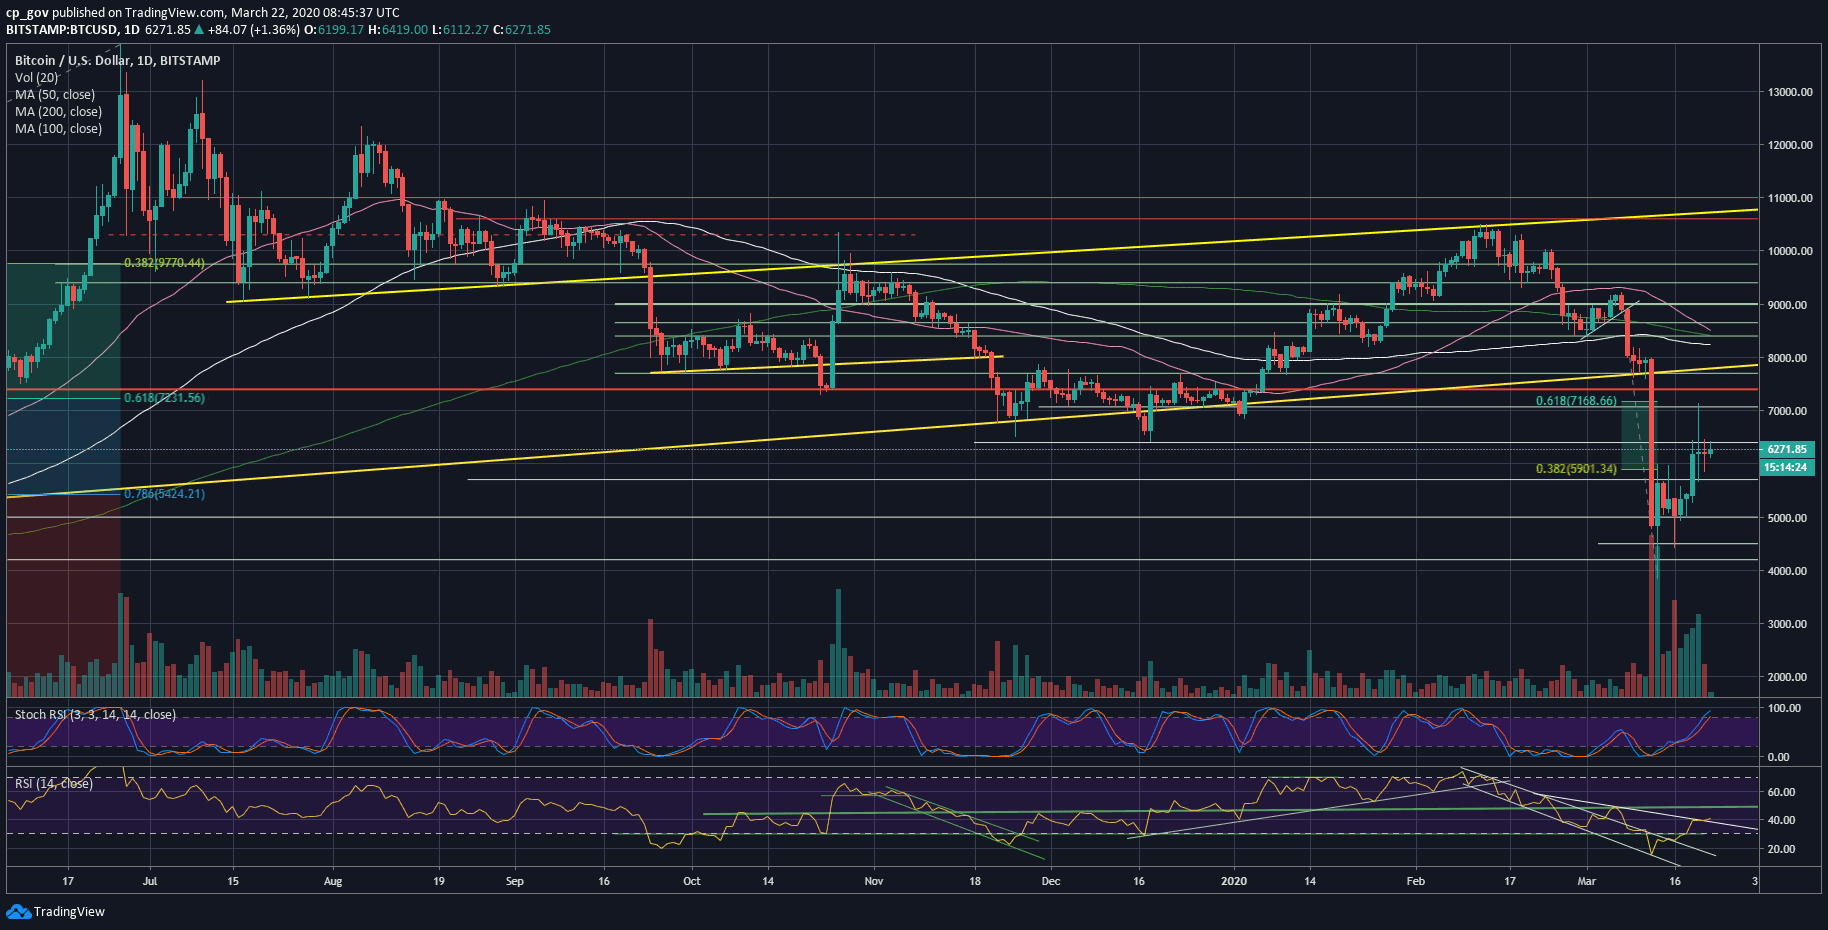
Just as a side note, the $7140 top that was reached on Bitstamp is not a coincidence: Looking at the following daily chart, we can see the Golden Fibonacci retracement level of 61.8% lies around that price area ($7170).
This also becomes the critical level Bitcoin must overcome in order to turn the short-term bearish momentum.
Optimism Above $6K?
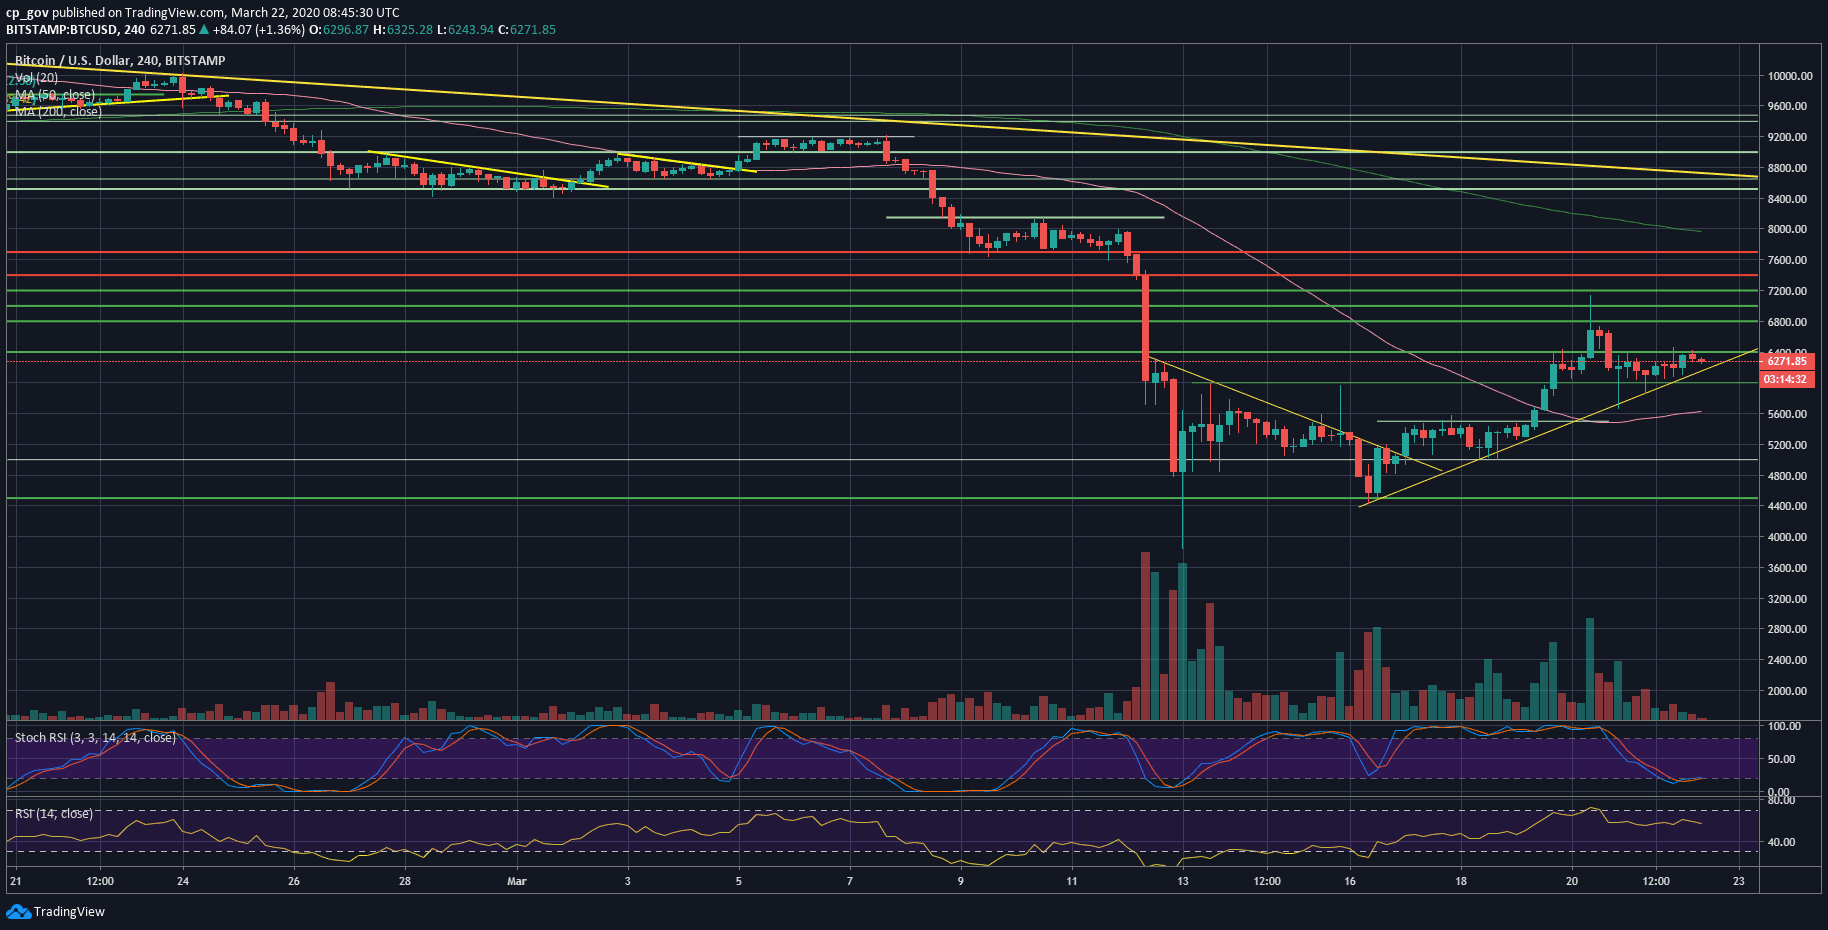
As of writing these lines, Bitcoin is forming a bullish triangle pattern on the hourly chart, which can also be seen on the following 4-hour chart.
Does this mean that Bitcoin will finally break the $6400 resistance on its way to stabilize above $7K? Possibly. But as mentioned here in our previous price analysis, the volatility is at a very high level, and Bitcoin is facing a situation it had never seen in its 11 years of existence, so caution is needed.
Next Move Coming?
Looking at the trading volume data, we can see that the volume is declining since reaching the peak above $7K on Thursday. This probably forecasts the next big price move is coming up in a matter of the next day.
Besides, during these times of the COVID19 virus, we can’t ignore the “external noises,” which is mainly the Wall Street equity markets. After another bloodbath throughout the whole week, it will be interesting to see how the markets will open their new week. And more interesting will be to watch Bitcoin’s reaction accordingly.
Total Market Cap: $177 billion
Bitcoin Market Cap: $115.7 billion
BTC Dominance Index: 65.0%
*Data by CoinGecko
Key Levels To Watch & Next Possible Targets
– Support/Resistance levels: As mentioned above, the first level of support would be the ascending trend-line (yellow) on the following 4-hour chart, along with the $6K mark.
The next support levels are $5800 (weak) and $5650, along with the 4-hour MA-50 line marked by pink. This is followed by $5500 resistance turned support.
From above, the first level of resistance is the price zone of $6300 – $6400. As mentioned here before, this is expected to be tough resistance for Bitcoin, and still does.
In case of a breakout, then the next resistance level is likely to be the $6800, followed by the $7000 benchmark and the high from Thursday around $7140 – $7200, which is the Golden Fib level.
– The RSI Indicator: The RSI is facing another resistance of the 40 level. This is a decision point for the momentum indicator. A bullish sign might be coming for the slight bullish divergence we see on the 4-hour chart’s RSI.
– Trading volume: discussed above.
BTC/USD BitStamp 4-Hour Chart
BTC/USD BitStamp 1-Day Chart