XRP dropped by a small 1% today as the cryptocurrency attempts to remain above the 100-days EMA.It is up by a total of 10% over the past 7-days as it trades at the %excerpt%.217 level.Against Bitcoin, XRP found strong support at 2455 SAT and has rebounded to reach 2500 SATKey Support & Resistance LevelsXRP/USD:Support: %excerpt%.21, %excerpt%.207, %excerpt%.20.Resistance: %excerpt%.226, %excerpt%.235, %excerpt%.245.XRP/BTC:Support: 2455 SAT, 2400 SAT, 2360 SAT.Resistance: 2560 SAT, 2600 SAT, 2620 SAT.XRP/USD: Ripple Battles To Remain Above 100-Day EMAXRP attempted to break above the resistance at %excerpt%.226 this weekend. However, it was turned away by the 200-days EMA as it closed beneath it. It has been struggling to close above the 200-days EMA ever since it penetrated above the %excerpt%.20 level 7-days ago.In today’s trading session, XRP
Topics:
Yaz Sheikh considers the following as important: Ripple (XRP) Price, XRP Analysis, xrpbtc, xrpusd
This could be interesting, too:
Jordan Lyanchev writes Ripple’s (XRP) Surge to Triggers Over Million in Short Liquidations
Jordan Lyanchev writes Trump Confirms Work on Strategic Crypto Reserve: XRP, ADA, SOL Included
Dimitar Dzhondzhorov writes Is a Major Ripple v. SEC Lawsuit Development Expected This Week? Here’s Why
Mandy Williams writes Ripple Releases Institutional DeFi Roadmap for XRP Ledger in 2025
- XRP dropped by a small 1% today as the cryptocurrency attempts to remain above the 100-days EMA.
- It is up by a total of 10% over the past 7-days as it trades at the $0.217 level.
- Against Bitcoin, XRP found strong support at 2455 SAT and has rebounded to reach 2500 SAT
Key Support & Resistance Levels
XRP/USD:
Support: $0.21, $0.207, $0.20.
Resistance: $0.226, $0.235, $0.245.
XRP/BTC:
Support: 2455 SAT, 2400 SAT, 2360 SAT.
Resistance: 2560 SAT, 2600 SAT, 2620 SAT.
XRP/USD: Ripple Battles To Remain Above 100-Day EMA
XRP attempted to break above the resistance at $0.226 this weekend. However, it was turned away by the 200-days EMA as it closed beneath it. It has been struggling to close above the 200-days EMA ever since it penetrated above the $0.20 level 7-days ago.
In today’s trading session, XRP dropped lower but managed to find solid support at the 100-days EMA around $0.207 where it bounced higher to reach the current level at $0.217.

XRP-USD Short Term Price Prediction
If the bulls push higher, they still need to contest the 200-days EMA resistance at $0.226. This area of resistance is further bolstered by a bearish .5 Fib Retracement at $0.225. Above the 200-days EMA, resistance lies at $0.235, $0.245, and $0.255 (bearish .618 Fib Retracement).
On the other hand, if the sellers push beneath $0.21 again, support is located at $0.207 (100-days EMA) and $0.20. Beneath this, added support lies at $0.192 (.382 Fib Retracement) and $0.18.
The RSI is falling which shows that the bullish momentum is fading. If it can remain above 50 on the retracement, XRP will still remain on the bullish footing. A break beneath the 50 line could see XRP headed below $0.20.
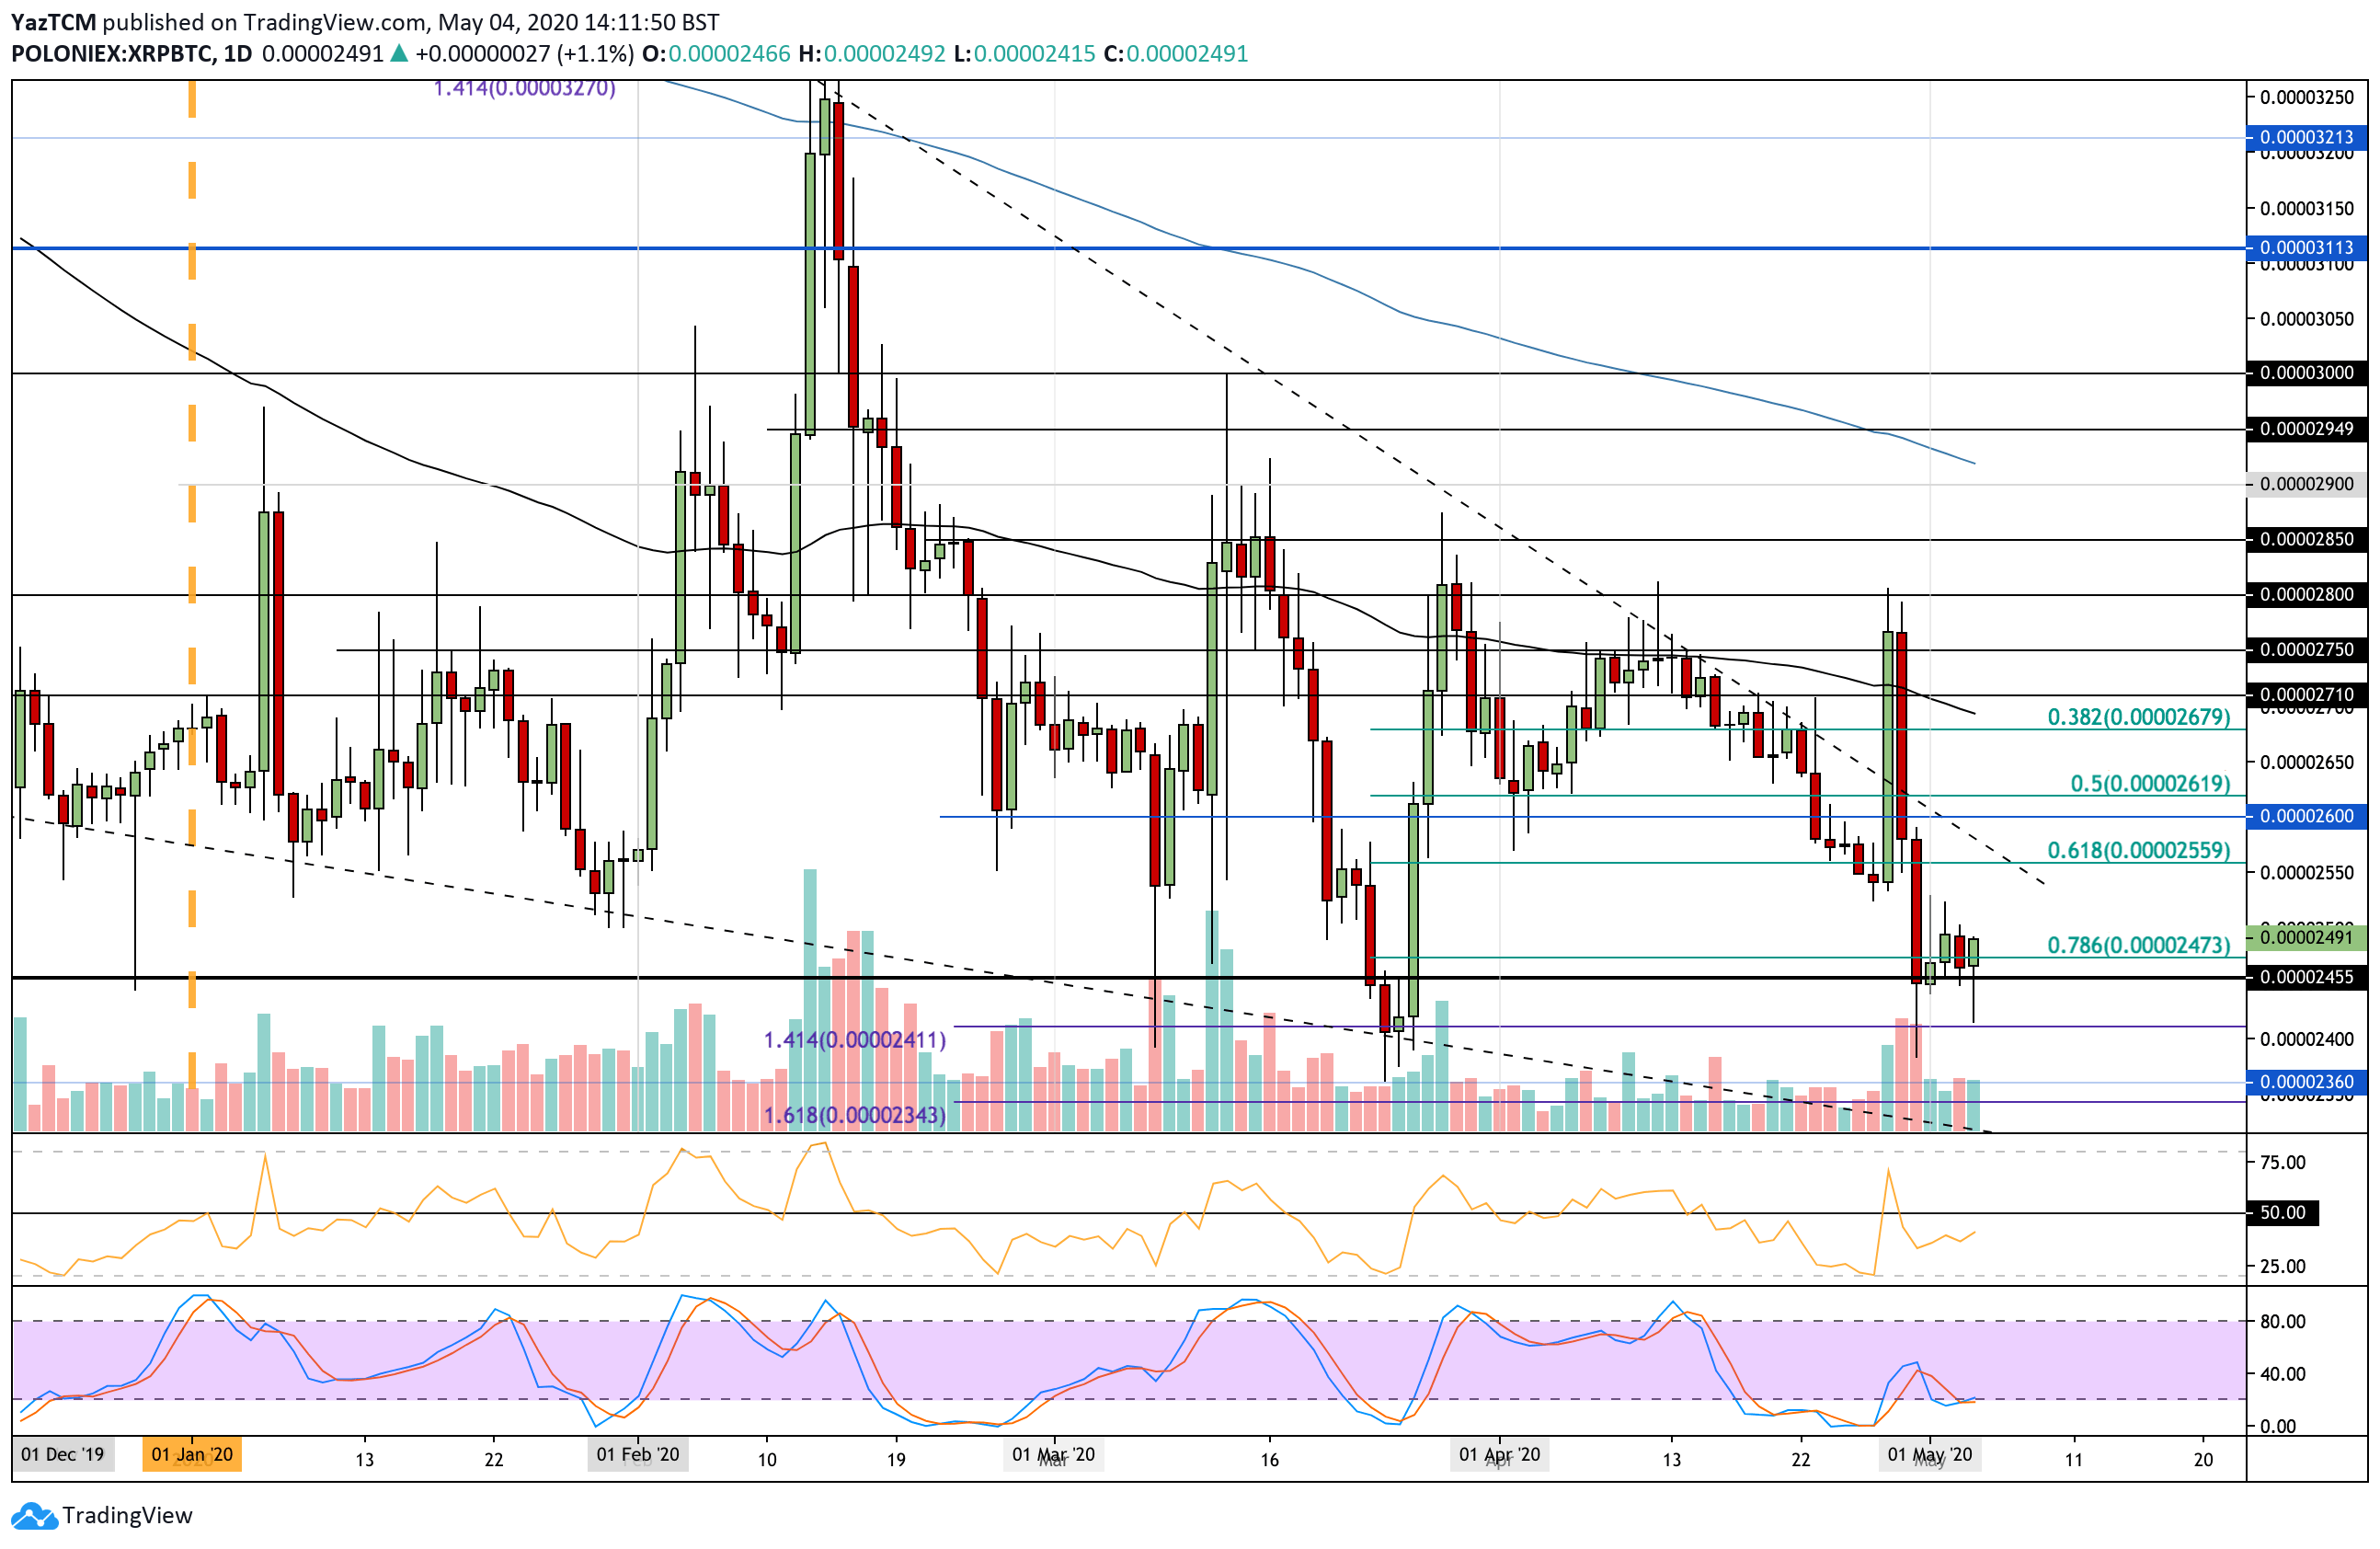
XRP/BTC – Ripple Struggle Continues Against BTC
Against Bitcoin, XRP has been struggling heavily throughout April and early May. The cryptocurrency was trending lower all through April but saw a sudden surge higher toward the end of the month as it reached 2800 SAT. However, the bears quickly re-entered the market and pushed XRP down to create a fresh April low at around 2400 SAT.
The coin dropped as low as 2400 SAT today but the buyers managed to step back in and push it higher toward 2500 SAT.
XRP-BTC Short Term Price Prediction
If the buyers continue to drive XRP above 2500 SAT, resistance is located at 2560 SAT, 2600 SAT, 2620 SAT, and 2650 SAT.
On the other side, if the sellers push lower, support lies at 2455 SAT, 2400 SAT, and 2360 SAT.
The RSI is beneath 50 but is rising to show that the bearish momentum is fading. For recovery, the RSI must rise above 50 to show that the buyers are in control of the momentum. Additionally, the Stochastic RSI is primed for a bullish crossover signal which will be the first sign that the bullish pressure is mounting.