XRP climbed by 3% over the past 24 hours of trading. However, it is still struggling to break resistance at %excerpt%.337.Against Bitcoin, XRP remains above the 200-day EMA but has run into resistance at 3270 SAT.The cryptocurrency has strongly outperformed Bitcoin this week with a 21% price surge relative to Bitcoin’s 4.5% increase.Key Support & Resistance LevelsXRP/USD:Support:%excerpt%.32, %excerpt%.317, and %excerpt%.31.Resistance: %excerpt%.35, %excerpt%.361, and %excerpt%.379.XRP/BTC:Support: 3230 SAT, 3115 SAT, and 3000 SAT.Resistance: 3325 SAT, 3375 SAT, and 3500 SAT.XRP/USD – Continues To Struggle At %excerpt%.337Since our last analysis, XRP attempted to break above resistance at %excerpt%.337 but continues to fail on each attempt.It did spike as high as %excerpt%.35, but the bears quickly brought the price back beneath the aforementioned
Topics:
Yaz Sheikh considers the following as important: Ripple (XRP) Price, XRP Analysis
This could be interesting, too:
Jordan Lyanchev writes Ripple’s (XRP) Surge to Triggers Over Million in Short Liquidations
Jordan Lyanchev writes Trump Confirms Work on Strategic Crypto Reserve: XRP, ADA, SOL Included
Mandy Williams writes Ripple Releases Institutional DeFi Roadmap for XRP Ledger in 2025
Jordan Lyanchev writes ChatGPT and DeepSeek Analyze Ripple’s (XRP) Price Potential for 2025
- XRP climbed by 3% over the past 24 hours of trading. However, it is still struggling to break resistance at $0.337.
- Against Bitcoin, XRP remains above the 200-day EMA but has run into resistance at 3270 SAT.
- The cryptocurrency has strongly outperformed Bitcoin this week with a 21% price surge relative to Bitcoin’s 4.5% increase.
Key Support & Resistance Levels
XRP/USD:
Support:$0.32, $0.317, and $0.31.
Resistance: $0.35, $0.361, and $0.379.
XRP/BTC:
Support: 3230 SAT, 3115 SAT, and 3000 SAT.
Resistance: 3325 SAT, 3375 SAT, and 3500 SAT.
XRP/USD – Continues To Struggle At $0.337
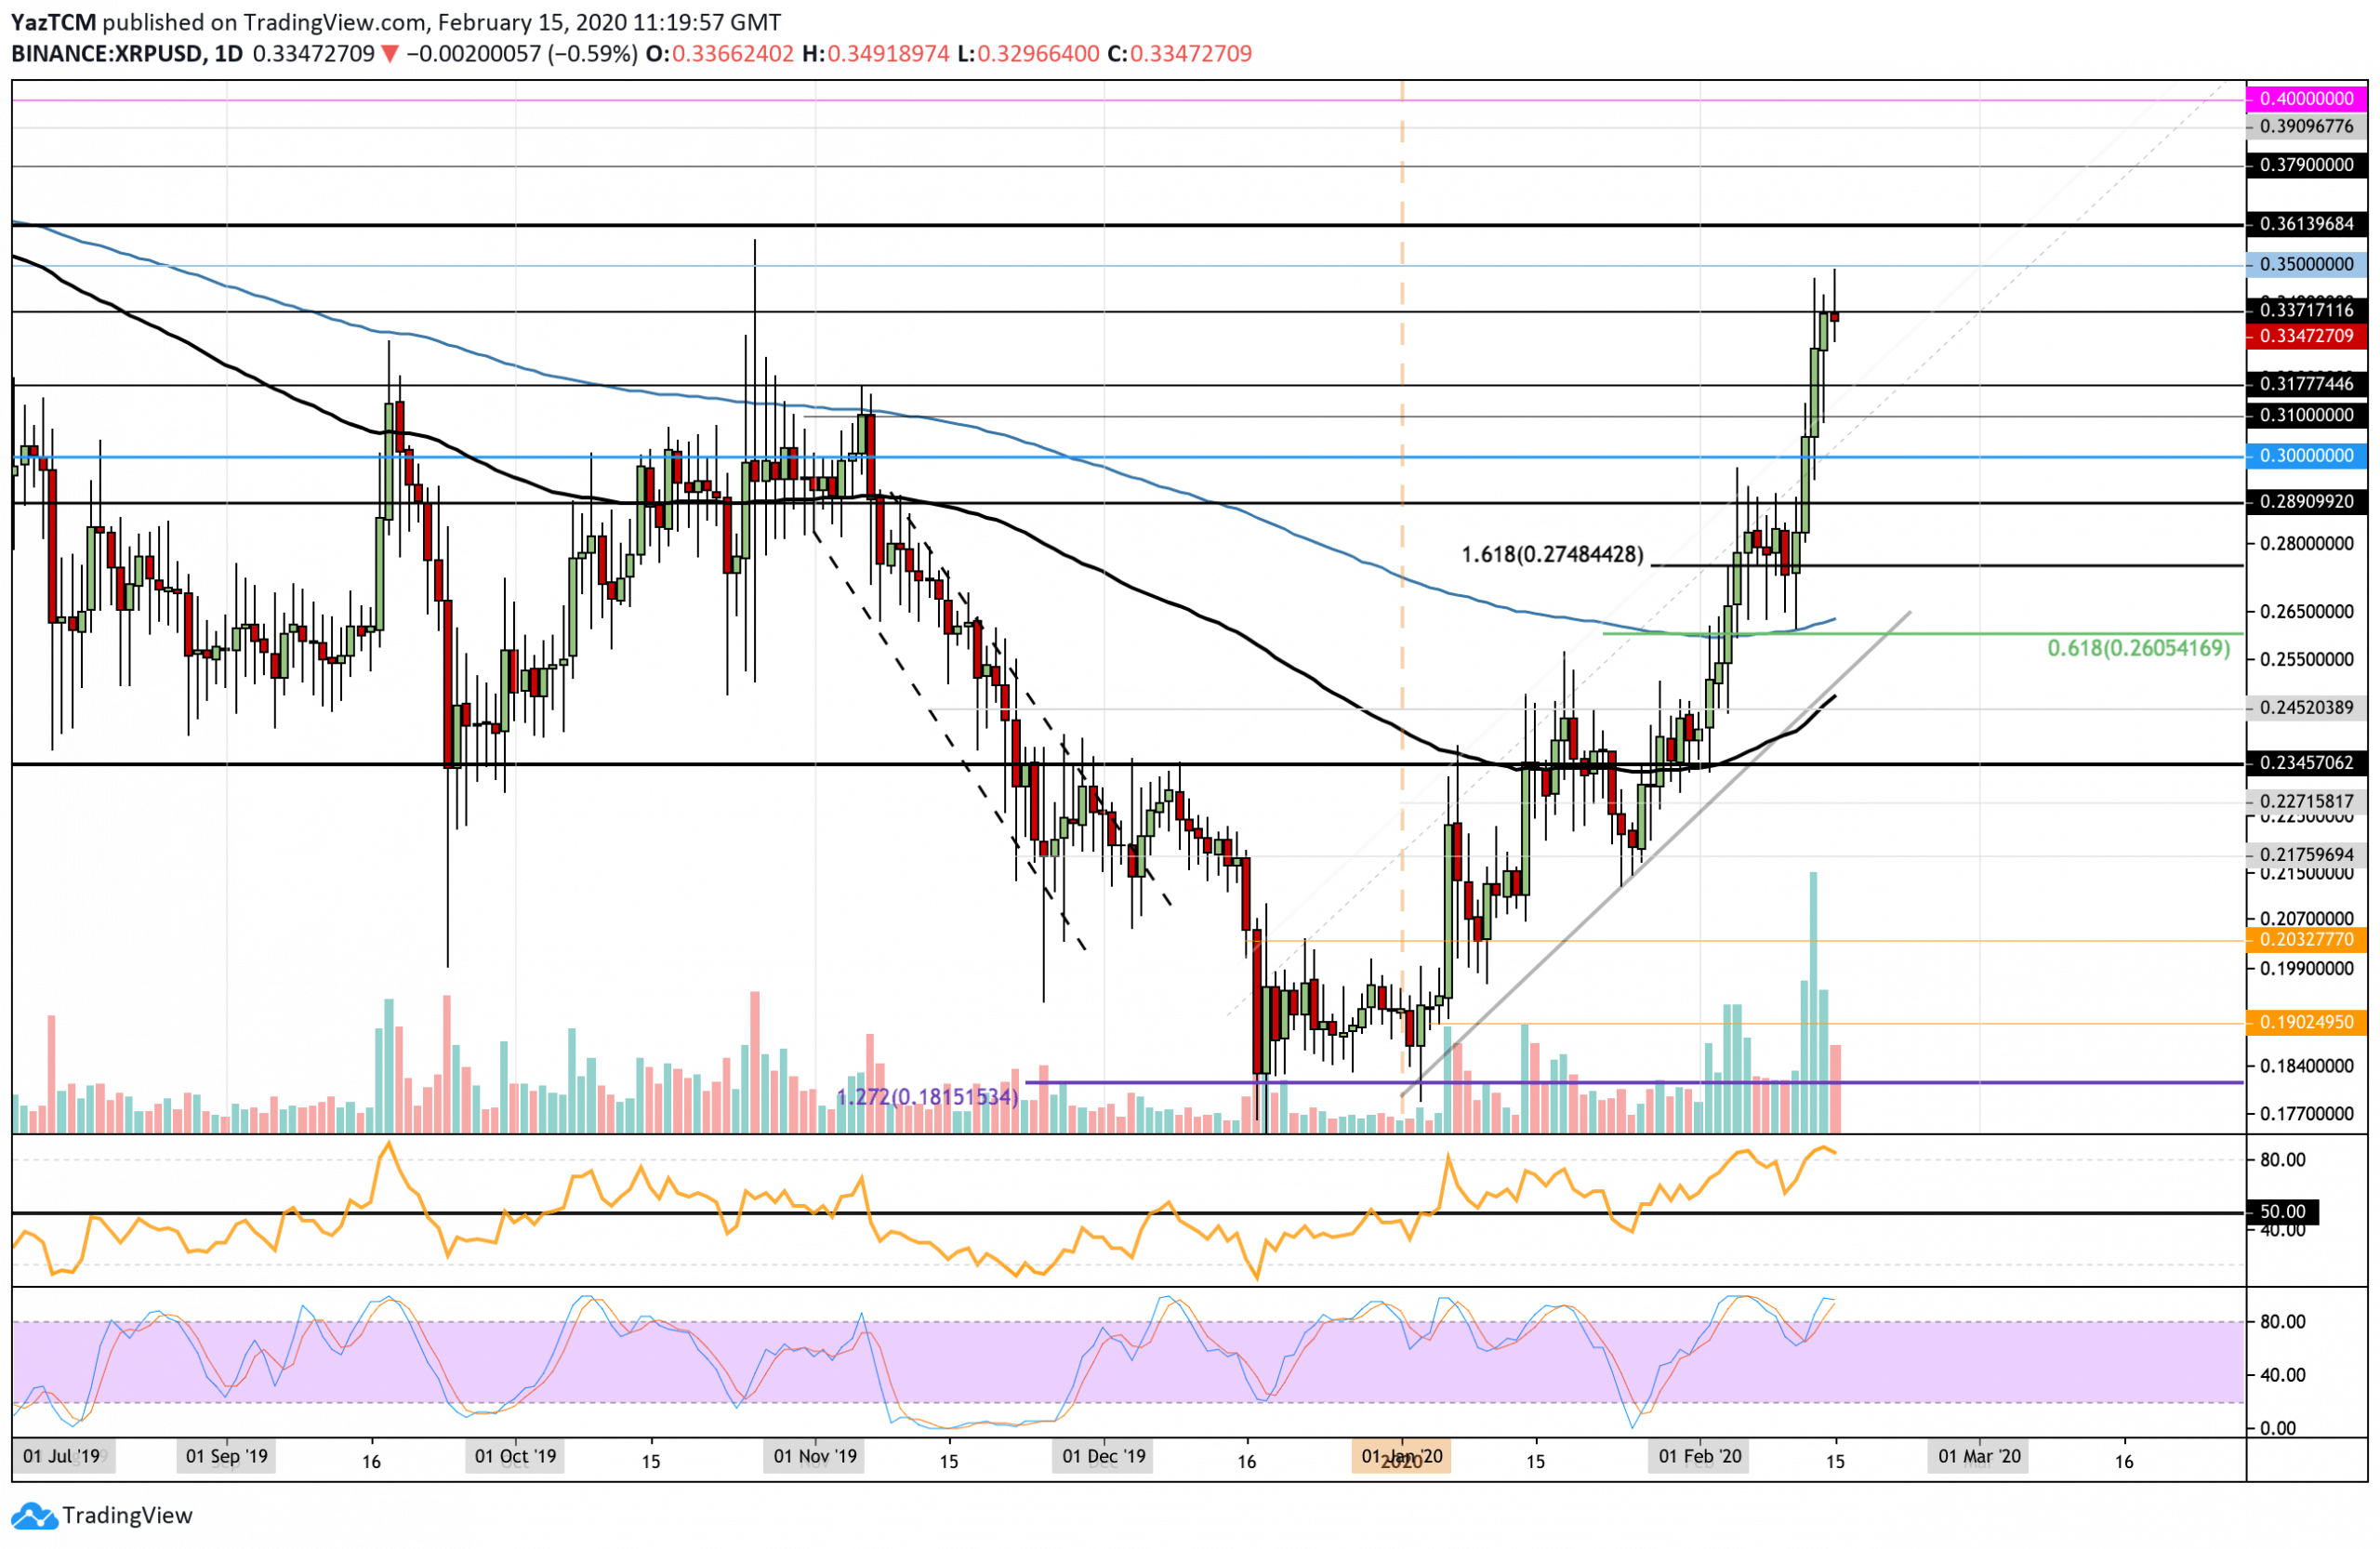
Since our last analysis, XRP attempted to break above resistance at $0.337 but continues to fail on each attempt.
It did spike as high as $0.35, but the bears quickly brought the price back beneath the aforementioned resistance.
XRP had broken above the pivotal $0.30 level this week, turning the market strongly bullish. However, it must continue above $0.337 for the bull-run to continue.

XRP Short Term Price Prediction
Once the bulls manage to break $0.337, the next level of resistance lies at $0.35. Above this, resistance is expected at $0.361, $0.379, and $0.39.
On the other side, if the sellers push XRP lower, support can be found at $0.32, $0.317, and $0.31.
The RSI remains firmly within the bull’s favor as it remains in overbought conditions. Additionally, the Stochastic RSI produced a bullish crossover signal to signal that the buyers remain in control of the market momentum.
XRP/BTC – XRP Climbs Higher From 200-days EMA.
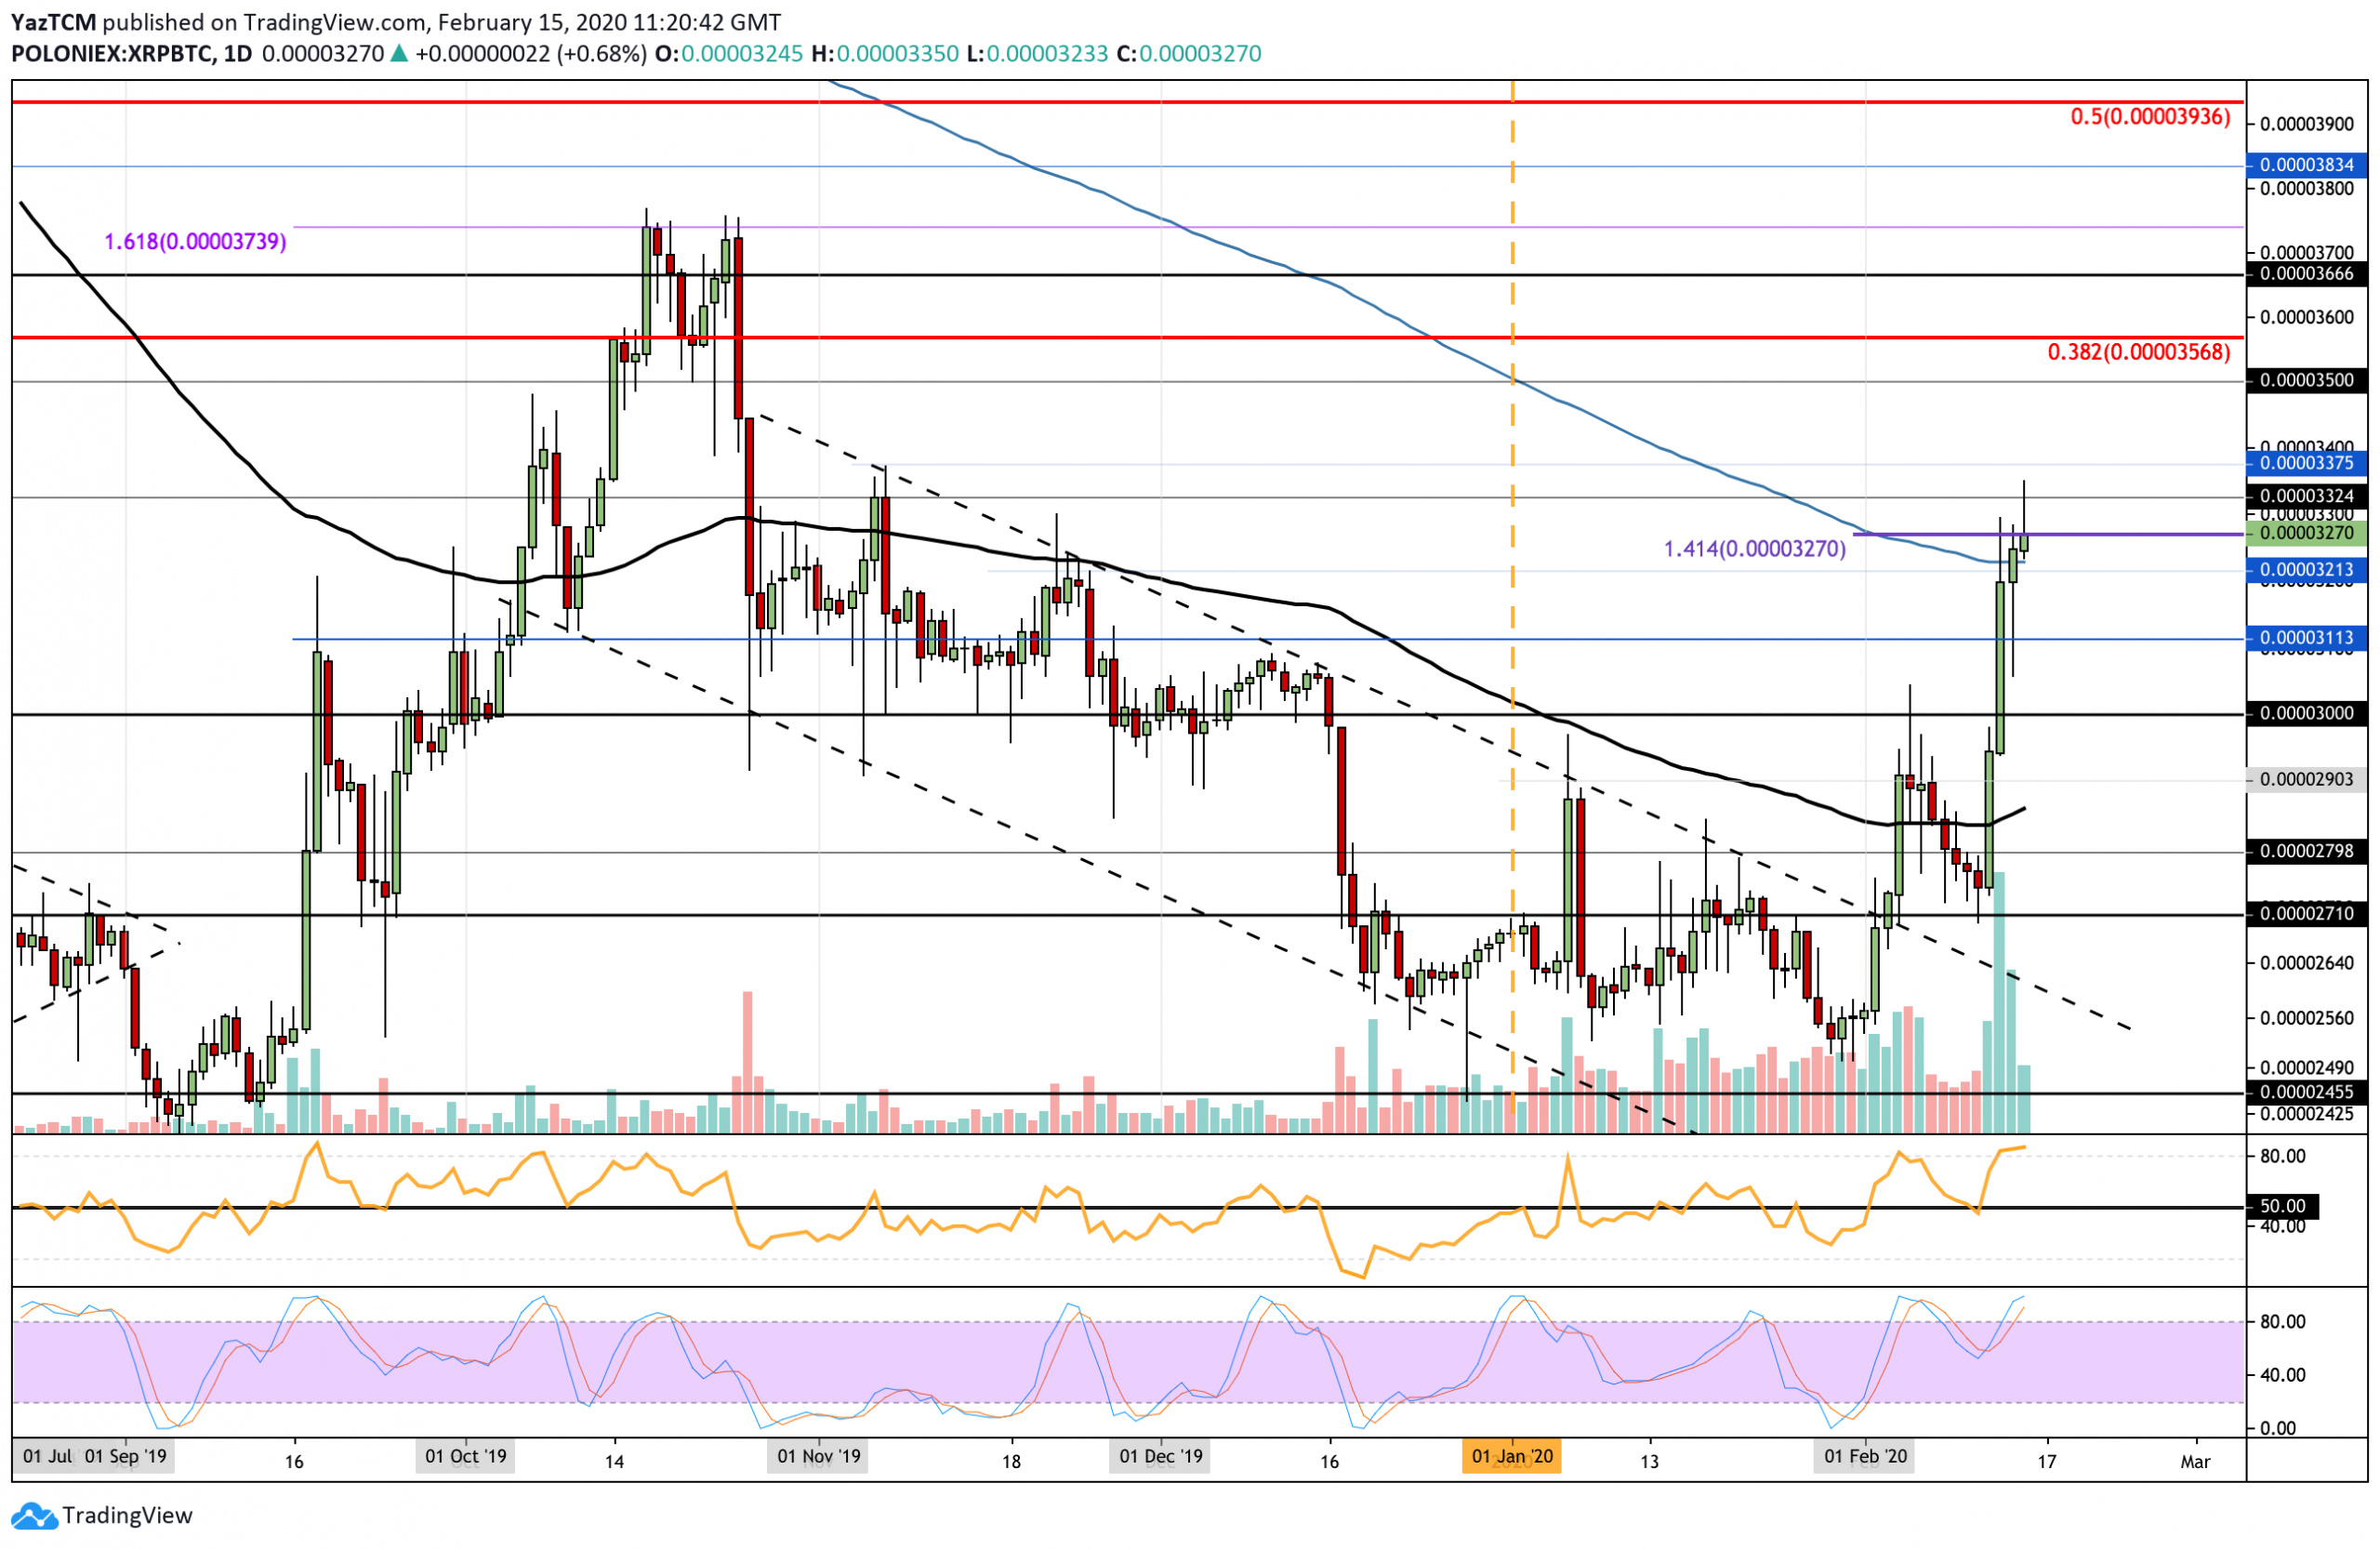
Against Bitcoin, XRP continued to climb further above the 200-days EMA, to create a high at 3250 SAT. However, it has since dropped as it continues to battle resistance at 3270, provided by a 1.414 Fib Extension.
The break above 3000 SAT and subsequent break above the 200-days EMA leaves XRP in a bullish trading condition. It would need to drop back beneath the 2900 SAT for this bullish run to be invalidated.

XRP Short Term Price Prediction
If the buyers break above 3270 SAT, resistance lies at 3325 SAT, 3375 SAT, and 3500 SAT. Beyond this, strong resistance is located at 3570 SAT (long term bearish .382 Fib Retracement).
Toward the downside, support can be found at 3230 SAT (200-days EMA), 3115 SAT, and 3000 SAT.
Similarly, the momentum indicators show the bulls are in control over the market momentum. The RSI has bounced from the 50 level to indicate the increase in the bullish momentum. Similarly, the Stochastic RSI produced a bullish crossover signal as it starts to move higher.
