XRP saw a tiny 0.6% price increase today as it continues to trade within the descending triangle pattern.The cryptocurrency has been trapped within the triangle for the past five weeks of trading.Against Bitcoin, XRP continues to struggle as it trades at the 2-year low level.Key Support & Resistance LevelsXRP/USD:Support: %excerpt%.192, %excerpt%.18, %excerpt%.175.Resistance: %excerpt%.215, %excerpt%.22, %excerpt%.225.XRP/BTC:Support: 2100 SAT, 2070 SAT, 2050 SAT.Resistance: 2200 SAT, 2300 SAT, 2360 SAT.XRP/USD: XRP Trades Sideways Through Triangle.XRP has been relatively static over the past week as it continues to trade sideways through the consolidation pattern. The coin started the month off by trying to break the triangle. However, it was unable to hold above as the sellers forced the coin back into the consolidation.It then
Topics:
Yaz Sheikh considers the following as important: Ripple (XRP) Price, XRP Analysis, xrpbtc, xrpusd
This could be interesting, too:
Dimitar Dzhondzhorov writes Is a Major Ripple v. SEC Lawsuit Development Expected This Week? Here’s Why
Mandy Williams writes Ripple Releases Institutional DeFi Roadmap for XRP Ledger in 2025
Dimitar Dzhondzhorov writes Ripple Whales Go on a Selling Spree: Is XRP Headed for a Further Correction?
Jordan Lyanchev writes ChatGPT and DeepSeek Analyze Ripple’s (XRP) Price Potential for 2025
- XRP saw a tiny 0.6% price increase today as it continues to trade within the descending triangle pattern.
- The cryptocurrency has been trapped within the triangle for the past five weeks of trading.
- Against Bitcoin, XRP continues to struggle as it trades at the 2-year low level.
Key Support & Resistance Levels
XRP/USD:
Support: $0.192, $0.18, $0.175.
Resistance: $0.215, $0.22, $0.225.
XRP/BTC:
Support: 2100 SAT, 2070 SAT, 2050 SAT.
Resistance: 2200 SAT, 2300 SAT, 2360 SAT.
XRP/USD: XRP Trades Sideways Through Triangle.
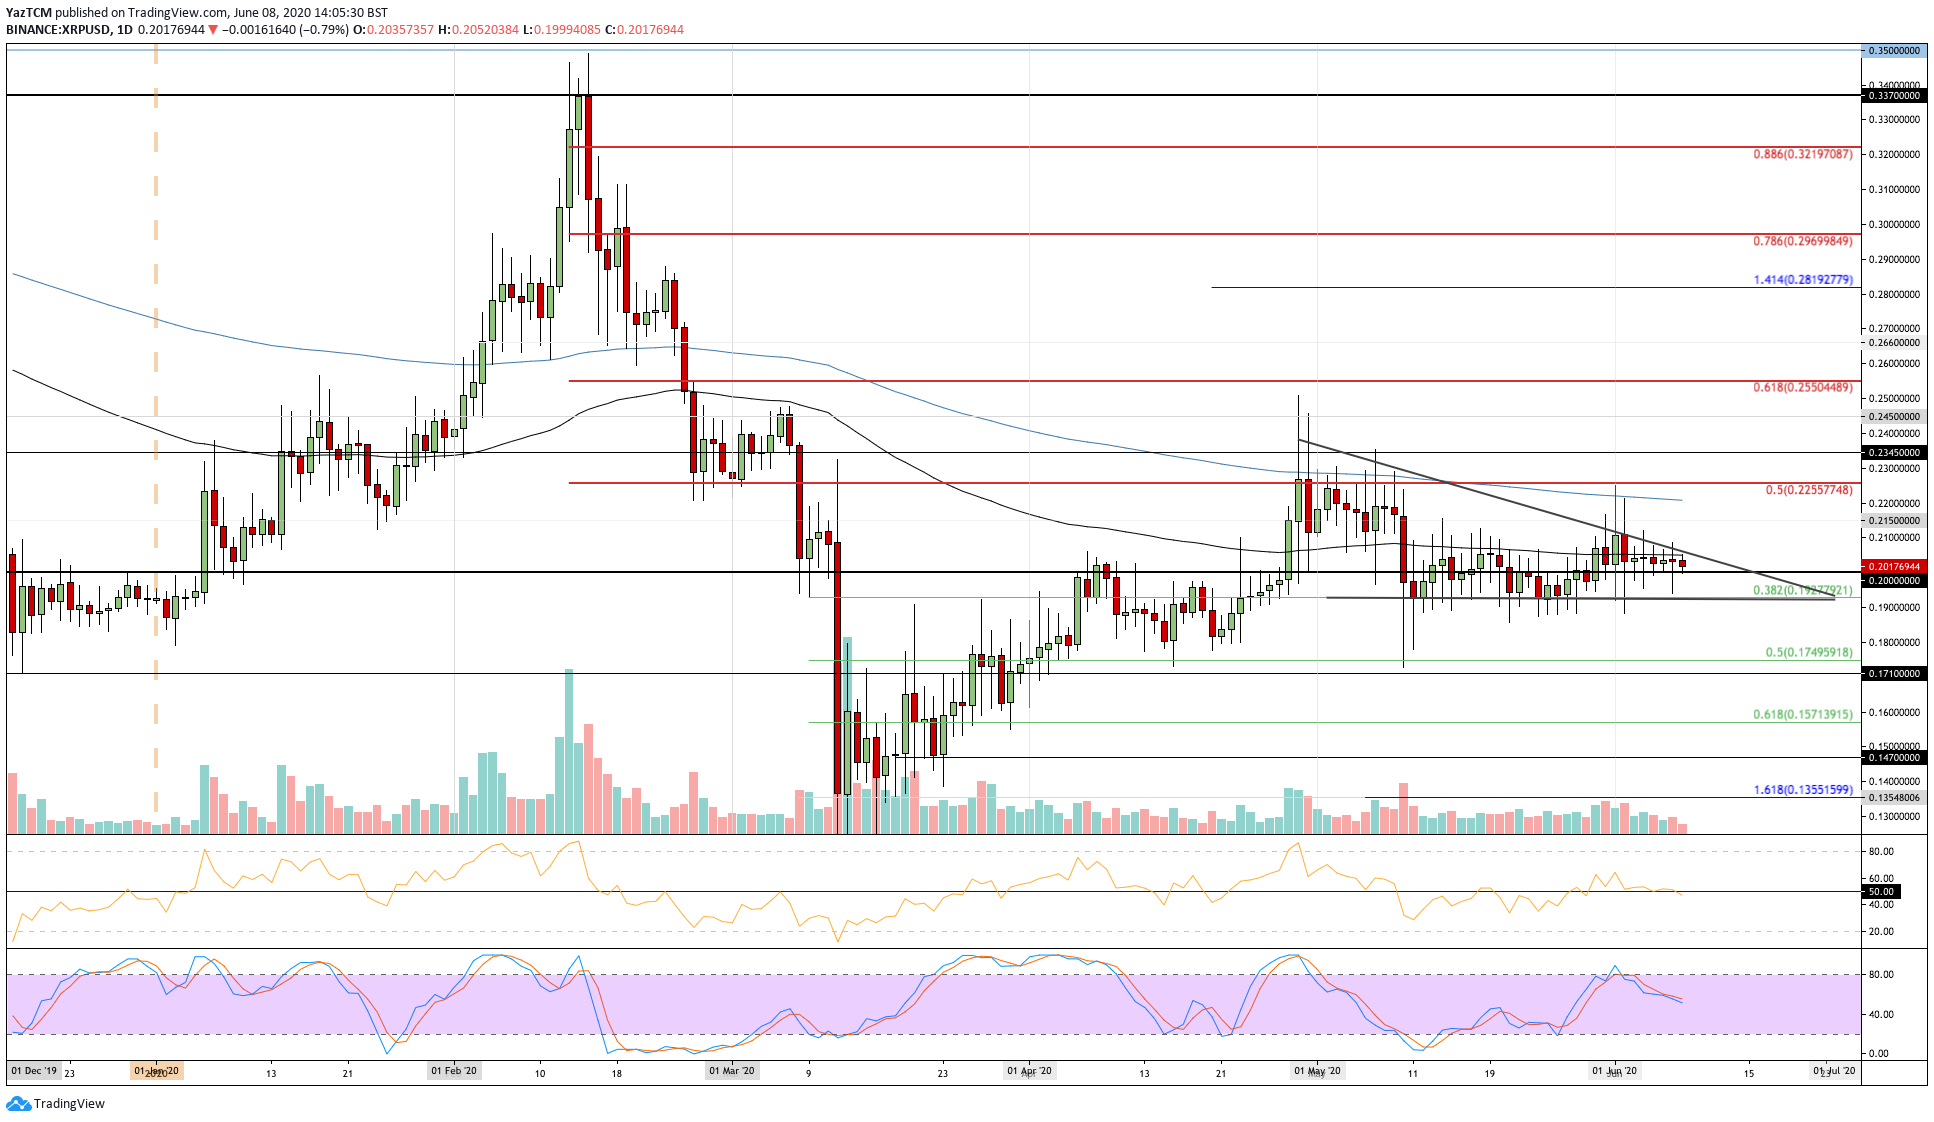
XRP has been relatively static over the past week as it continues to trade sideways through the consolidation pattern. The coin started the month off by trying to break the triangle. However, it was unable to hold above as the sellers forced the coin back into the consolidation.
It then went on to trade sideways beneath the 100-days EMA as the buyers failed to close above on each attempt. Luckily, the $0.20 level has provided strong support for the market during June 2020.

XRP-USD Short Term Price Prediction
If the buyers can break above the upper boundary of the triangle, the first level of resistance lies at $0.215. Above this, resistance can be found at $0.22 (200-day EMA), $0.225 (bearish .5 Fib Retracement), and $0.245.
On the other side, if the sellers push lower, the $0.20 level should provide strong support moving forward. Beneath this, support lies at $0.192 (.382 Fib Retracement & Triangle lower boundary), $0.18, and $0.175 (.5 Fib Retracement).
The RSI dipped beneath the 50 line recently, which indicates increasing bearish momentum. If the RSI continues beneath 50, we can expect the bearish momentum to increase and XRP to tank.
XRP/BTC: XRP Struggles Continue As Buyers Defend 2-year Lows
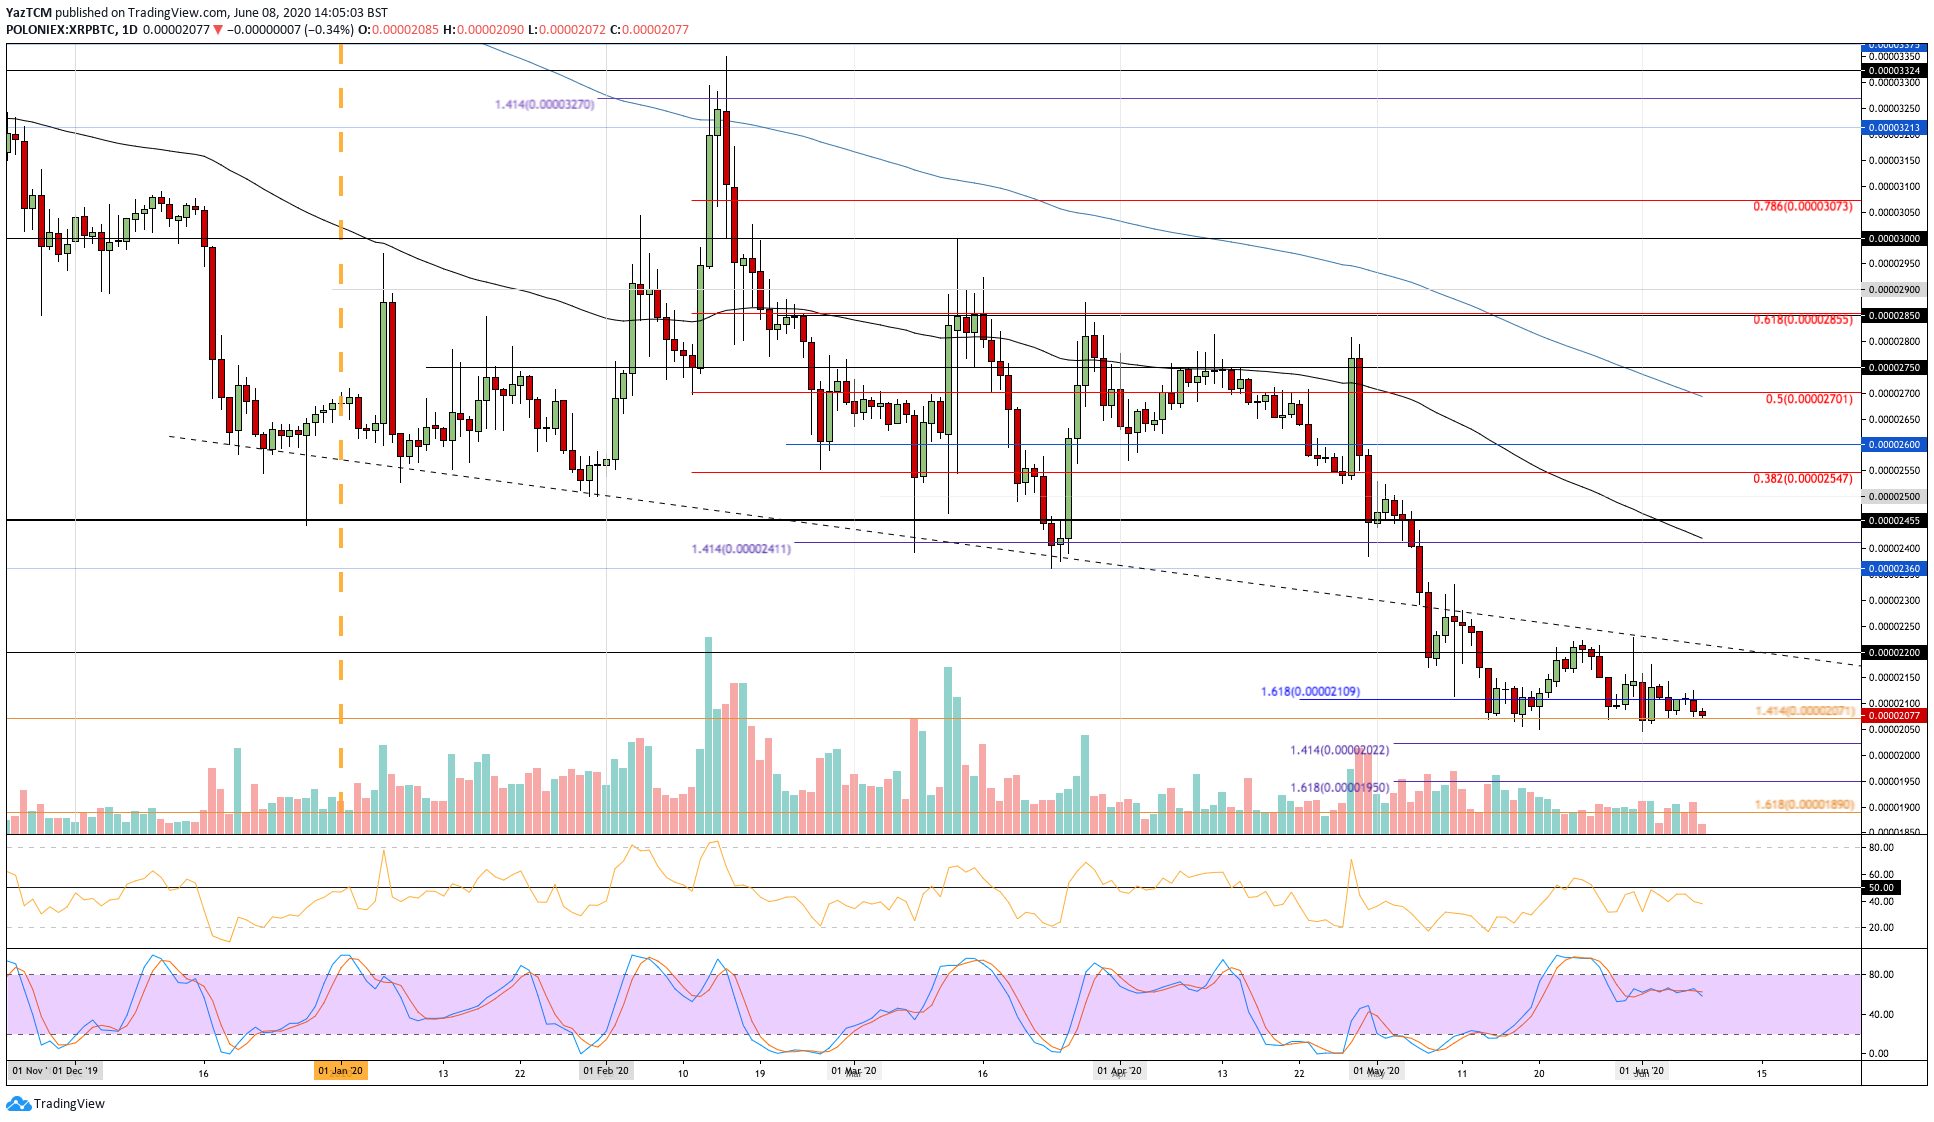
Against Bitcoin, XRP is trading at 2-year lows once again at 2071 SAT. The coin has been struggling at these lows since mid-May 2020 and any attempt to push higher results in the sellers bringing the market lower back toward 2071 SAT.
The buyers are battling aggressively to keep XRP above this support, however, if the sellers do penetrate beneath there, XRP might be headed to unwind much lower.

XRP-BTC Short Term Price Prediction
If the bears push beneath 2071 SAT, support lies at 2050 SAT, 2022 SAT, and 1950 SAT (downside 1.618 Fib Extension).
Alternatively, resistance is located at 2100 SAT, 2150 SAT, and 2200 SAT.
The RSI is beneath 50 to indicate bearish momentum within the market. If it continues lower, XRP should be expected to push beneath the 2-year price lows.
