XRP saw a 1.5% price rise over the past 24 hours as it managed to climb above the %excerpt%.20 level again.The cryptocurrency is facing resistance at the 100-days EMA now.Against Bitcoin, the XRP woes continue as it keeps trading at lows not seen since December 2017.Key Support & Resistance LevelsXRP/USD:Support: %excerpt%.20, %excerpt%.192, %excerpt%.18.Resistance: %excerpt%.208, %excerpt%.225, %excerpt%.235.XRP/BTC:Support: 2100 SAT, 2071 SAT, 2022 SAT.Resistance: 2200 SAT, 2300 SAT, 2360 SAT.XRP/USD: Ripple Facing 100-days EMA resistanceXRP found support at a short term .382 Fib Retracement at %excerpt%.192 earlier in the week and rebounded. The recovery allowed XRP to break back above the %excerpt%.20 level yesterday as the coin finally closed above it.XRP is still trading beneath the last rising support trend line as it faces the resistance at
Topics:
Yaz Sheikh considers the following as important: Ripple (XRP) Price, XRP Analysis, xrpbtc, xrpusd
This could be interesting, too:
Jordan Lyanchev writes Ripple’s (XRP) Surge to Triggers Over Million in Short Liquidations
Jordan Lyanchev writes Trump Confirms Work on Strategic Crypto Reserve: XRP, ADA, SOL Included
Dimitar Dzhondzhorov writes Is a Major Ripple v. SEC Lawsuit Development Expected This Week? Here’s Why
Mandy Williams writes Ripple Releases Institutional DeFi Roadmap for XRP Ledger in 2025
- XRP saw a 1.5% price rise over the past 24 hours as it managed to climb above the $0.20 level again.
- The cryptocurrency is facing resistance at the 100-days EMA now.
- Against Bitcoin, the XRP woes continue as it keeps trading at lows not seen since December 2017.
Key Support & Resistance Levels
XRP/USD:
Support: $0.20, $0.192, $0.18.
Resistance: $0.208, $0.225, $0.235.
XRP/BTC:
Support: 2100 SAT, 2071 SAT, 2022 SAT.
Resistance: 2200 SAT, 2300 SAT, 2360 SAT.
XRP/USD: Ripple Facing 100-days EMA resistance
XRP found support at a short term .382 Fib Retracement at $0.192 earlier in the week and rebounded. The recovery allowed XRP to break back above the $0.20 level yesterday as the coin finally closed above it.
XRP is still trading beneath the last rising support trend line as it faces the resistance at the 100-days EMA at around $0.208. A break above the 100-days EMA would allow XRP to make its way to the previous resistance at the 200-days EMA.
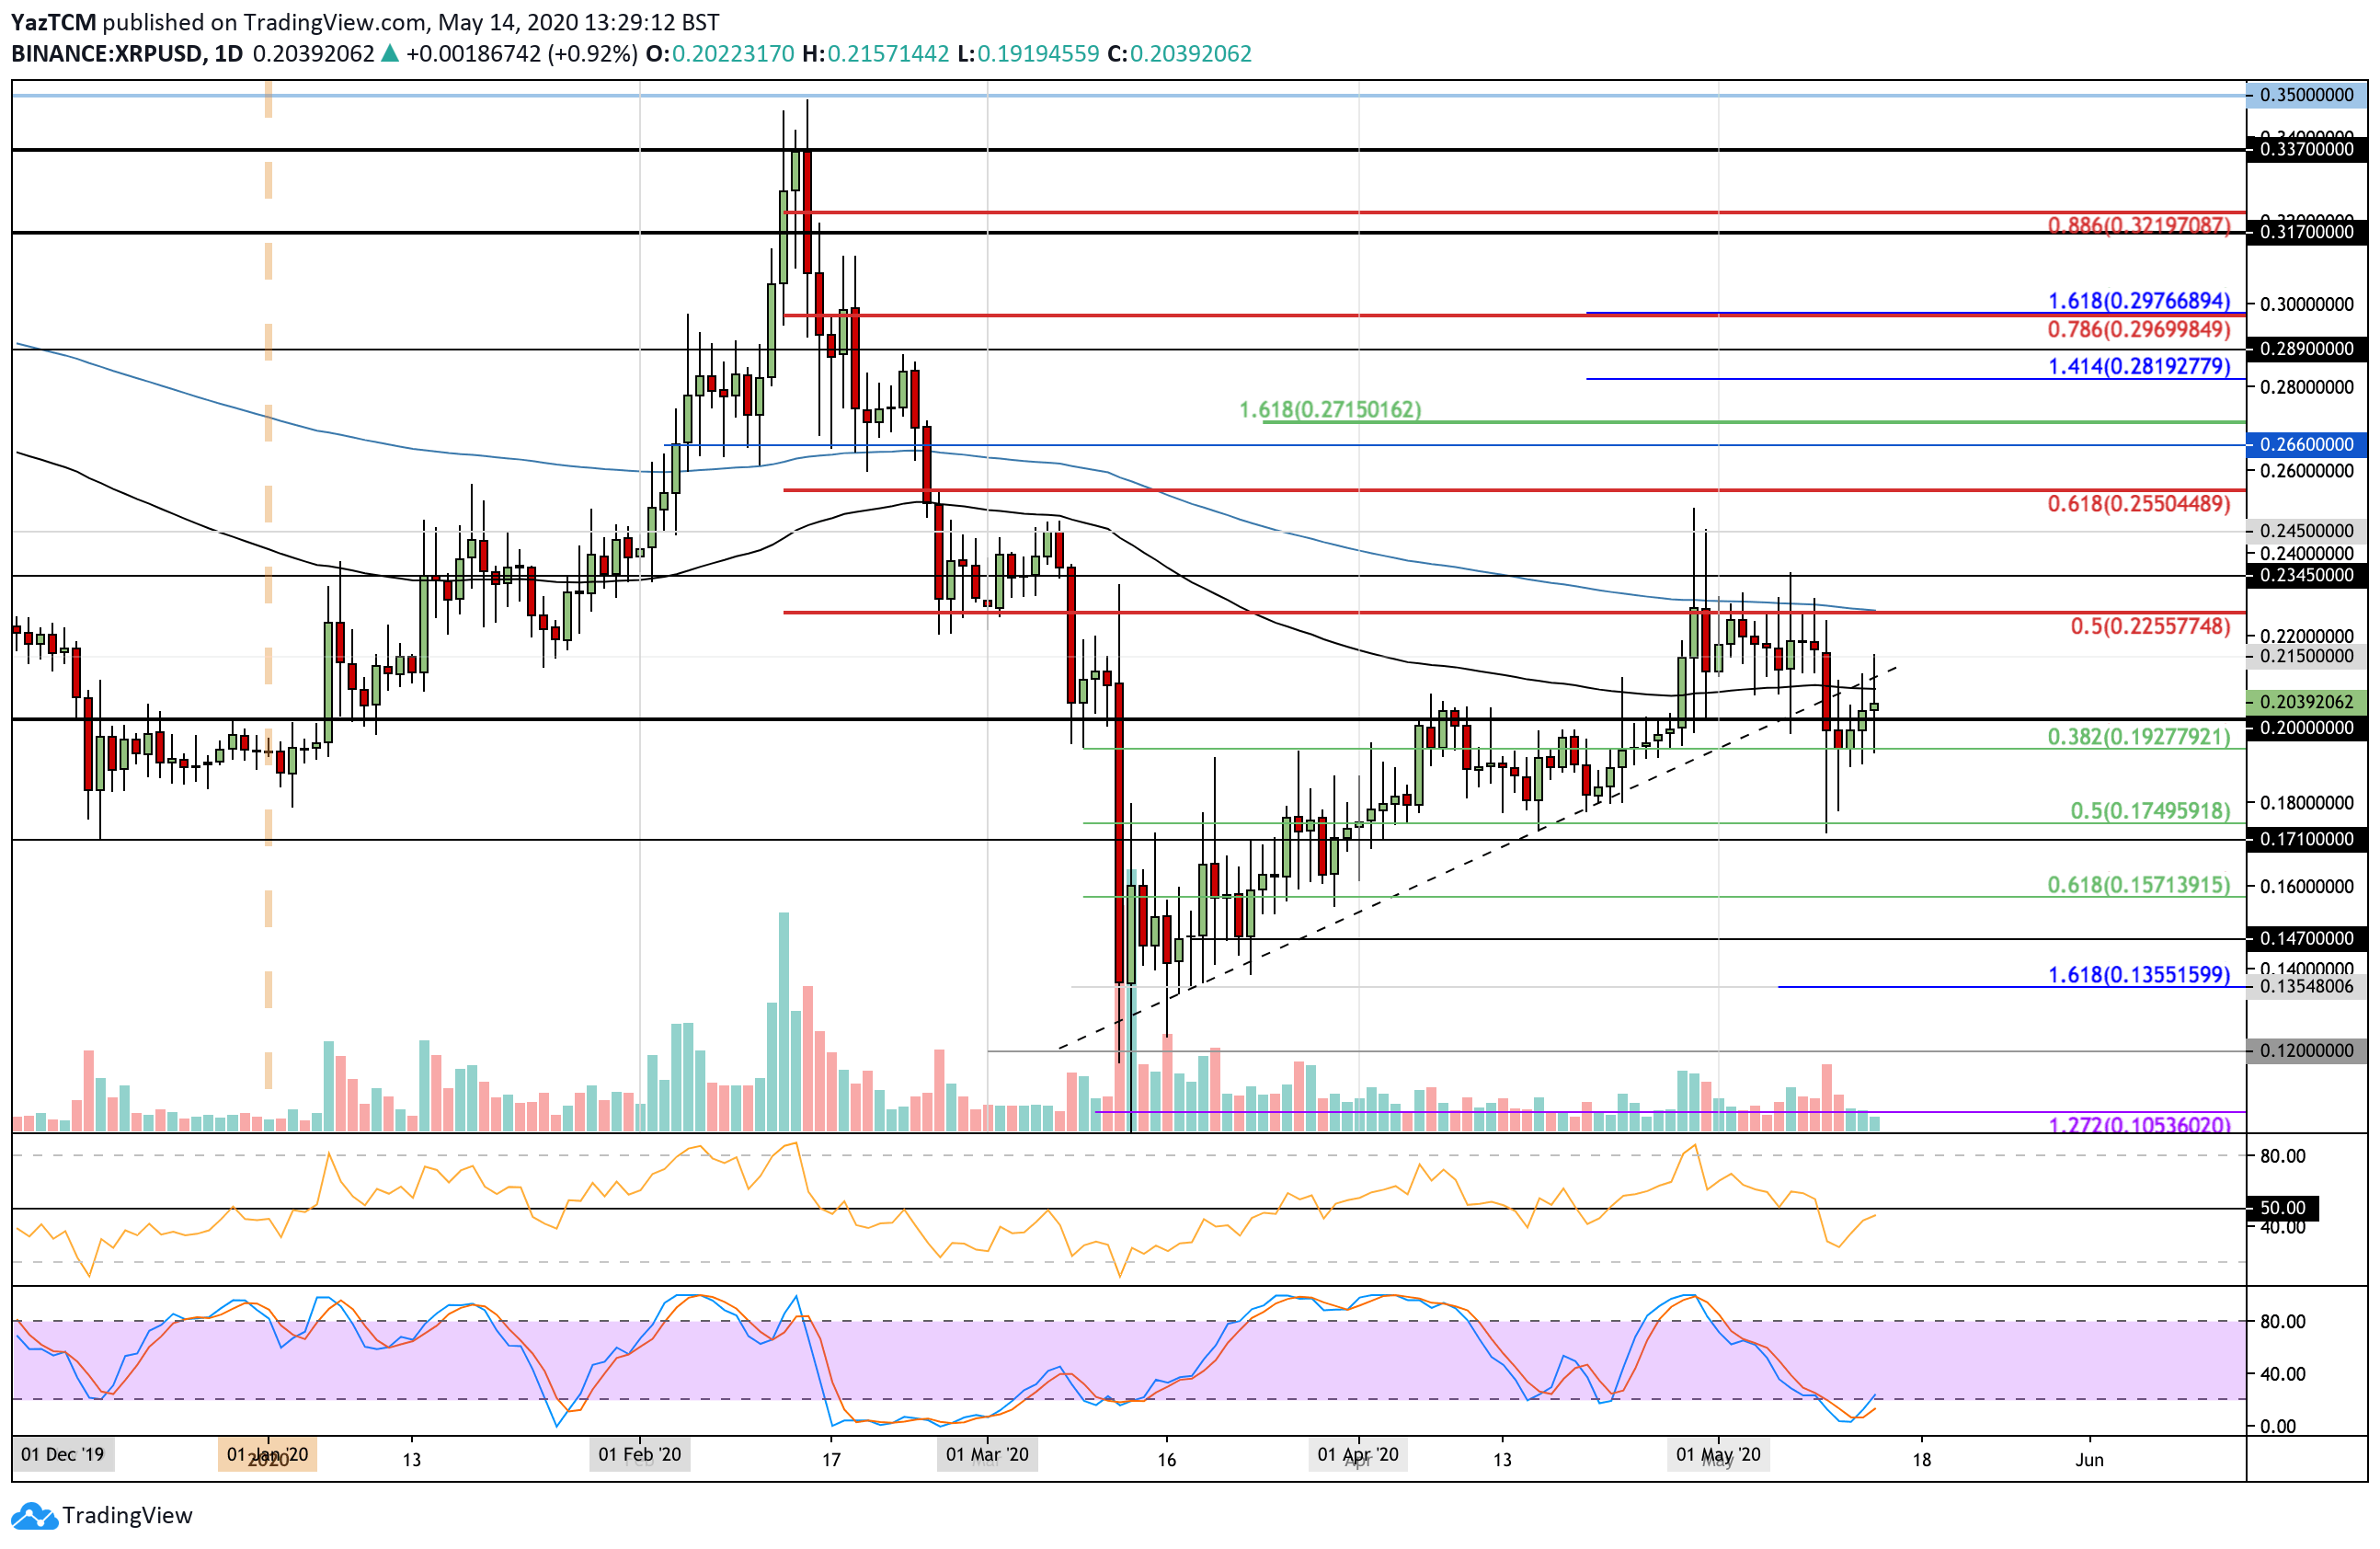
XRP/USD Short Term Price Prediction
Once the buyers break the 100-days EMA, the next level of resistance lies at $0.225, where the bearish .5 Fib Retracement and the 200-days EMA are found. XRP was unable to break above both of these resistance levels during April and May. Above this, resistance lies at $0.234, $0.245, and $0.255 (bearish .618 Fib Retracement).
On the other side, the first level of support lies at $0.20. Beneath this, support is located at $0.192 (.382 Fib Retracement), $0.18, $0.175 (.5 Fib Retracement), and $0.17.
The RSI has reached the 50 line, which indicates indecision within the market. For XRP to continue above the 100-days EMA, the RSI must break the 50 line to show the bulls control the market momentum. The Stochastic RSI is primed for a bullish crossover signal that should help push the market upward.
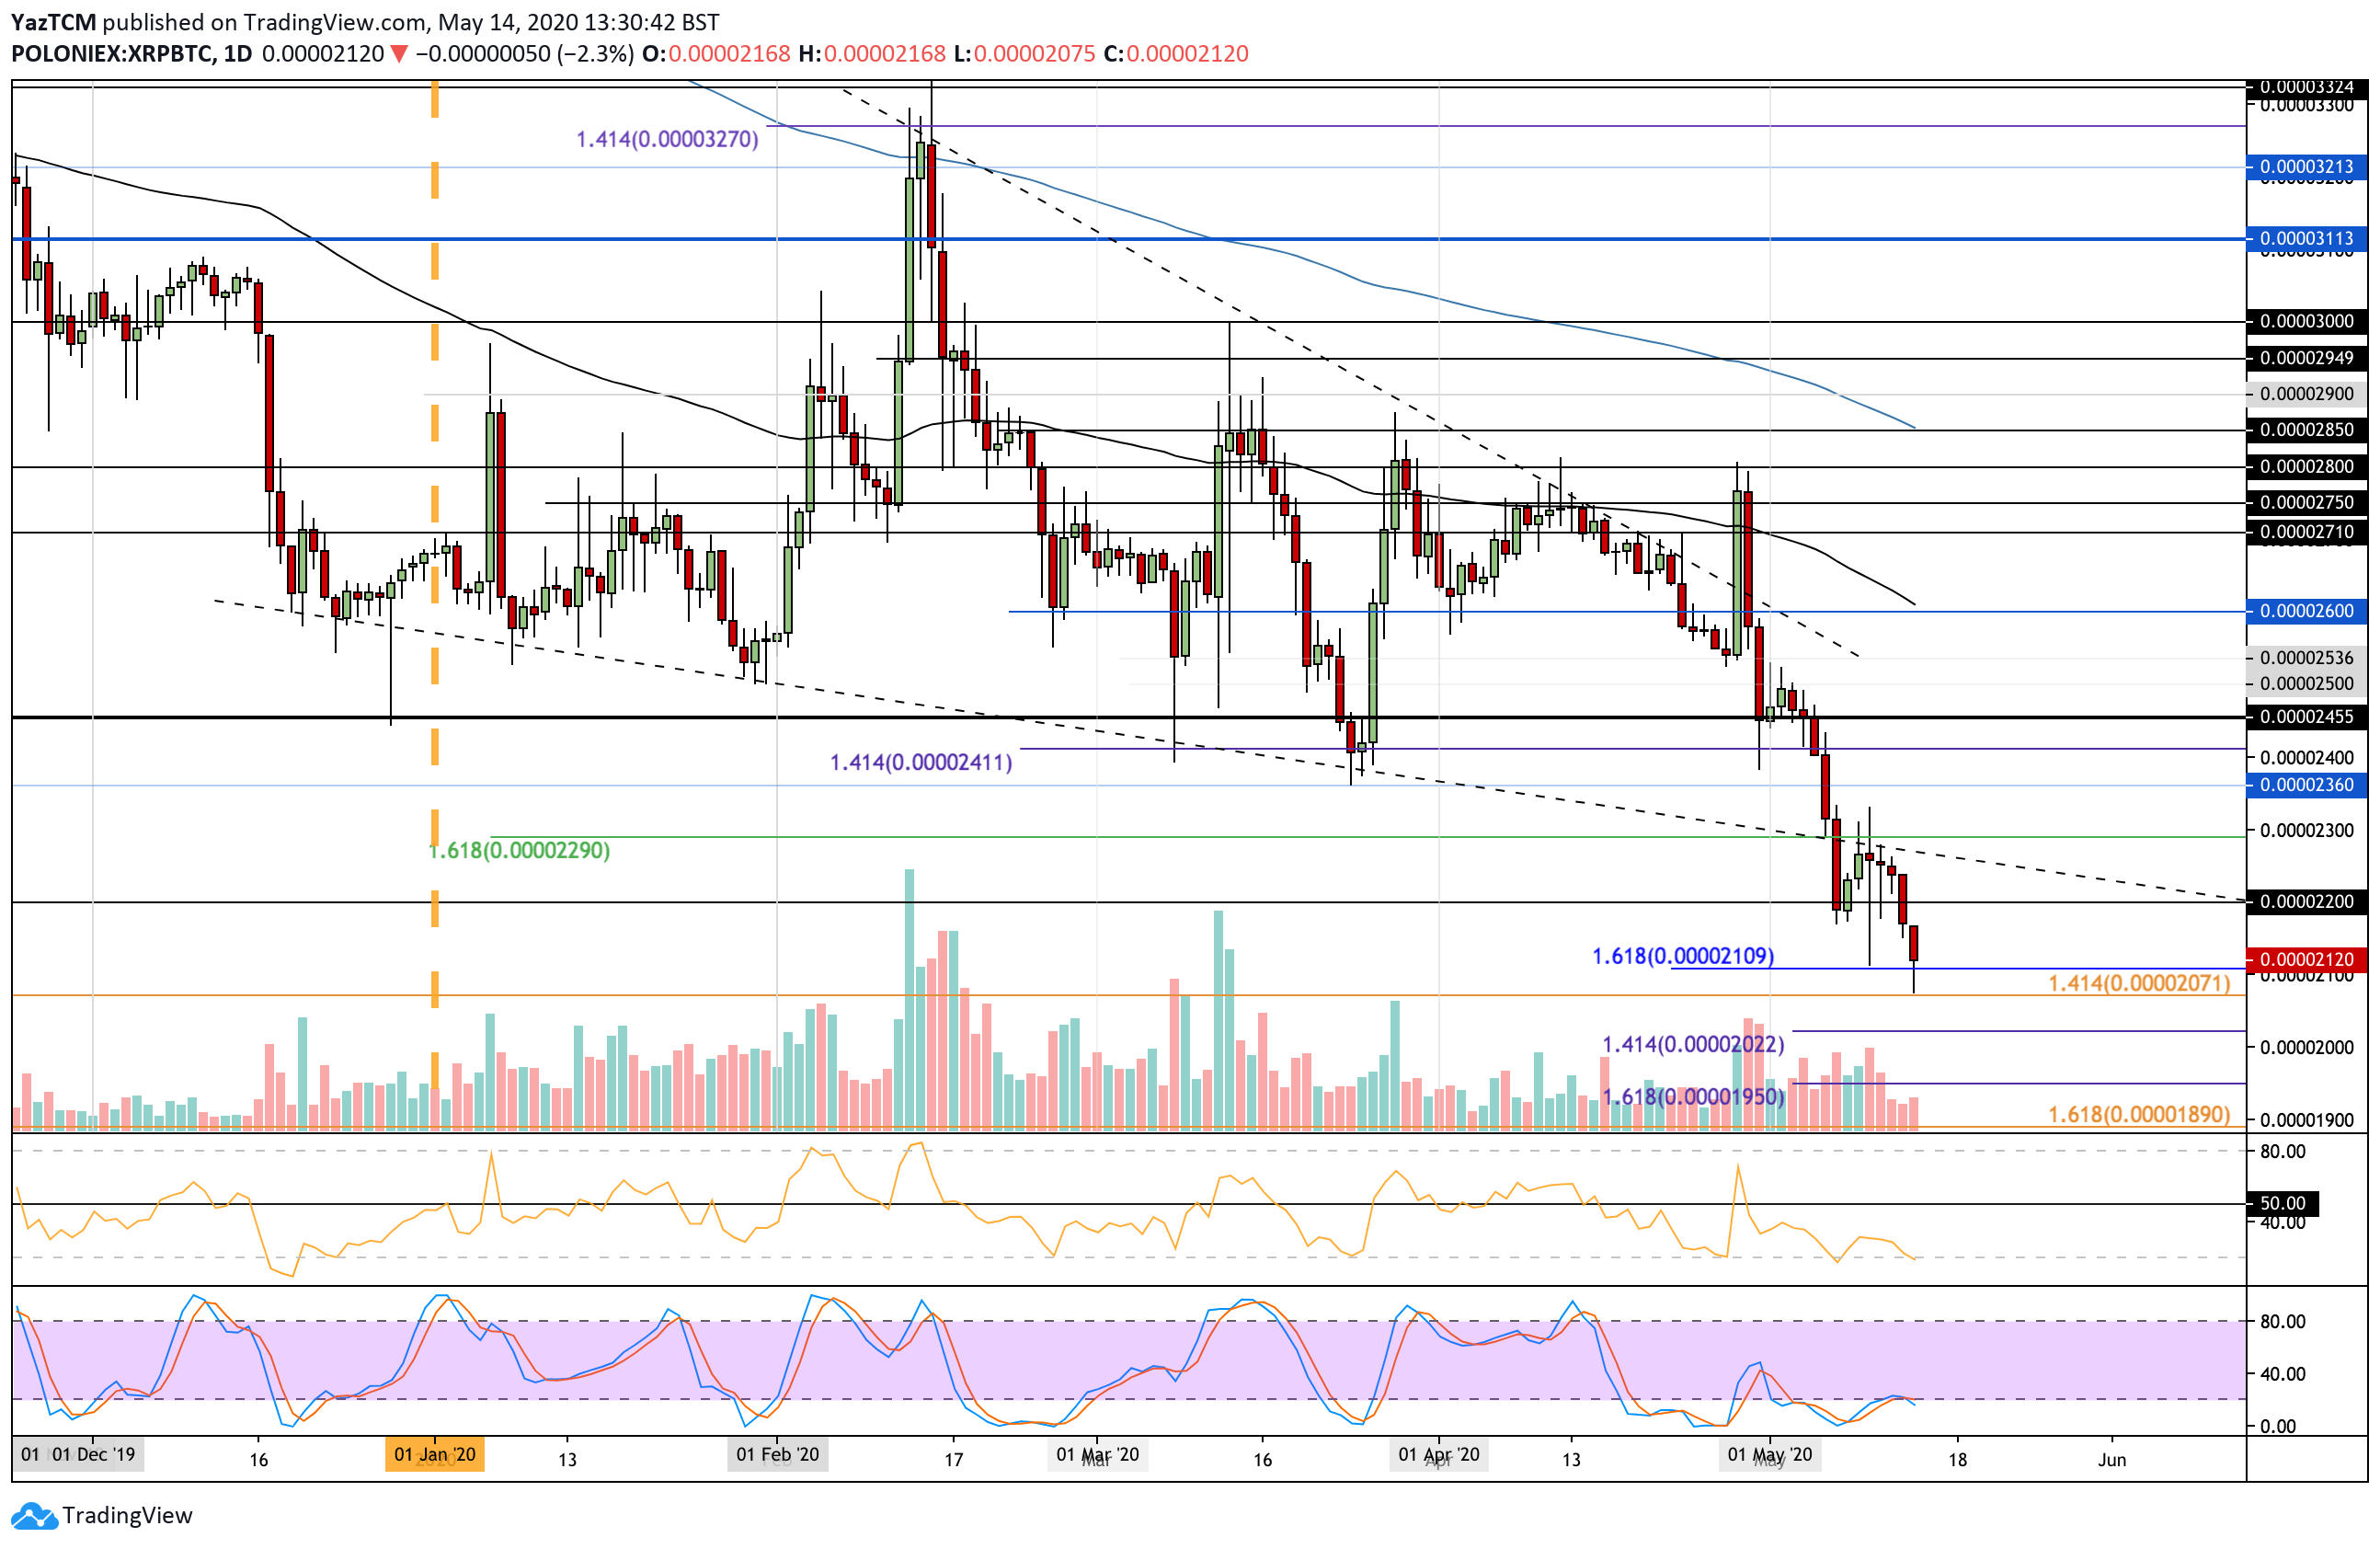
XRP/BTC: Ripple Continues To Trade At 2-Year Lows.
The struggle continues for XRP against BTC as the coin falls further beneath the 2200 SAT level as it reaches as low as 2071 SAT. It has bounced from 2071 SAT as it trades above 2100 SAT right now.
Nevertheless, the situation is pretty dire for XRP right now, and a drop beneath 2000 SAT could be disastrous for XRP’s chance to push back above the 200-days EMA and turn bullish against the USD.
The following weekly chart of XRP trading against Bitcoin provides an even better visual representation of the struggle it’s been having for a long time now.

XRP-BTC Short Term Price Prediction
If the sellers break beneath 2100 SAT, the first level of support lies at 2071 SAT (long term downside 1.414 Fib Extension). Beneath this, support is at 2022 SAT (downside 1.414 Fib Extension), 2000 SAT, and 1950 SAT (downside 1.618 Fib Extension).
On the other side, the first level of resistance lies at 2200 SAT. Above this, resistance is found at 2300 SAT, 2360 SAT, and 2400 SAT.
The RSI continues to trade at oversold conditions and must start to rise higher for a sign that the selling momentum is beginning to fade.