XRP saw a small 0.4% price hike over the past 24 hours as it continues to edge its way toward %excerpt%.20.The coin rebounded from support at %excerpt%.18 last week as it bounced from a rising trend line.Against Bitcoin, XRP has been falling throughout April and recently dropped into the 2550 SAT level.Key Support & Resistance LevelsXRP/USD:Support: %excerpt%.191, %excerpt%.18, %excerpt%.171.Resistance: %excerpt%.2, %excerpt%.206, %excerpt%.218.XRP/BTC:Support: 2550 SAT, 2510 SAT, 2500 SAT.Resistance: 2600 SAT, 2650 SAT, 2710 SAT.XRP/USD: Ripple Continues Struggle To Break %excerpt%.20.XRP has been slowly grinding higher over the past week of trading after rebounding from the support at the rising trend line. It is increasing very slowly as it continues to struggle to make any movement above the %excerpt%.2 level.XRP has been trading above the rising support
Topics:
Yaz Sheikh considers the following as important: Ripple (XRP) Price, XRP Analysis, xrpbtc, xrpusd
This could be interesting, too:
Jordan Lyanchev writes Ripple’s (XRP) Surge to Triggers Over Million in Short Liquidations
Jordan Lyanchev writes Trump Confirms Work on Strategic Crypto Reserve: XRP, ADA, SOL Included
Dimitar Dzhondzhorov writes Is a Major Ripple v. SEC Lawsuit Development Expected This Week? Here’s Why
Mandy Williams writes Ripple Releases Institutional DeFi Roadmap for XRP Ledger in 2025
- XRP saw a small 0.4% price hike over the past 24 hours as it continues to edge its way toward $0.20.
- The coin rebounded from support at $0.18 last week as it bounced from a rising trend line.
- Against Bitcoin, XRP has been falling throughout April and recently dropped into the 2550 SAT level.
Key Support & Resistance Levels
XRP/USD:
Support: $0.191, $0.18, $0.171.
Resistance: $0.2, $0.206, $0.218.
XRP/BTC:
Support: 2550 SAT, 2510 SAT, 2500 SAT.
Resistance: 2600 SAT, 2650 SAT, 2710 SAT.
XRP/USD: Ripple Continues Struggle To Break $0.20.
XRP has been slowly grinding higher over the past week of trading after rebounding from the support at the rising trend line. It is increasing very slowly as it continues to struggle to make any movement above the $0.2 level.
XRP has been trading above the rising support line for the past eight weeks now but continues to fail when it tries to break $0.2. Once $0.2 is cleared, XRP should be free to start the makings of a strong bullish press higher.
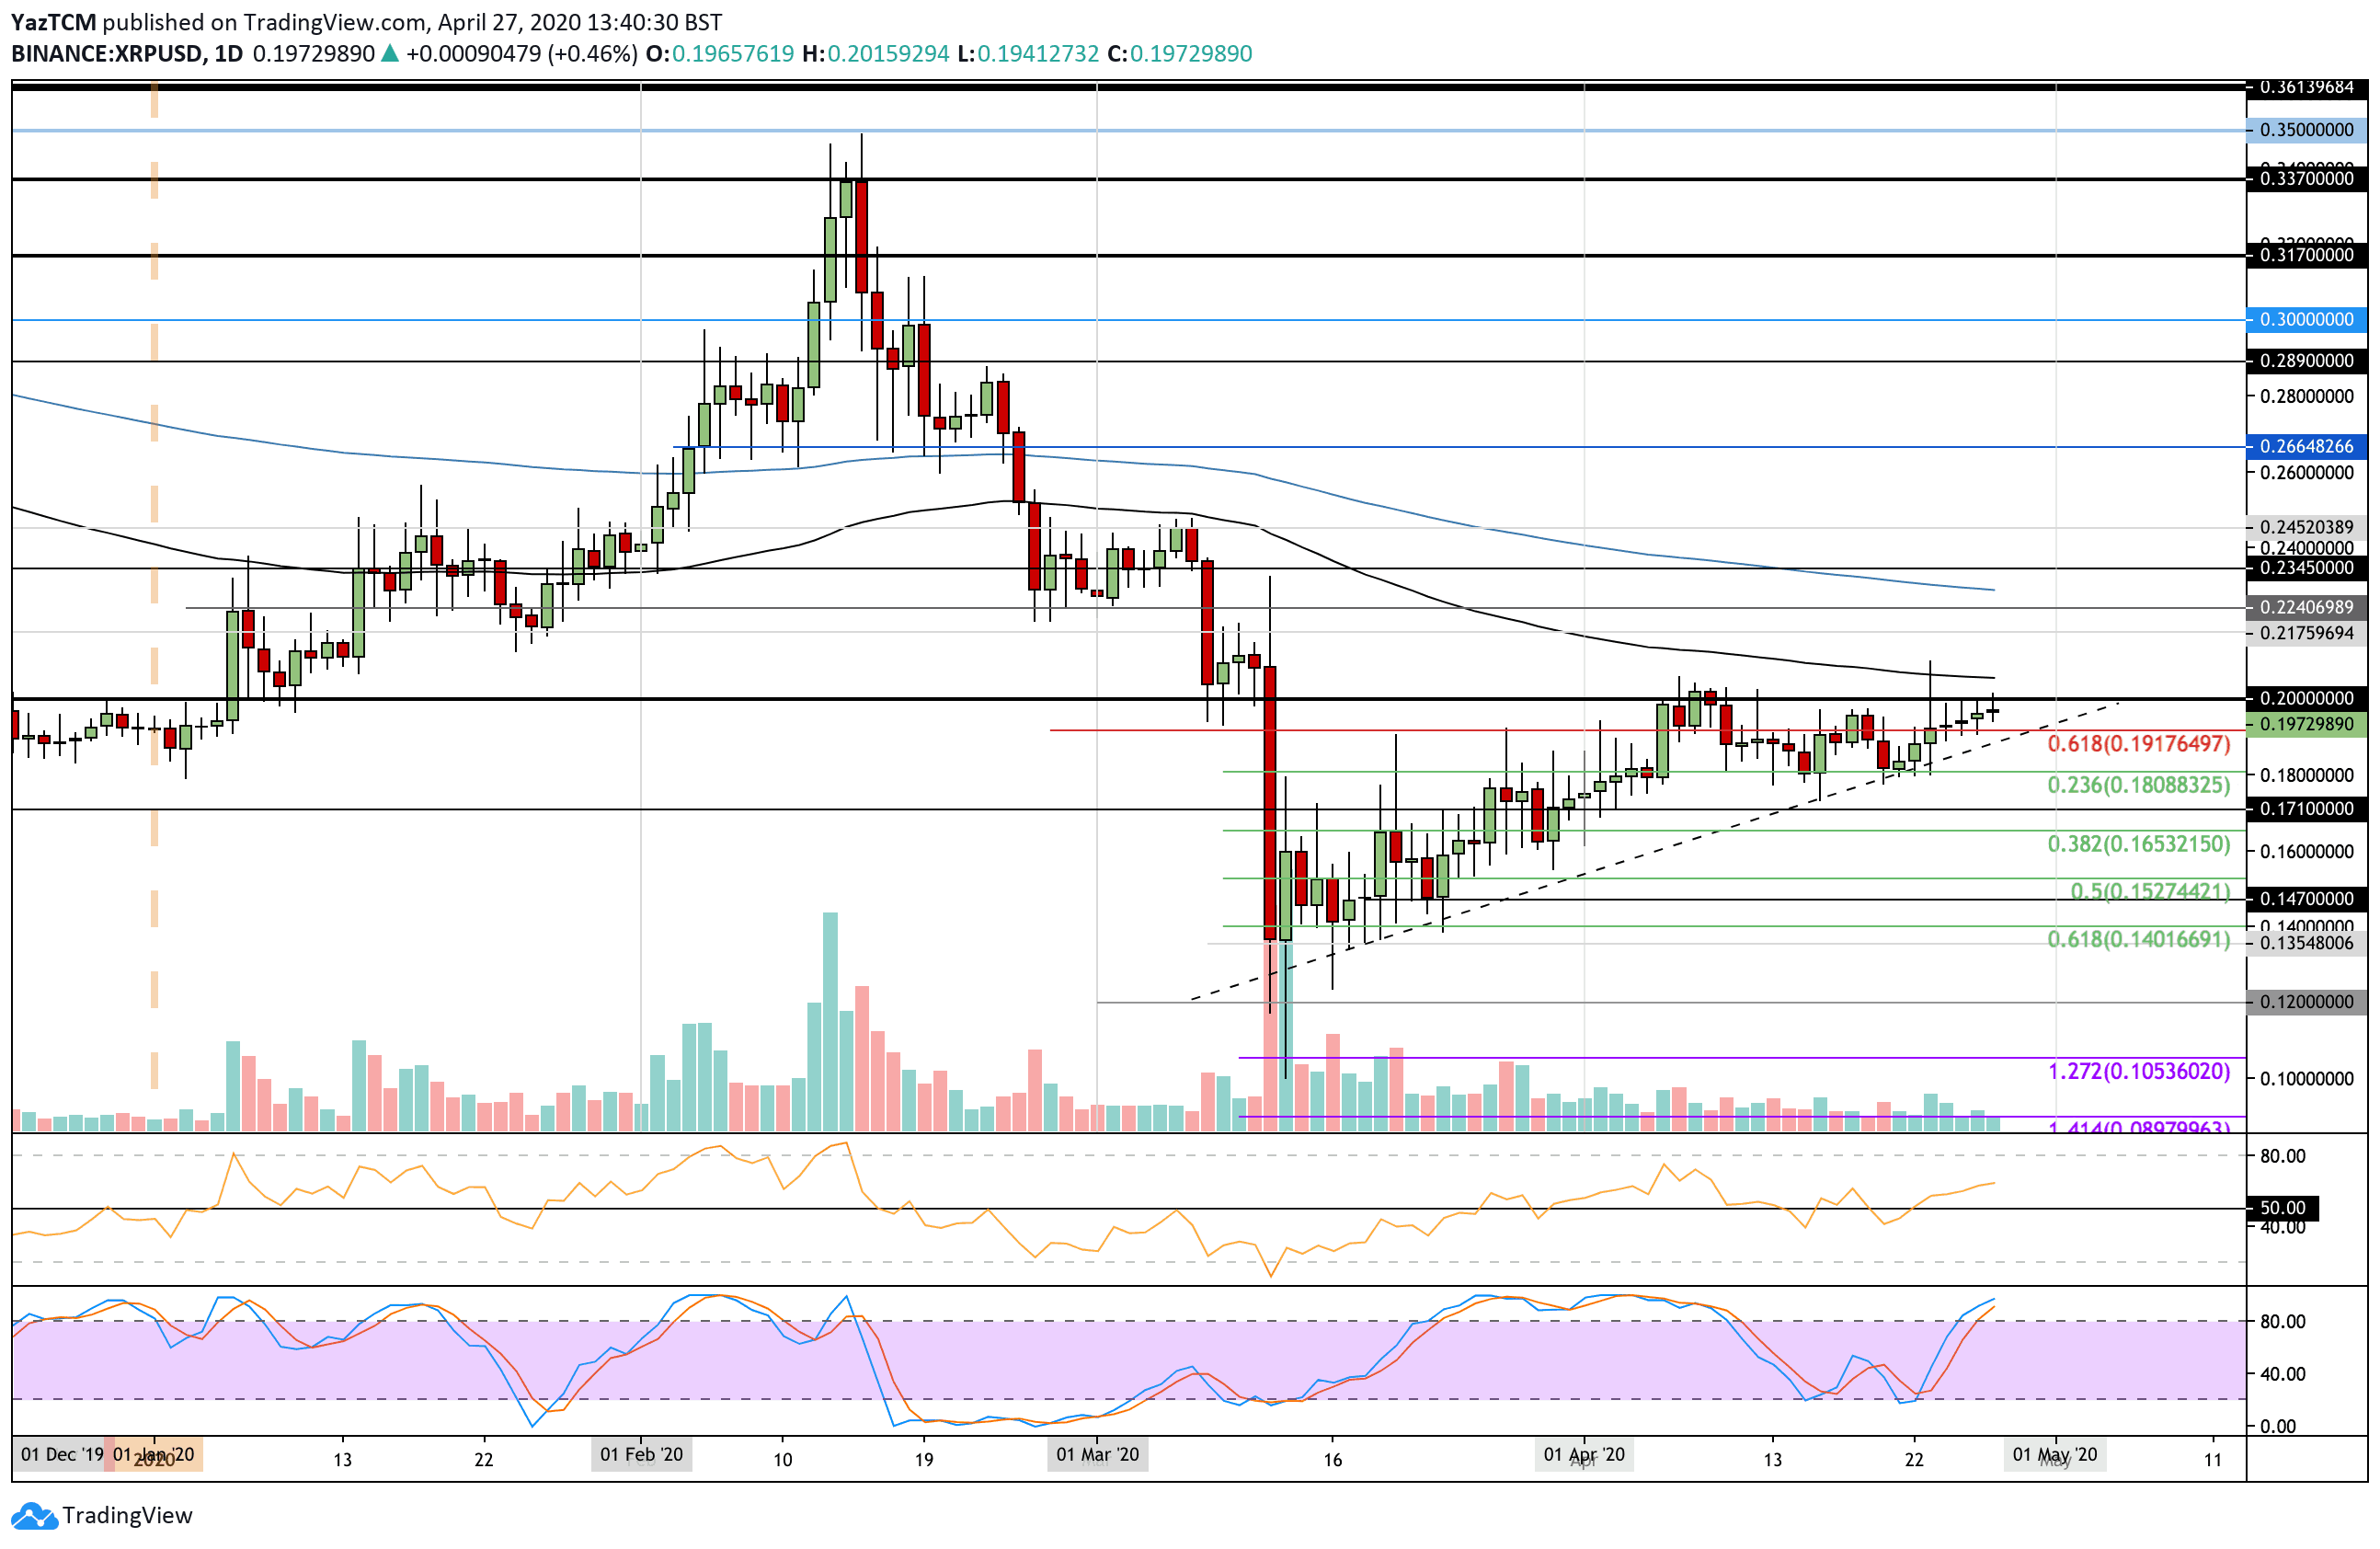
XRP/USD Short Term Price Prediction
If the buyers eventually break $0.20, resistance is located at $0.218, $0.224, and $0.23 (200-days EMA). Additional resistance lies at $0.235 and $0.25.
Toward the downside, support is located at $0.191, the rising trend line, and $0.18 (.236 Fib Retracement). Beneath this, added support lies at $0.171, $0.165 (.382 Fib Retracement), and $0.16.
The RSI remains above the 50 line as the buyers still control the market momentum. However, the Stochastic RSI is approaching overbought conditions, and a bearish crossover signal would indicate that the selling pressure is starting to increase.
XRP/BTC: Ripple Creates Fresh April Lows Against BTC
Against Bitcoin, XRP dropped beneath the support at 2600 SAT this week as it continued to dip further lower into the current 2550 SAT support. The coin is now trading around 2560 SAT as it attempts to recover.
XRP has been falling against BTC all month and must break above the falling trend line to start any form of bullish press higher.
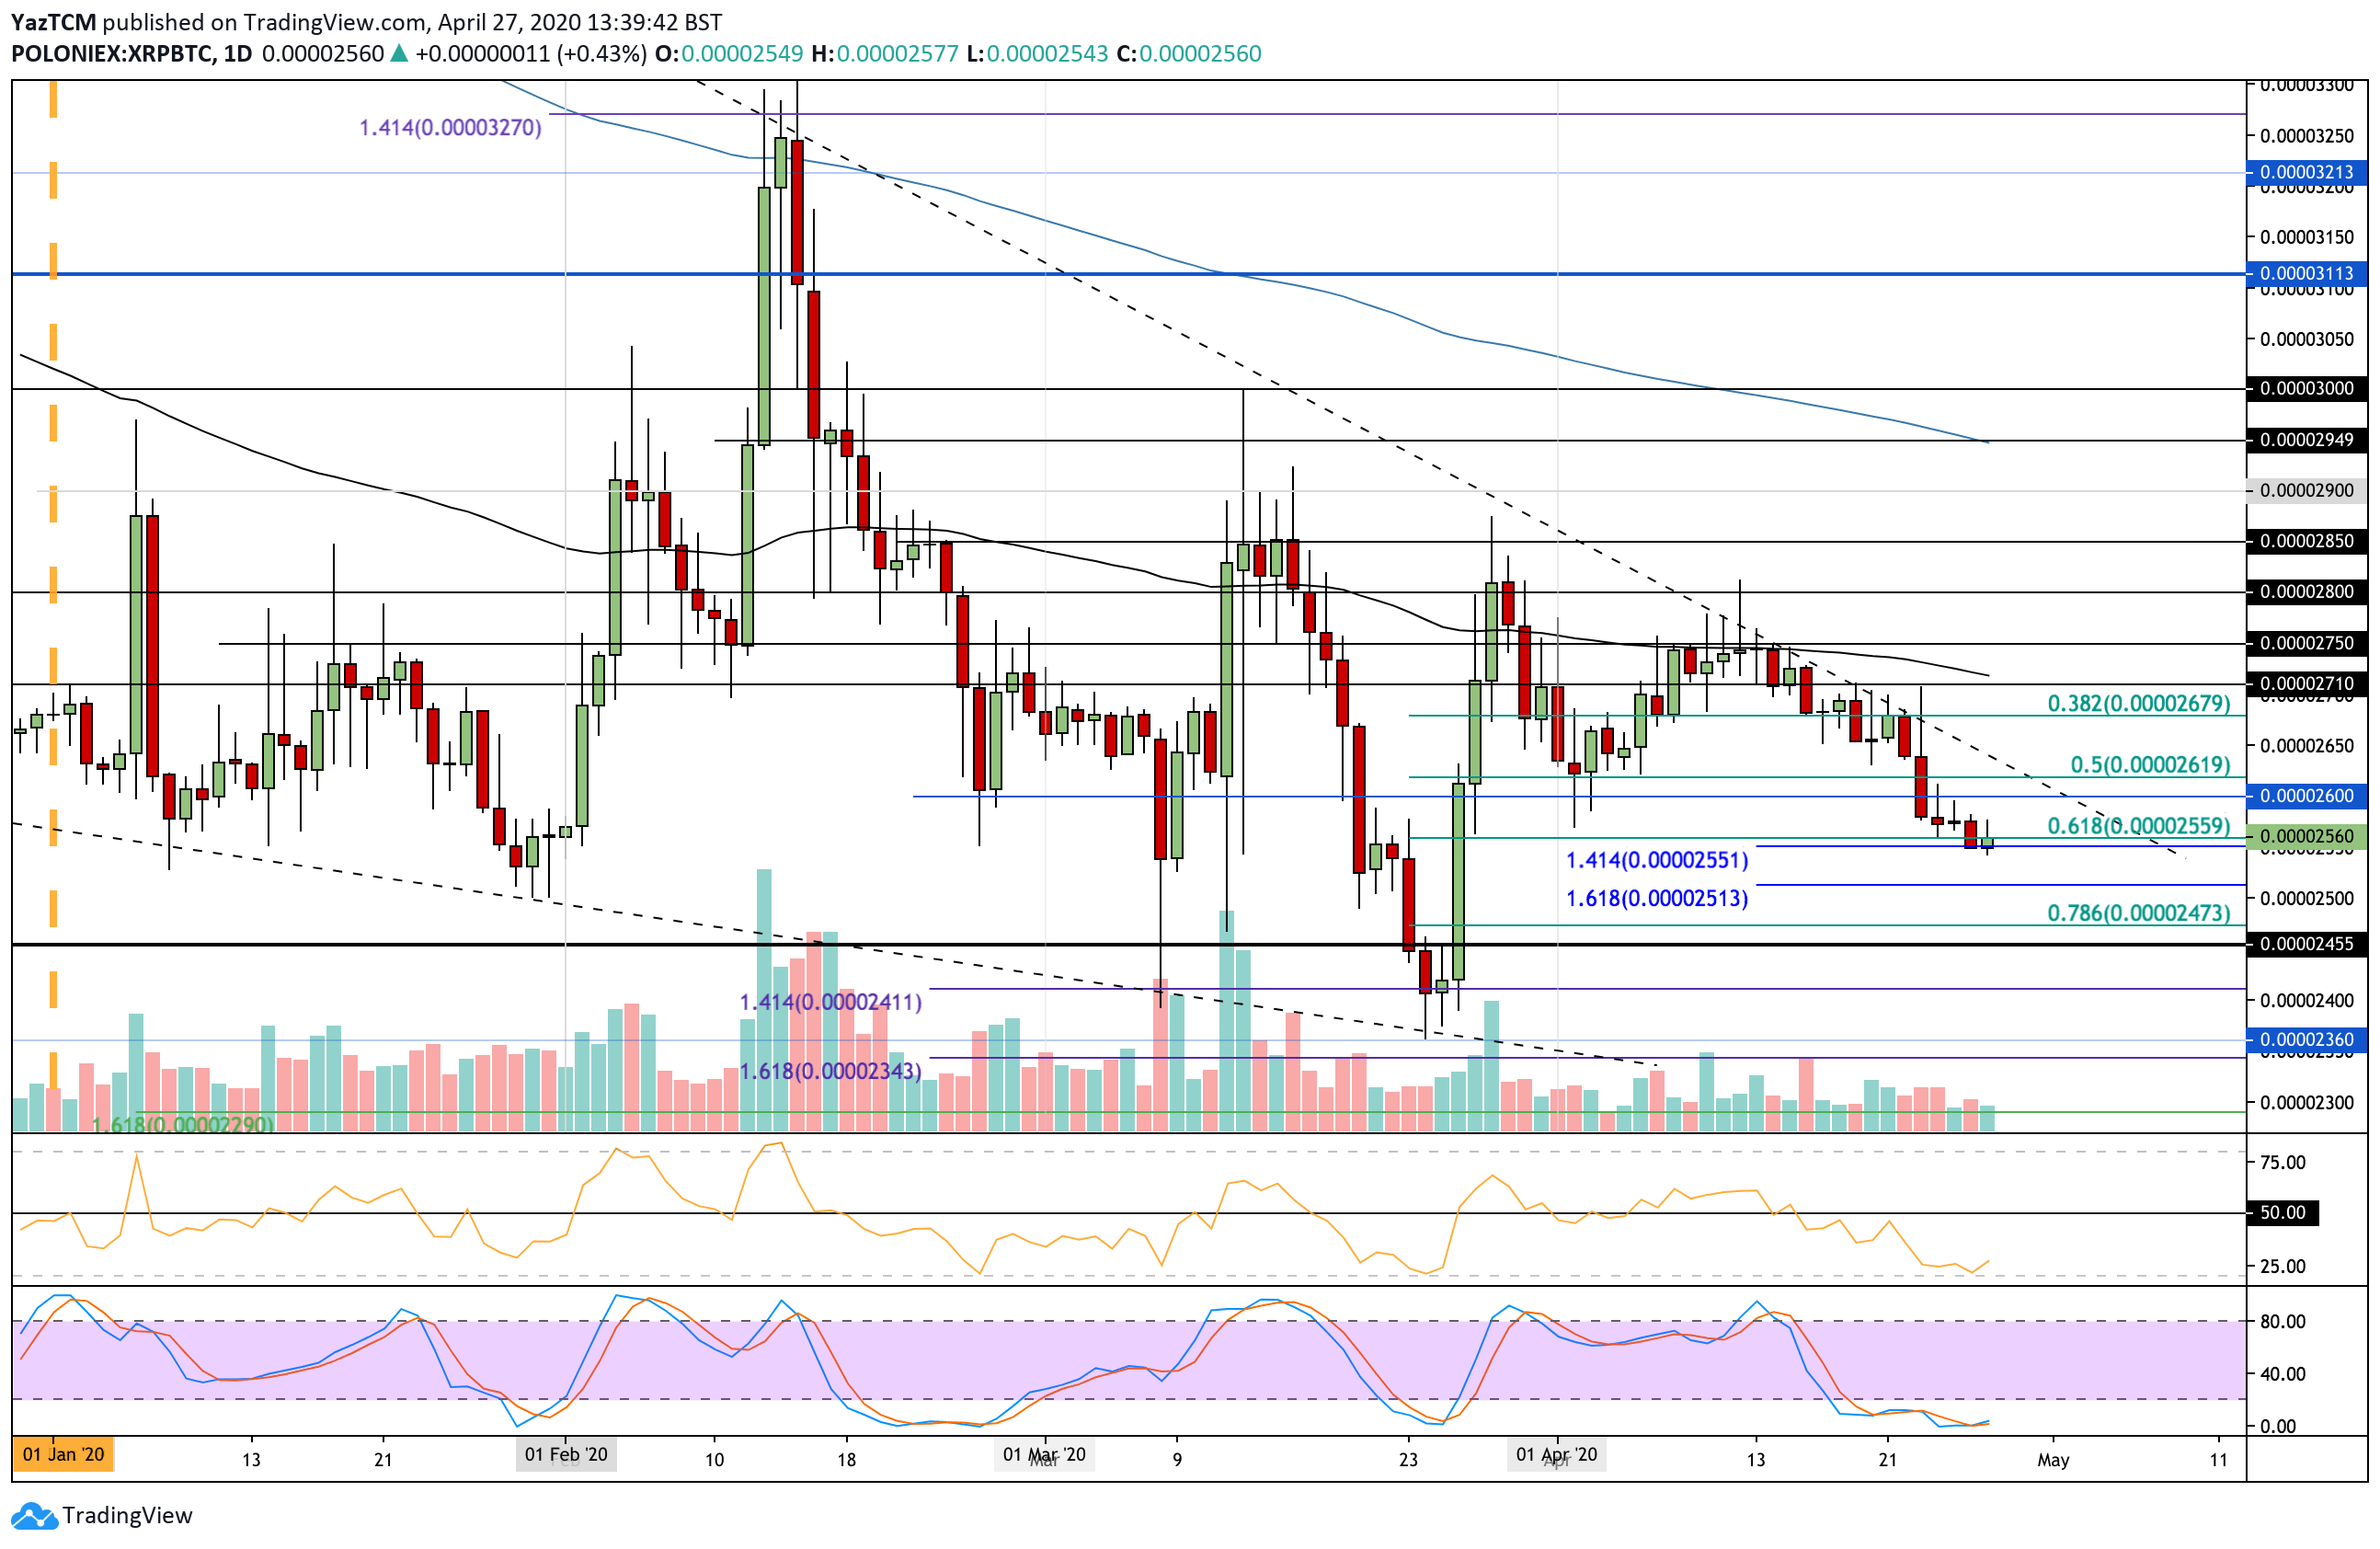
XRP/BTC Short Term Price Prediction
If the sellers continue to drive XRP beneath 2550 SAT, support can be found at 2510 SAT (downside 1.618 Fib Extension) and 2500 SAT. Beneath this, added support lies at 2470 SAT (.786 Fib Retracement), 2455 SAT, and 2400 SAT.
On the other side, if the bulls can rebound from 2550 SAT and push higher, resistance is located at 2600 SAT, 2620 SAT, and the falling trend line. Above the trend line, added resistance lies at 2680 SAT, 2710 SAT (100-days EMA), and 2750 SAT.
The RSI has reached oversold conditions and has started to uptick. This shows that the sellers may be exhausted, and we could expect a bullish recovery. Furthermore, the Stochastic RSI is also extremely oversold and is primed for a bullish crossover signal that should send XRP higher.