VET saw a massive price surge over the past 24 hours as the cryptocurrency reached %excerpt%.0168.The coin has been on a rampage this week after exploding by a total of 65%.Against Bitcoin, VET created a fresh 19-month high as it reached the 180 SAT level.Key Support & Resistance LevelsVET/USD:Support: %excerpt%.0136, %excerpt%.011, %excerpt%.01.Resistance: %excerpt%.0152, %excerpt%.0161, %excerpt%.018.VET/BTC:Support: 150 SAT, 130 SAT, 113 SAT.Resistance: 181 SAT, 200 SAT, 221 SAT.VET/USD: VeChain Reaches Fresh 22-Month HighsThe price surge this week caused VET to climb to a fresh 22-month high as the coin reaches the %excerpt%.0168 level. VET started to climb in May 2020 when it broke above the 200-days EMA and pushed higher toward %excerpt%.007.In June, it climbed higher but struggled to break the resistance at %excerpt%.0107 (bearish .5 Fib Retracement).
Topics:
Yaz Sheikh considers the following as important: Price Analysis, VeChain (VET), VETBTC, VETUSD
This could be interesting, too:
CryptoVizArt writes ETH’s Path to K Involves Maintaining This Critical Support (Ethereum Price Analysis)
Duo Nine writes Crypto Price Analysis June-29: ETH, XRP, ADA, DOGE, and DOT
Duo Nine writes Crypto Price Analysis June-15: ETH, XRP, ADA, DOGE, and DOT
Duo Nine writes Why is the Shiba Inu (SHIB) Price Down Today?
- VET saw a massive price surge over the past 24 hours as the cryptocurrency reached $0.0168.
- The coin has been on a rampage this week after exploding by a total of 65%.
- Against Bitcoin, VET created a fresh 19-month high as it reached the 180 SAT level.
Key Support & Resistance Levels
VET/USD:
Support: $0.0136, $0.011, $0.01.
Resistance: $0.0152, $0.0161, $0.018.
VET/BTC:
Support: 150 SAT, 130 SAT, 113 SAT.
Resistance: 181 SAT, 200 SAT, 221 SAT.
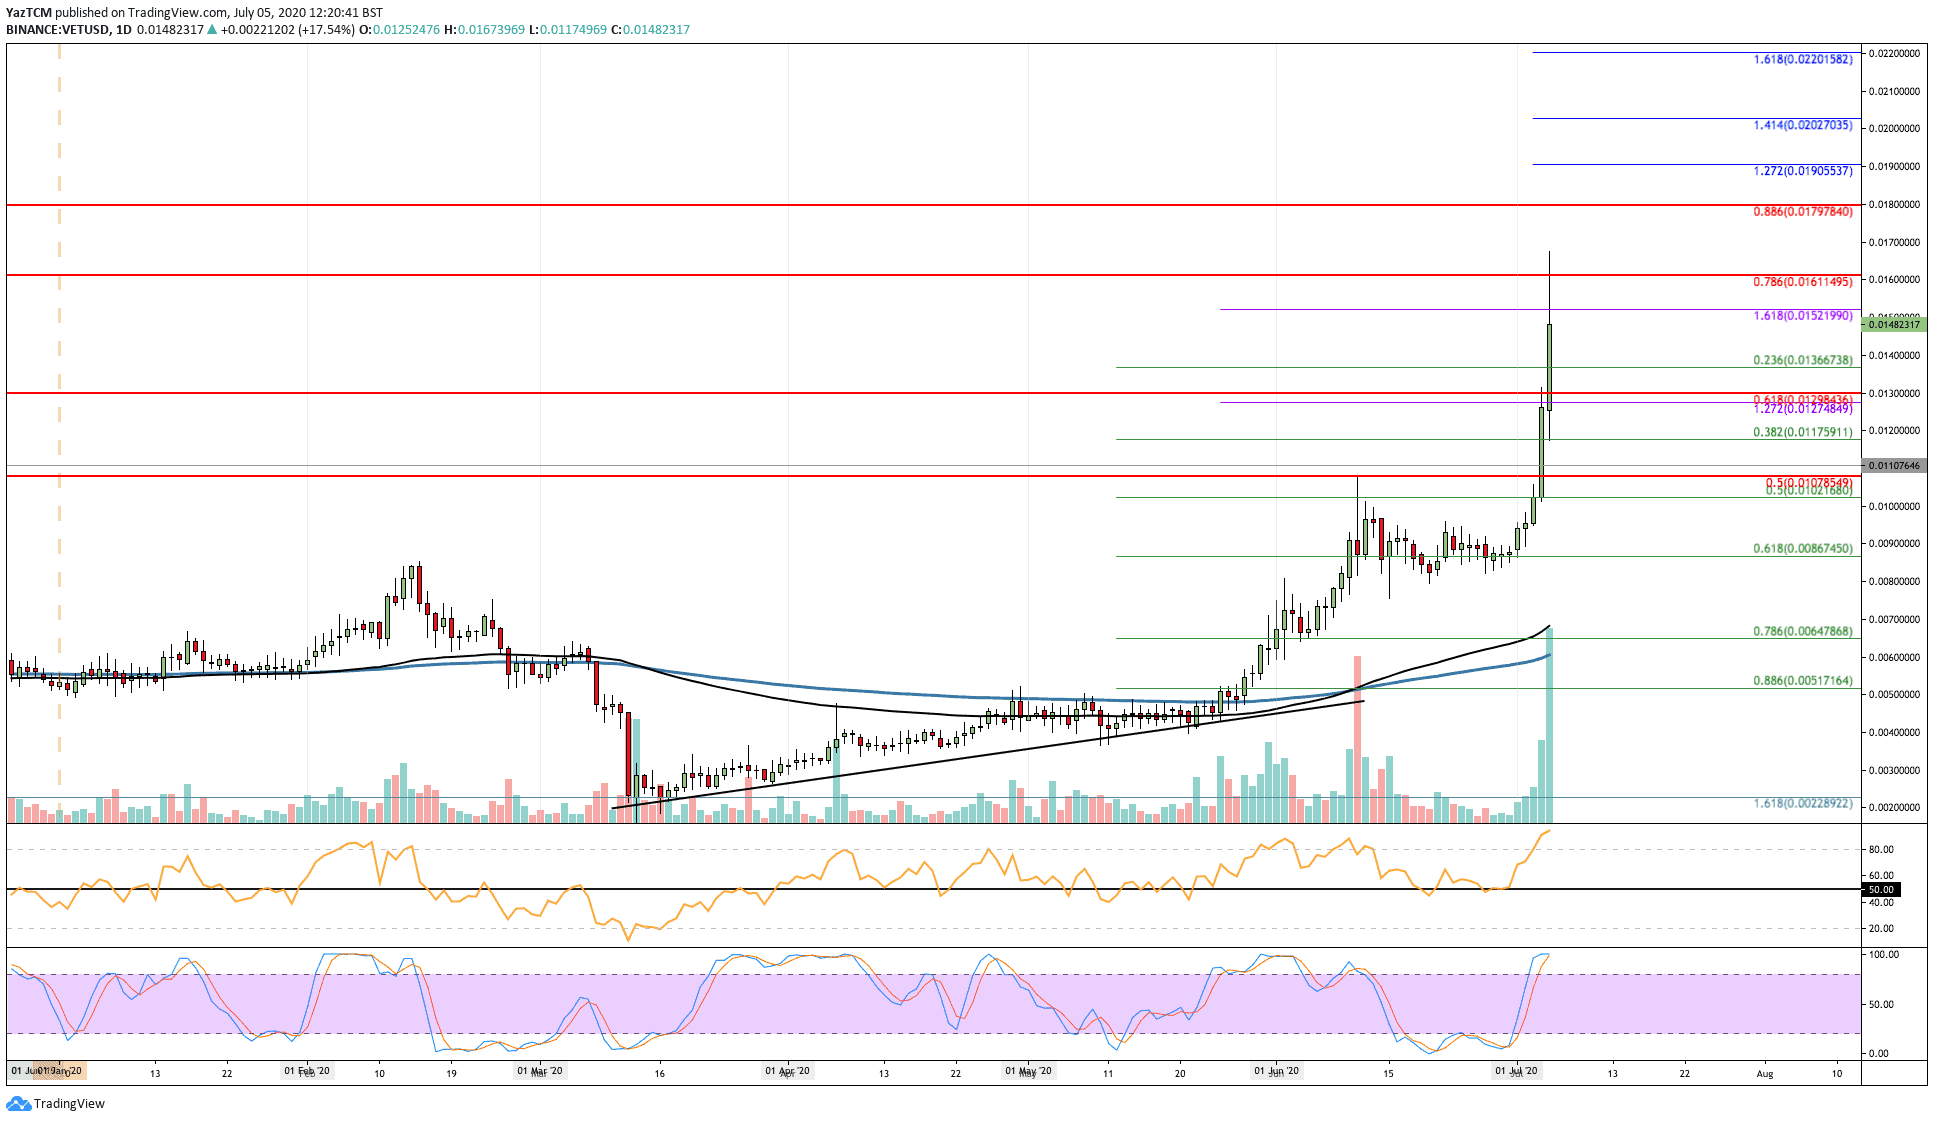
VET/USD: VeChain Reaches Fresh 22-Month Highs
The price surge this week caused VET to climb to a fresh 22-month high as the coin reaches the $0.0168 level. VET started to climb in May 2020 when it broke above the 200-days EMA and pushed higher toward $0.007.
In June, it climbed higher but struggled to break the resistance at $0.0107 (bearish .5 Fib Retracement). This level was broken in July 2020 when VET continued higher above $0.013 to reach the $0.0161 resistance (bearish .786 Fib Retracement) and even peak above it.
VET-USD Short Term Price Prediction
Looking ahead, if the buyers continue to push VET higher, the first two levels of resistance are located at $0.0152 (1.618 FIb Extension) and $0.0161 (bearish .786 Fib Retracement). Above this, added resistance lies at $0.018 (bearish .886 Fib Retracement), $0.019 (1.272 Fib Extension), and $0.020 (1.414 Fib Extension).
On the other side, if the sellers push lower, the first level of support is located at $0.0136 (.236 Fib Retracement). Beneath this, added support is found at $0.011 (.382 Fib Retracement), $0.01 (.5 Fib Retracement), and $0.0086 (.618 Fib Retracement).
The RSI is well above the 50 line to show the buyers dominate the market momentum. However, the Stochastic RSI is extremely overbought and is primed for a bearish crossover signal that could send the market lower.
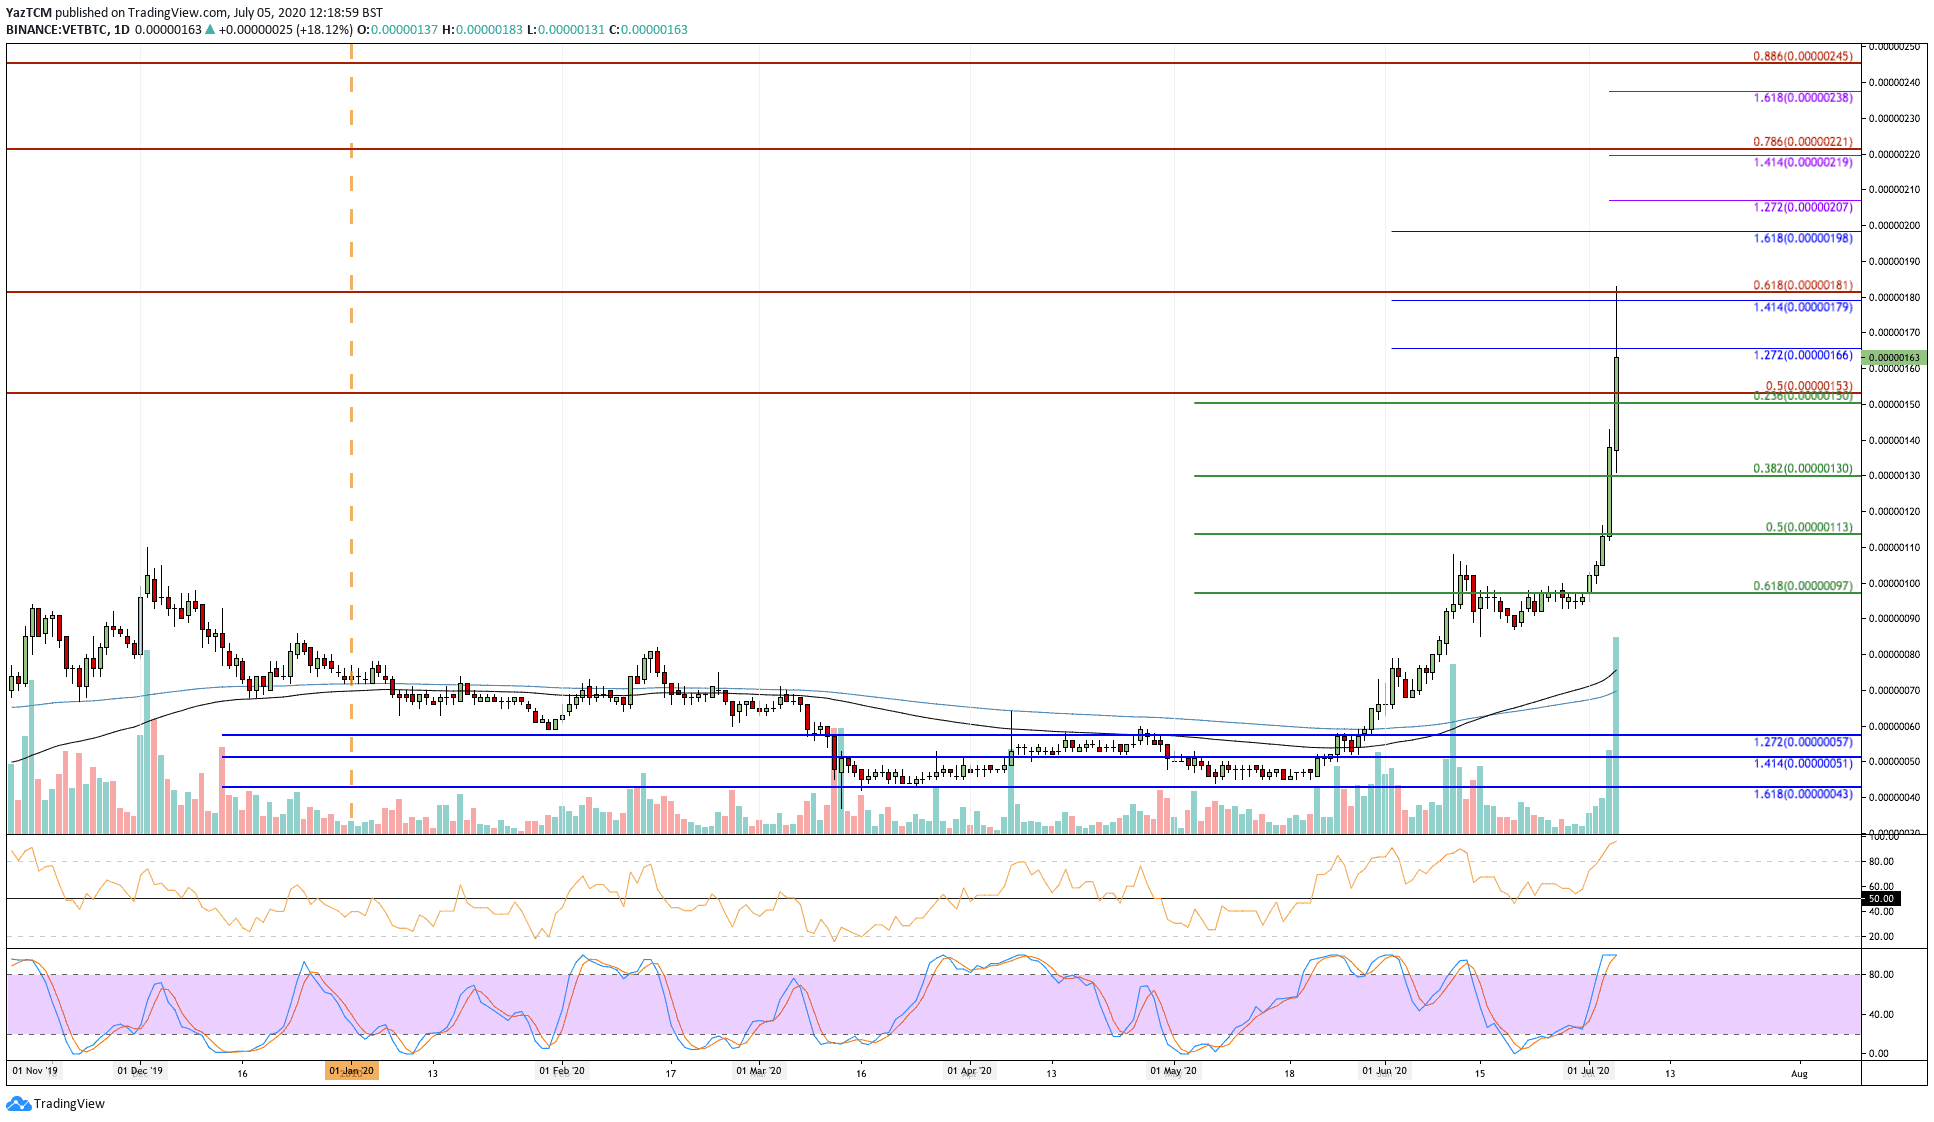
VET/BTC: Bulls Reach 19-Month Price High
Against Bitcoin, VET has been surging in the same manner as the coin pushed higher from 100 SAT at the start of July to reach the current resistance at the 181 SAT level (bearish .618 Fib Retracement).
This price increase allowed it to create a new 19-month price high against BTC. VET has since dropped from 181 SAT as it trades at 162 SAT.
VET-BTC Short Term Price Prediction
If the bulls push higher, the first level of strong resistance lies at 181 SAT (bearish .618 Fib Retracement). Above this, added resistance lies at 200 SAT, 221 SAT (bearish .786 Fib Retracement), and 238 SAT (1.618 Fib Extension).
On the other side, the first level of support lies at 150 sat (.236 Fib Retracement). Beneath this, support is found at 130 SAT (.382 Fib Retracement) and 113 SAT (.5 Fib Retracement).
Likewise, the Stochastic RSI is overbought and is primed for a bullish crossover signal that could send the market lower.