XRP saw a strong 40% price explosion this week as it reached the %excerpt%.3 level.Despite Bitcoin’s recent price drop this weekend, XRP remained above %excerpt%.3.Against Bitcoin, XRP created a fresh 3-month high as it hit 2720 SAT.XRP/USD: XRP Bulls Remain Strong After Crypto Market DropKey Support Levels: %excerpt%.291, %excerpt%.28, %excerpt%.268.Key Resistance Levels: %excerpt%.313, %excerpt%.321, %excerpt%.331.XRP saw an extraordinary month since breaking above the 200-days EMA at %excerpt%.21 toward the end of July. After overcoming this level, it surged higher to reach as high as %excerpt%.30 by August 1st.Over the weekend, Bitcoin saw significant volatility as it dropped by ,300 in just a few minutes. This caused instability in the price of XRP as it fell from above %excerpt%.32 to reach as low as %excerpt%.245. It recovered very quickly and managed to push
Topics:
Yaz Sheikh considers the following as important: Ripple (XRP) Price, XRP Analysis, xrpbtc, xrpusd
This could be interesting, too:
Jordan Lyanchev writes Ripple’s (XRP) Surge to Triggers Over Million in Short Liquidations
Jordan Lyanchev writes Trump Confirms Work on Strategic Crypto Reserve: XRP, ADA, SOL Included
Dimitar Dzhondzhorov writes Is a Major Ripple v. SEC Lawsuit Development Expected This Week? Here’s Why
Mandy Williams writes Ripple Releases Institutional DeFi Roadmap for XRP Ledger in 2025
- XRP saw a strong 40% price explosion this week as it reached the $0.3 level.
- Despite Bitcoin’s recent price drop this weekend, XRP remained above $0.3.
- Against Bitcoin, XRP created a fresh 3-month high as it hit 2720 SAT.
XRP/USD: XRP Bulls Remain Strong After Crypto Market Drop
Key Support Levels: $0.291, $0.28, $0.268.
Key Resistance Levels: $0.313, $0.321, $0.331.
XRP saw an extraordinary month since breaking above the 200-days EMA at $0.21 toward the end of July. After overcoming this level, it surged higher to reach as high as $0.30 by August 1st.
Over the weekend, Bitcoin saw significant volatility as it dropped by $1,300 in just a few minutes. This caused instability in the price of XRP as it fell from above $0.32 to reach as low as $0.245. It recovered very quickly and managed to push back above the $0.30 level today.
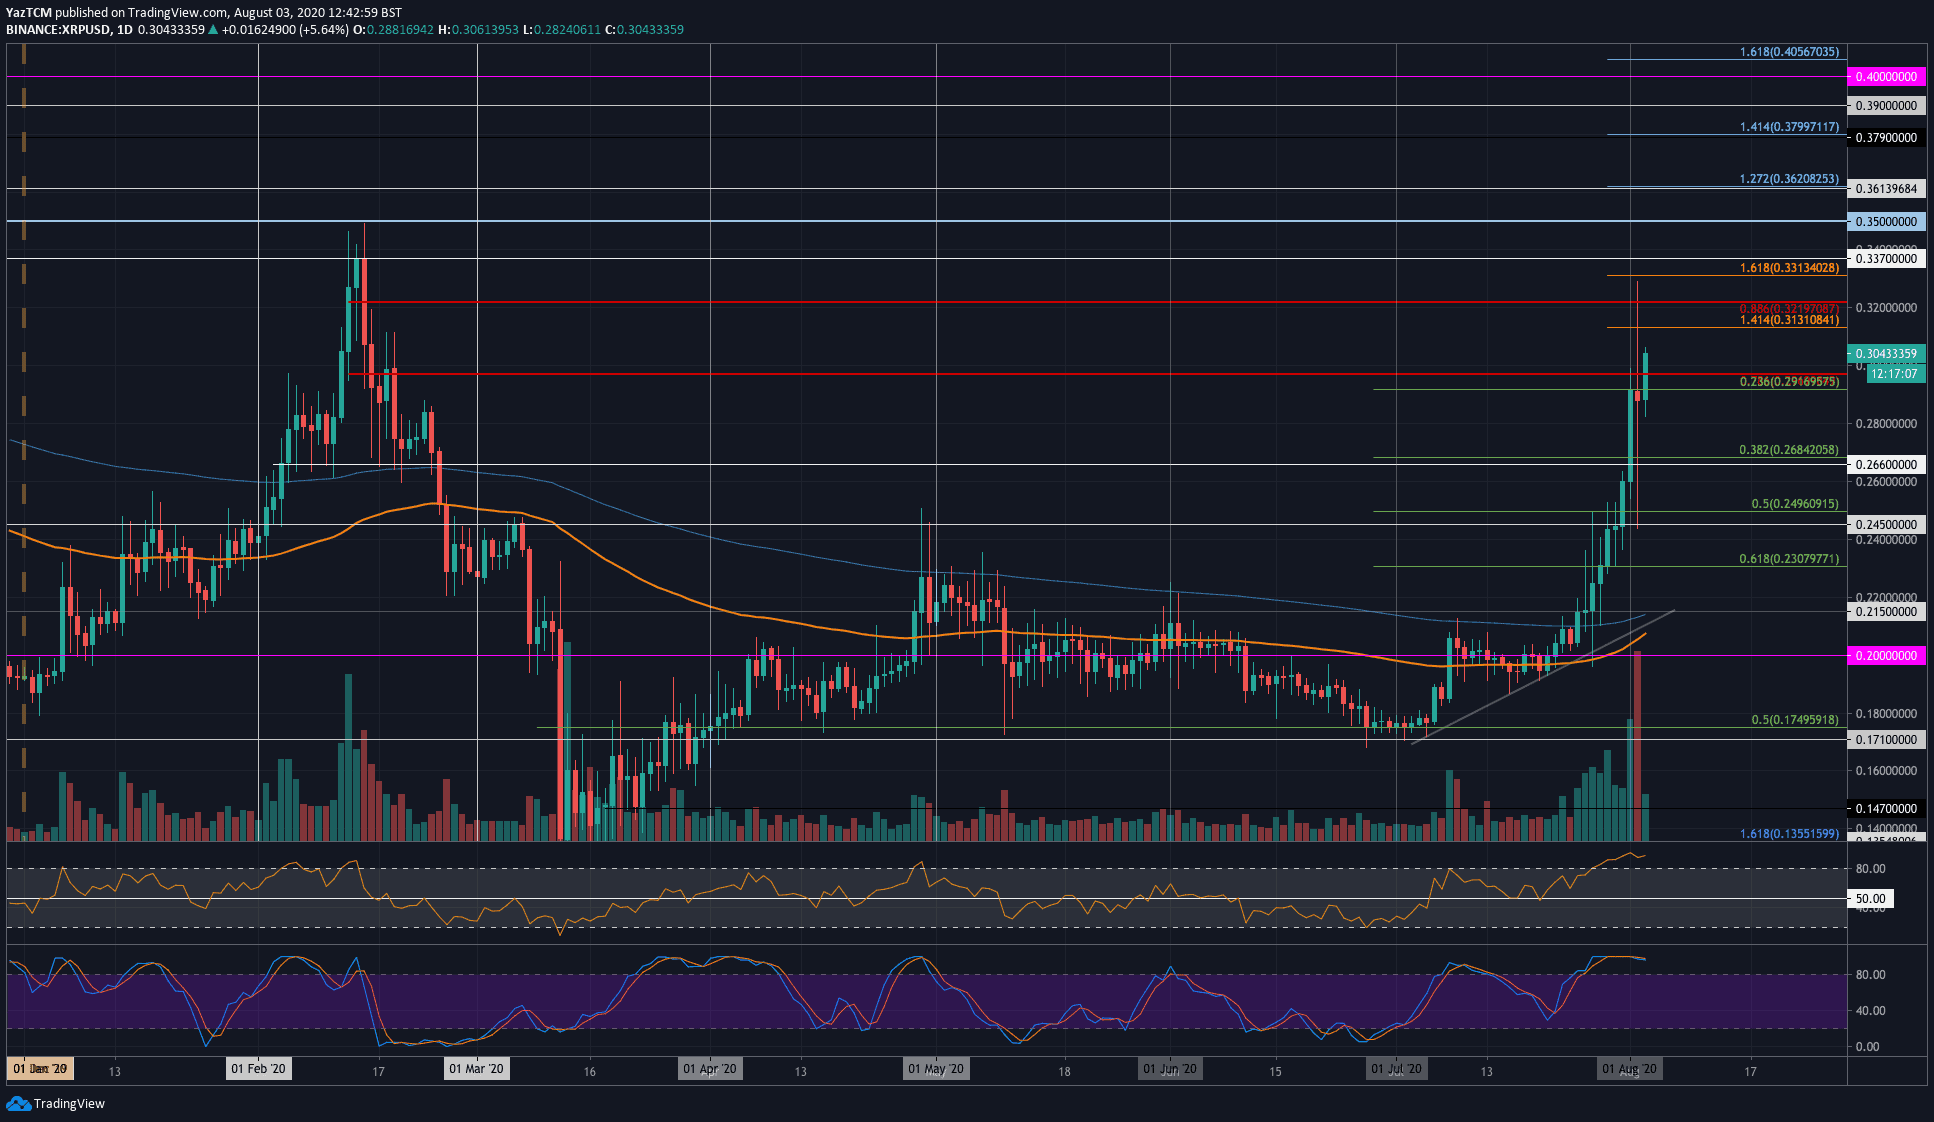
XRP-USD Short Term Price Prediction
Looking ahead, if the bulls continue to push XRP higher, the first level of resistance is expected at $0.313 (1.414 Fib Extension). The following targets are $0.321 (bearish .886 Fib Retracement), $0.331 (1.618 Fib Extension), and $0.337.
On the other side, the first level of support lies at $0.291 (.236 Fib Retracement). Below that, there’s support at $0.28, $0.268 (.382 Fib Retracement), and 0.25 (5 Fib Retracement).
The RSI has reached extremely overbought conditions as it hovers at levels that have not been seen since September 2018. This could suggest the market may be a little overextended and may need to retrace slightly.
XRP/BTC: Bulls Set Fresh 3-Month High After Breaking 200-days EMA
Key Support Levels: 2600 SAT, 2530 SAT, 2430 SAT.
Key Resistance Levels: 2750 SAT, 2800 SAT, 2850 SAT.
XRP has also been surging aggressively against Bitcoin over the past week. The coin rebounded from support at 2022 SAT toward the end of July as it started to push higher. As August came, XRP pushed higher above the 200-days EMA at 2450 SAT. It closed above the 200-days EMA for the first time since February 2020.
XRP continued to push higher today as it broke above resistance at 2630 SAT (bearish .5 Fib Retracement) to reach 2720 SAT.
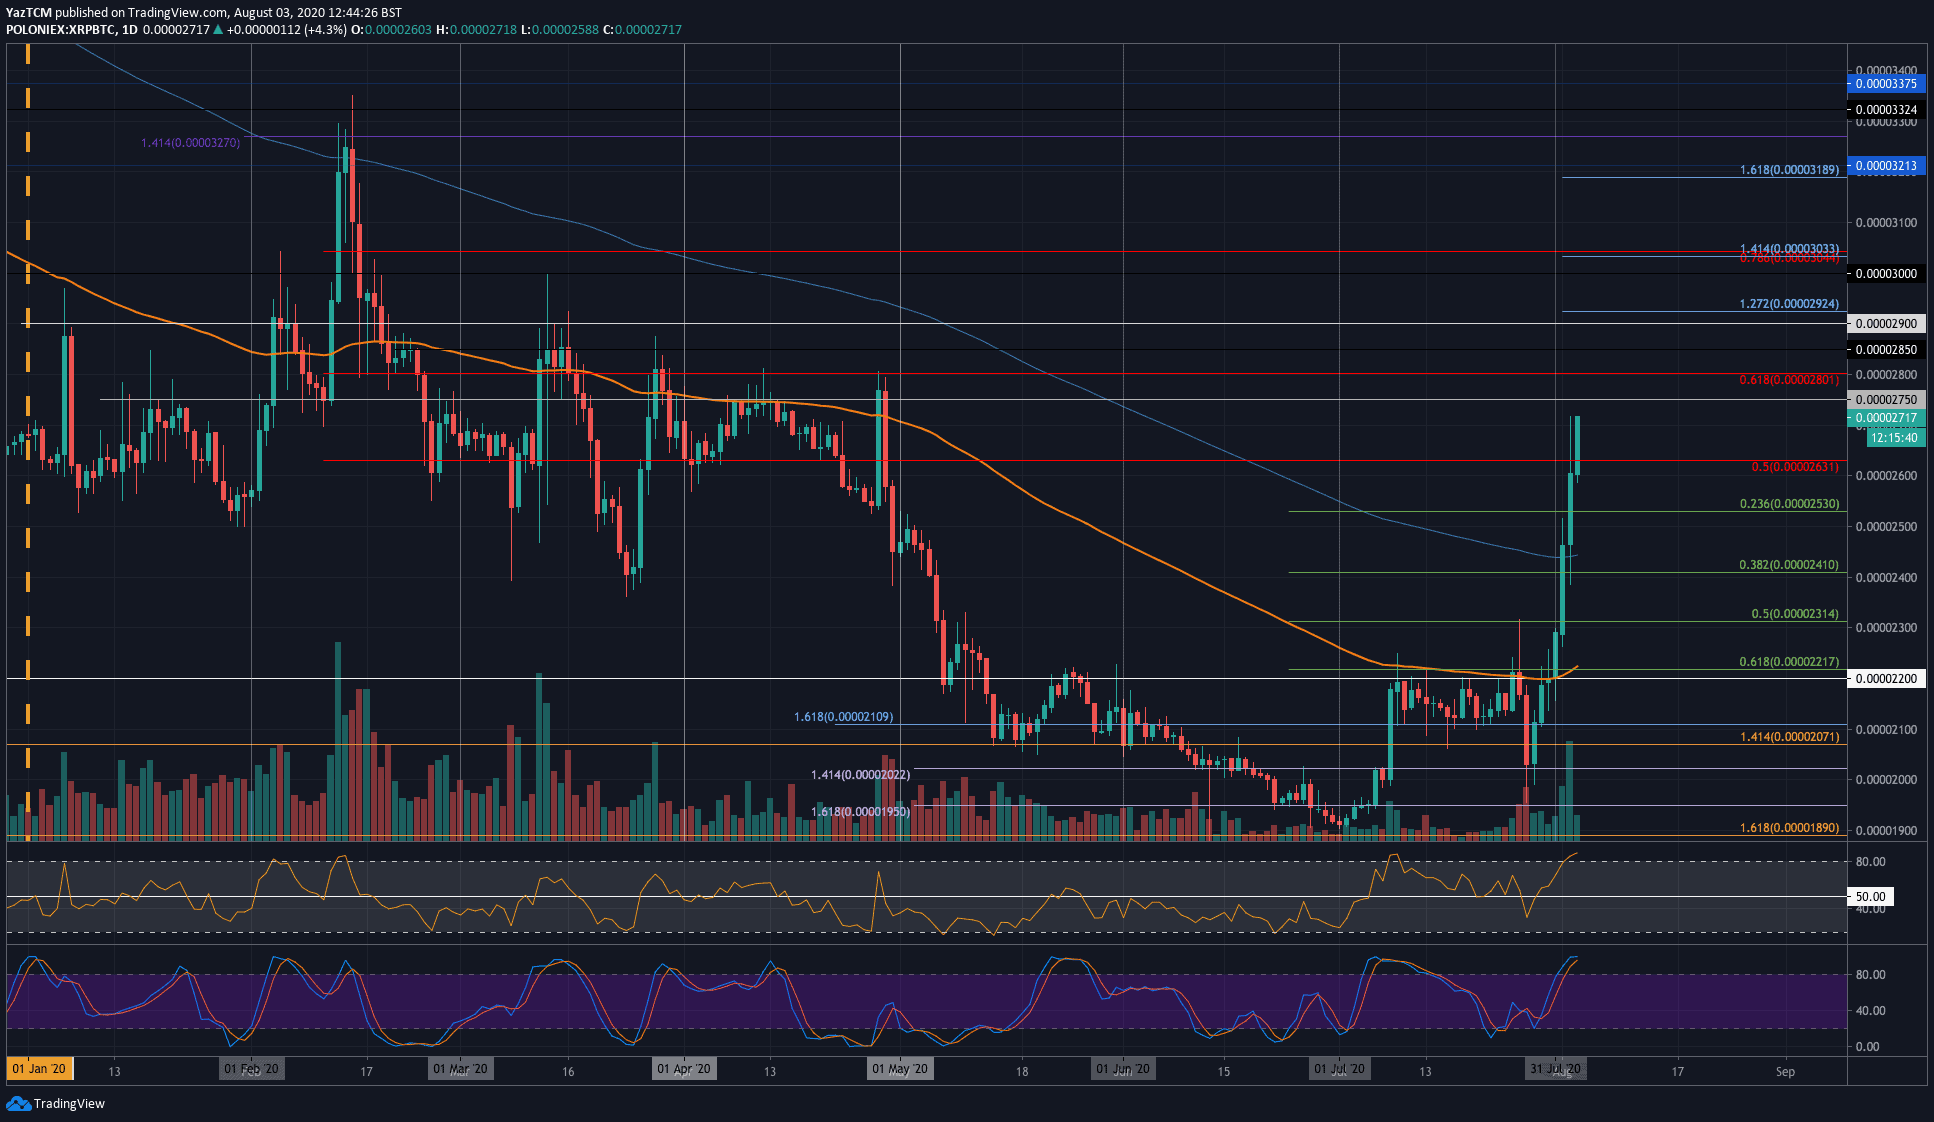
XRP-BTC Short Term Price Prediction
Moving forward, if the buyers push higher, the first two levels of resistance lie at 2750 SAT and 2800 SAT (bearish .618 Fib Retracement). This is followed by 2850 SAT and 2900 SAT.
On the other side, the first level of support lies at 2600 SAT. Beneath this, support is found at 2530 SAT, 2430 SAT (200-days EMA), and 2400 SAT.
Likewise, the Stochastic RSI and RSI are extremely overbought. This is an indication that the bulls have pushed higher too quickly and may need to pull back slightly.