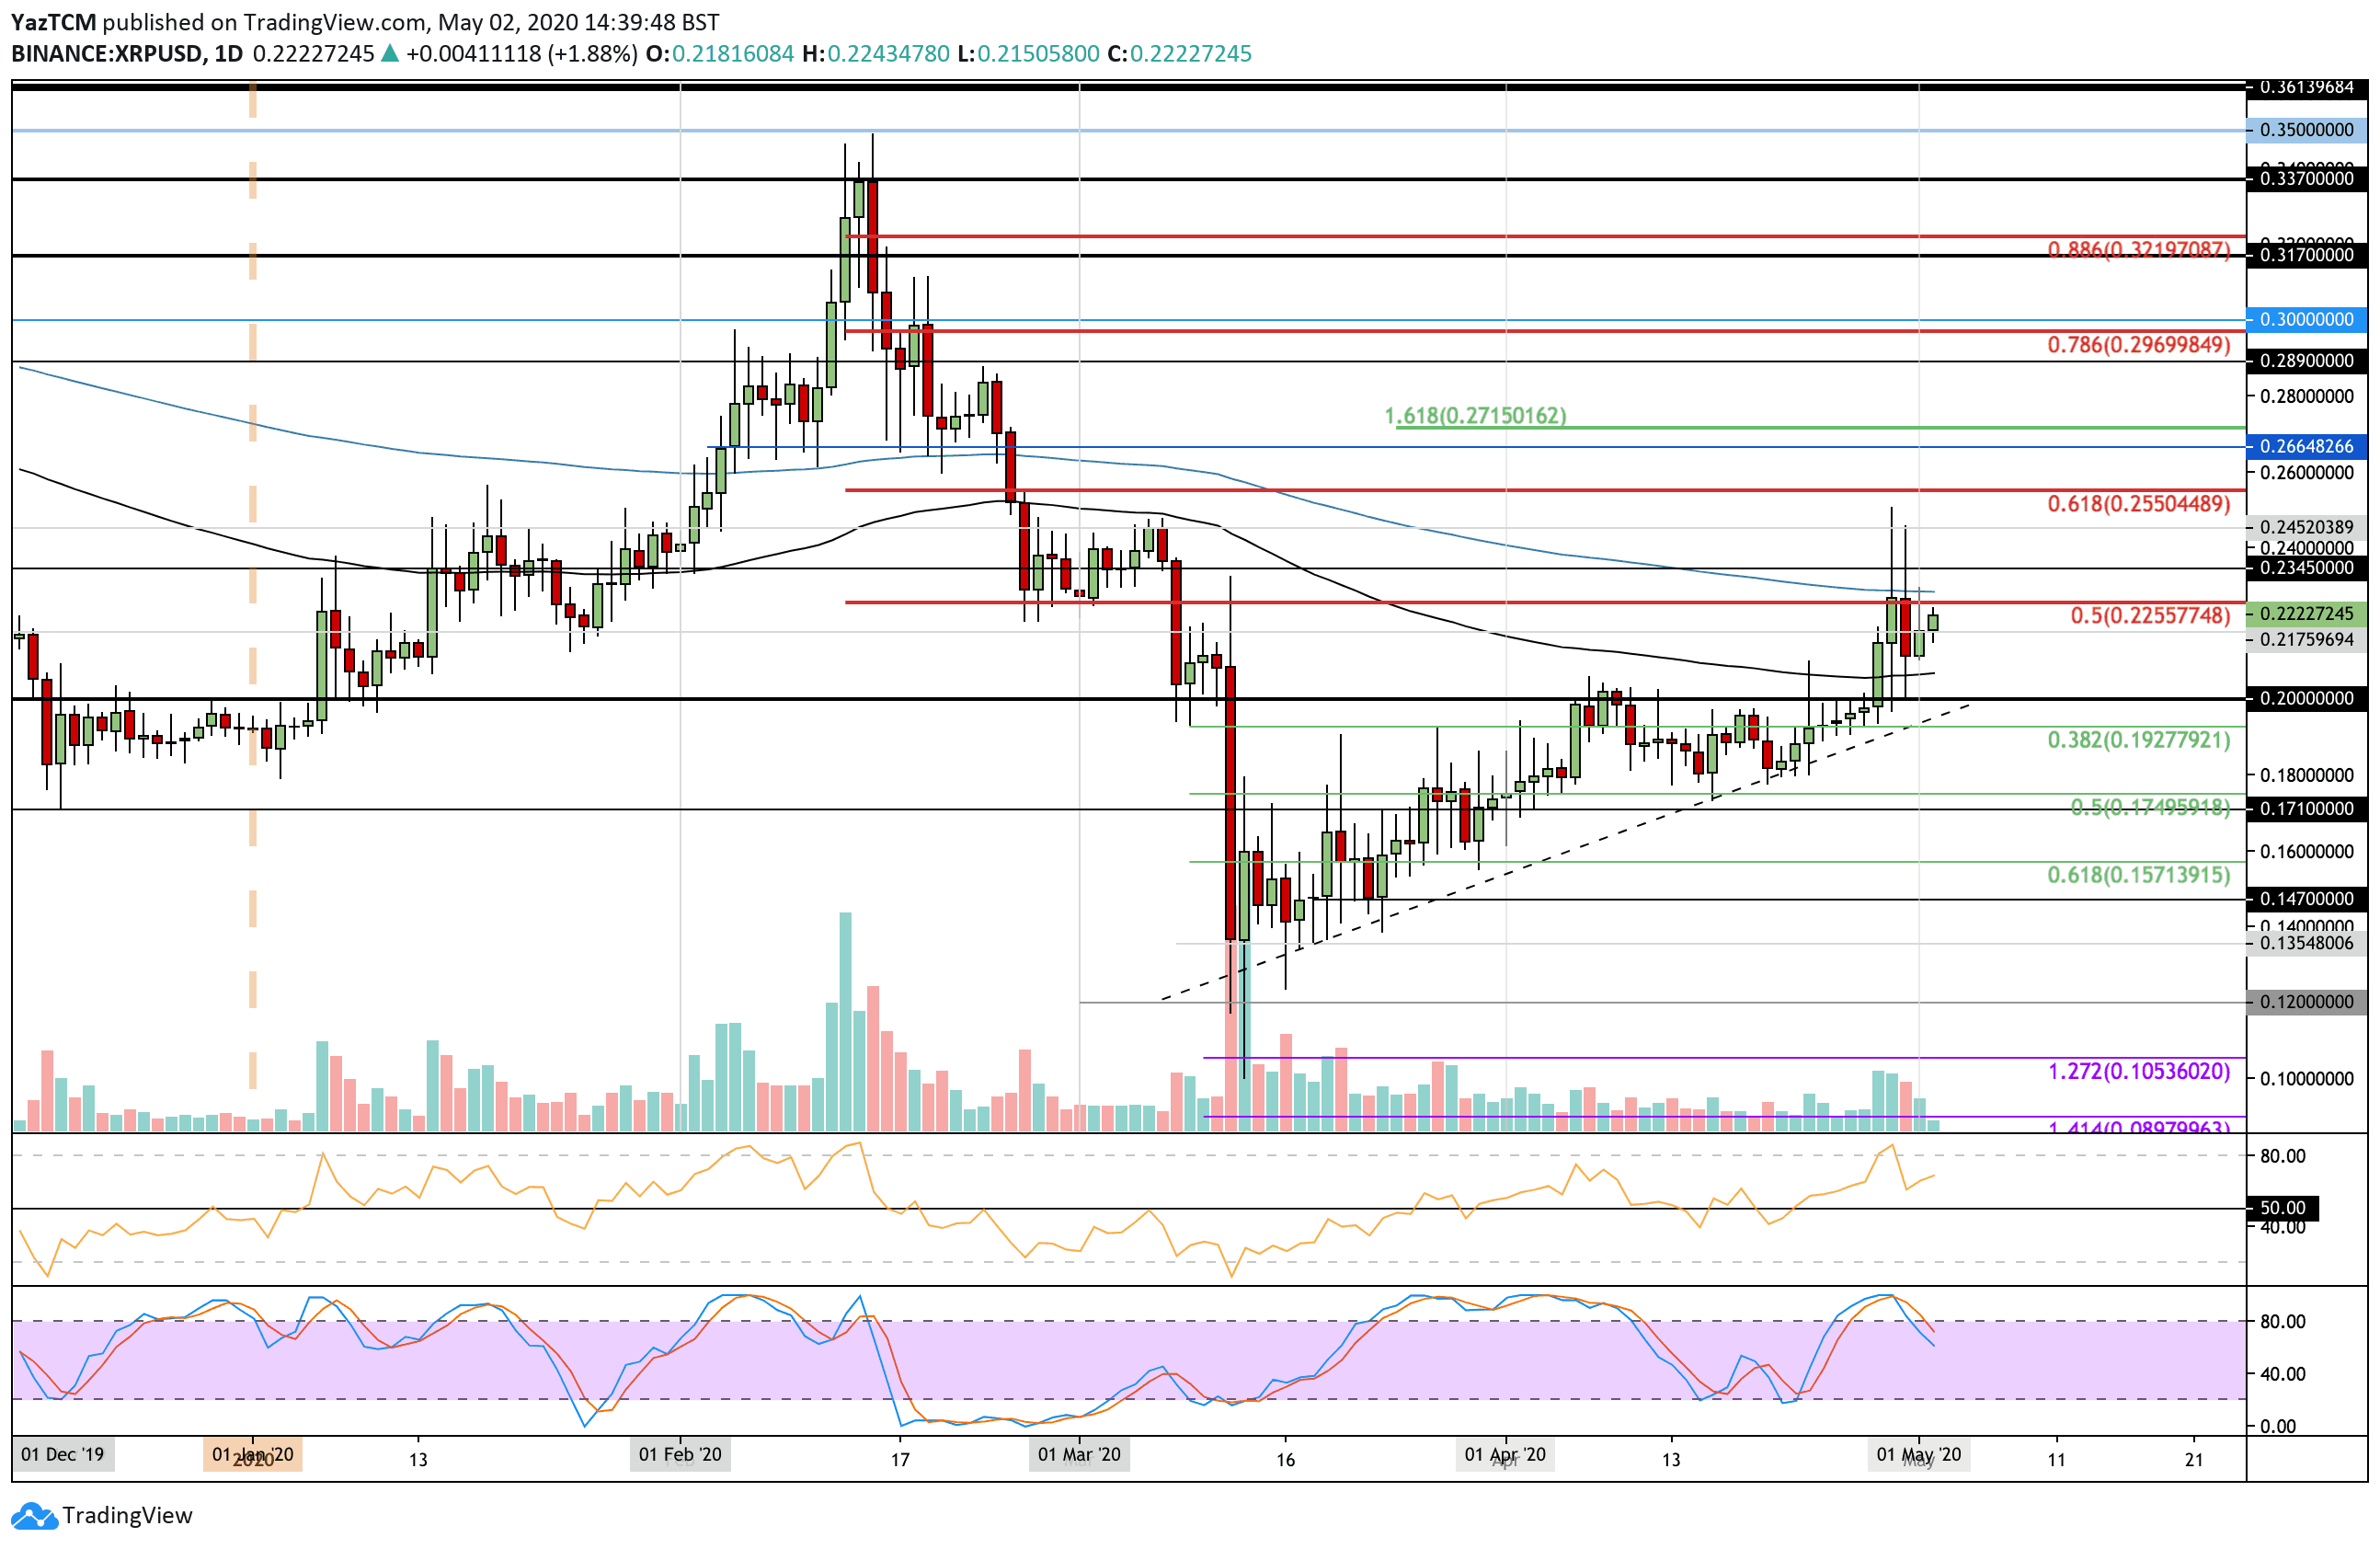
XRP saw a strong 13.5% price increase this week as the coin pushes above %excerpt%.22The cryptocurrency faces resistance at %excerpt%.228, where lies the 200-days EMA.Against Bitcoin, XRP as struggling toward the end of April after creating a fresh monthly low at 2400 SAT.Key Support & Resistance LevelsXRP/USD:Support: %excerpt%.217, %excerpt%.21, %excerpt%.208.Resistance: %excerpt%.228, %excerpt%.24, %excerpt%.245.XRP/BTC:Support: 2700 SAT, 2680 SAT, 2620 SAT.Resistance: 2750 SAT, 2800 SAT, 2850 SAT.XRP/USD: Ripple Must Break 200-days EMA To Push HigherXRP broke the strong resistance at %excerpt%.2 over the past 7-days of trading. It went on to spike as high as %excerpt%.25. However, the coin is struggling to close above the resistance at %excerpt%.228 (200-days EMA). Each time the coin attempted to close above %excerpt%.228, it failed to do so.Nevertheless, the break
Topics:
Yaz Sheikh considers the following as important: Ripple (XRP) Price, XRP Analysis, xrpbtc, xrpusd
This could be interesting, too:
Jordan Lyanchev writes Ripple’s (XRP) Surge to Triggers Over Million in Short Liquidations
Jordan Lyanchev writes Trump Confirms Work on Strategic Crypto Reserve: XRP, ADA, SOL Included
Dimitar Dzhondzhorov writes Is a Major Ripple v. SEC Lawsuit Development Expected This Week? Here’s Why
Mandy Williams writes Ripple Releases Institutional DeFi Roadmap for XRP Ledger in 2025
- XRP saw a strong 13.5% price increase this week as the coin pushes above $0.22
- The cryptocurrency faces resistance at $0.228, where lies the 200-days EMA.
- Against Bitcoin, XRP as struggling toward the end of April after creating a fresh monthly low at 2400 SAT.
Key Support & Resistance Levels
XRP/USD:
Support: $0.217, $0.21, $0.208.
Resistance: $0.228, $0.24, $0.245.
XRP/BTC:
Support: 2700 SAT, 2680 SAT, 2620 SAT.
Resistance: 2750 SAT, 2800 SAT, 2850 SAT.
XRP/USD: Ripple Must Break 200-days EMA To Push Higher
XRP broke the strong resistance at $0.2 over the past 7-days of trading. It went on to spike as high as $0.25. However, the coin is struggling to close above the resistance at $0.228 (200-days EMA). Each time the coin attempted to close above $0.228, it failed to do so.
Nevertheless, the break above $0.20 turned XRP bullish, but for the cryptocurrency to push higher, it must close above this resistance.
XRP/USD Short Term Price Prediction
Once the buyers break the 200-days EMA, the first level of resistance lies at $0.234. Above this, resistance is located at $0.245, $0.255 (bearish .618 Fib Retracement), and $0.266 (February support).
Toward the downside, support is expected at $0.217, $0.21 (100-days EMA), and $0.20. This is followed by added support at $0.192 (.382 Fib Retracement).
The RSI is above 50 to show that the bulls are in charge of the market momentum. However, the Stochastic RSI produced a bearish crossover signal to indicate that the buying pressure may be fading.
XRP/BTC – Ripple Rebounds From April Lows
Against Bitcoin, XRP suffered greatly toward the end of April as it dropped as low as 2400 SAT. The coin managed to find support at 2455 SAT and has since rebounded from here to trade at 2500 SAT.
The cryptocurrency has a long way to recover in May and still faces resistance at a long term falling trend line, which will be tough to overcome.
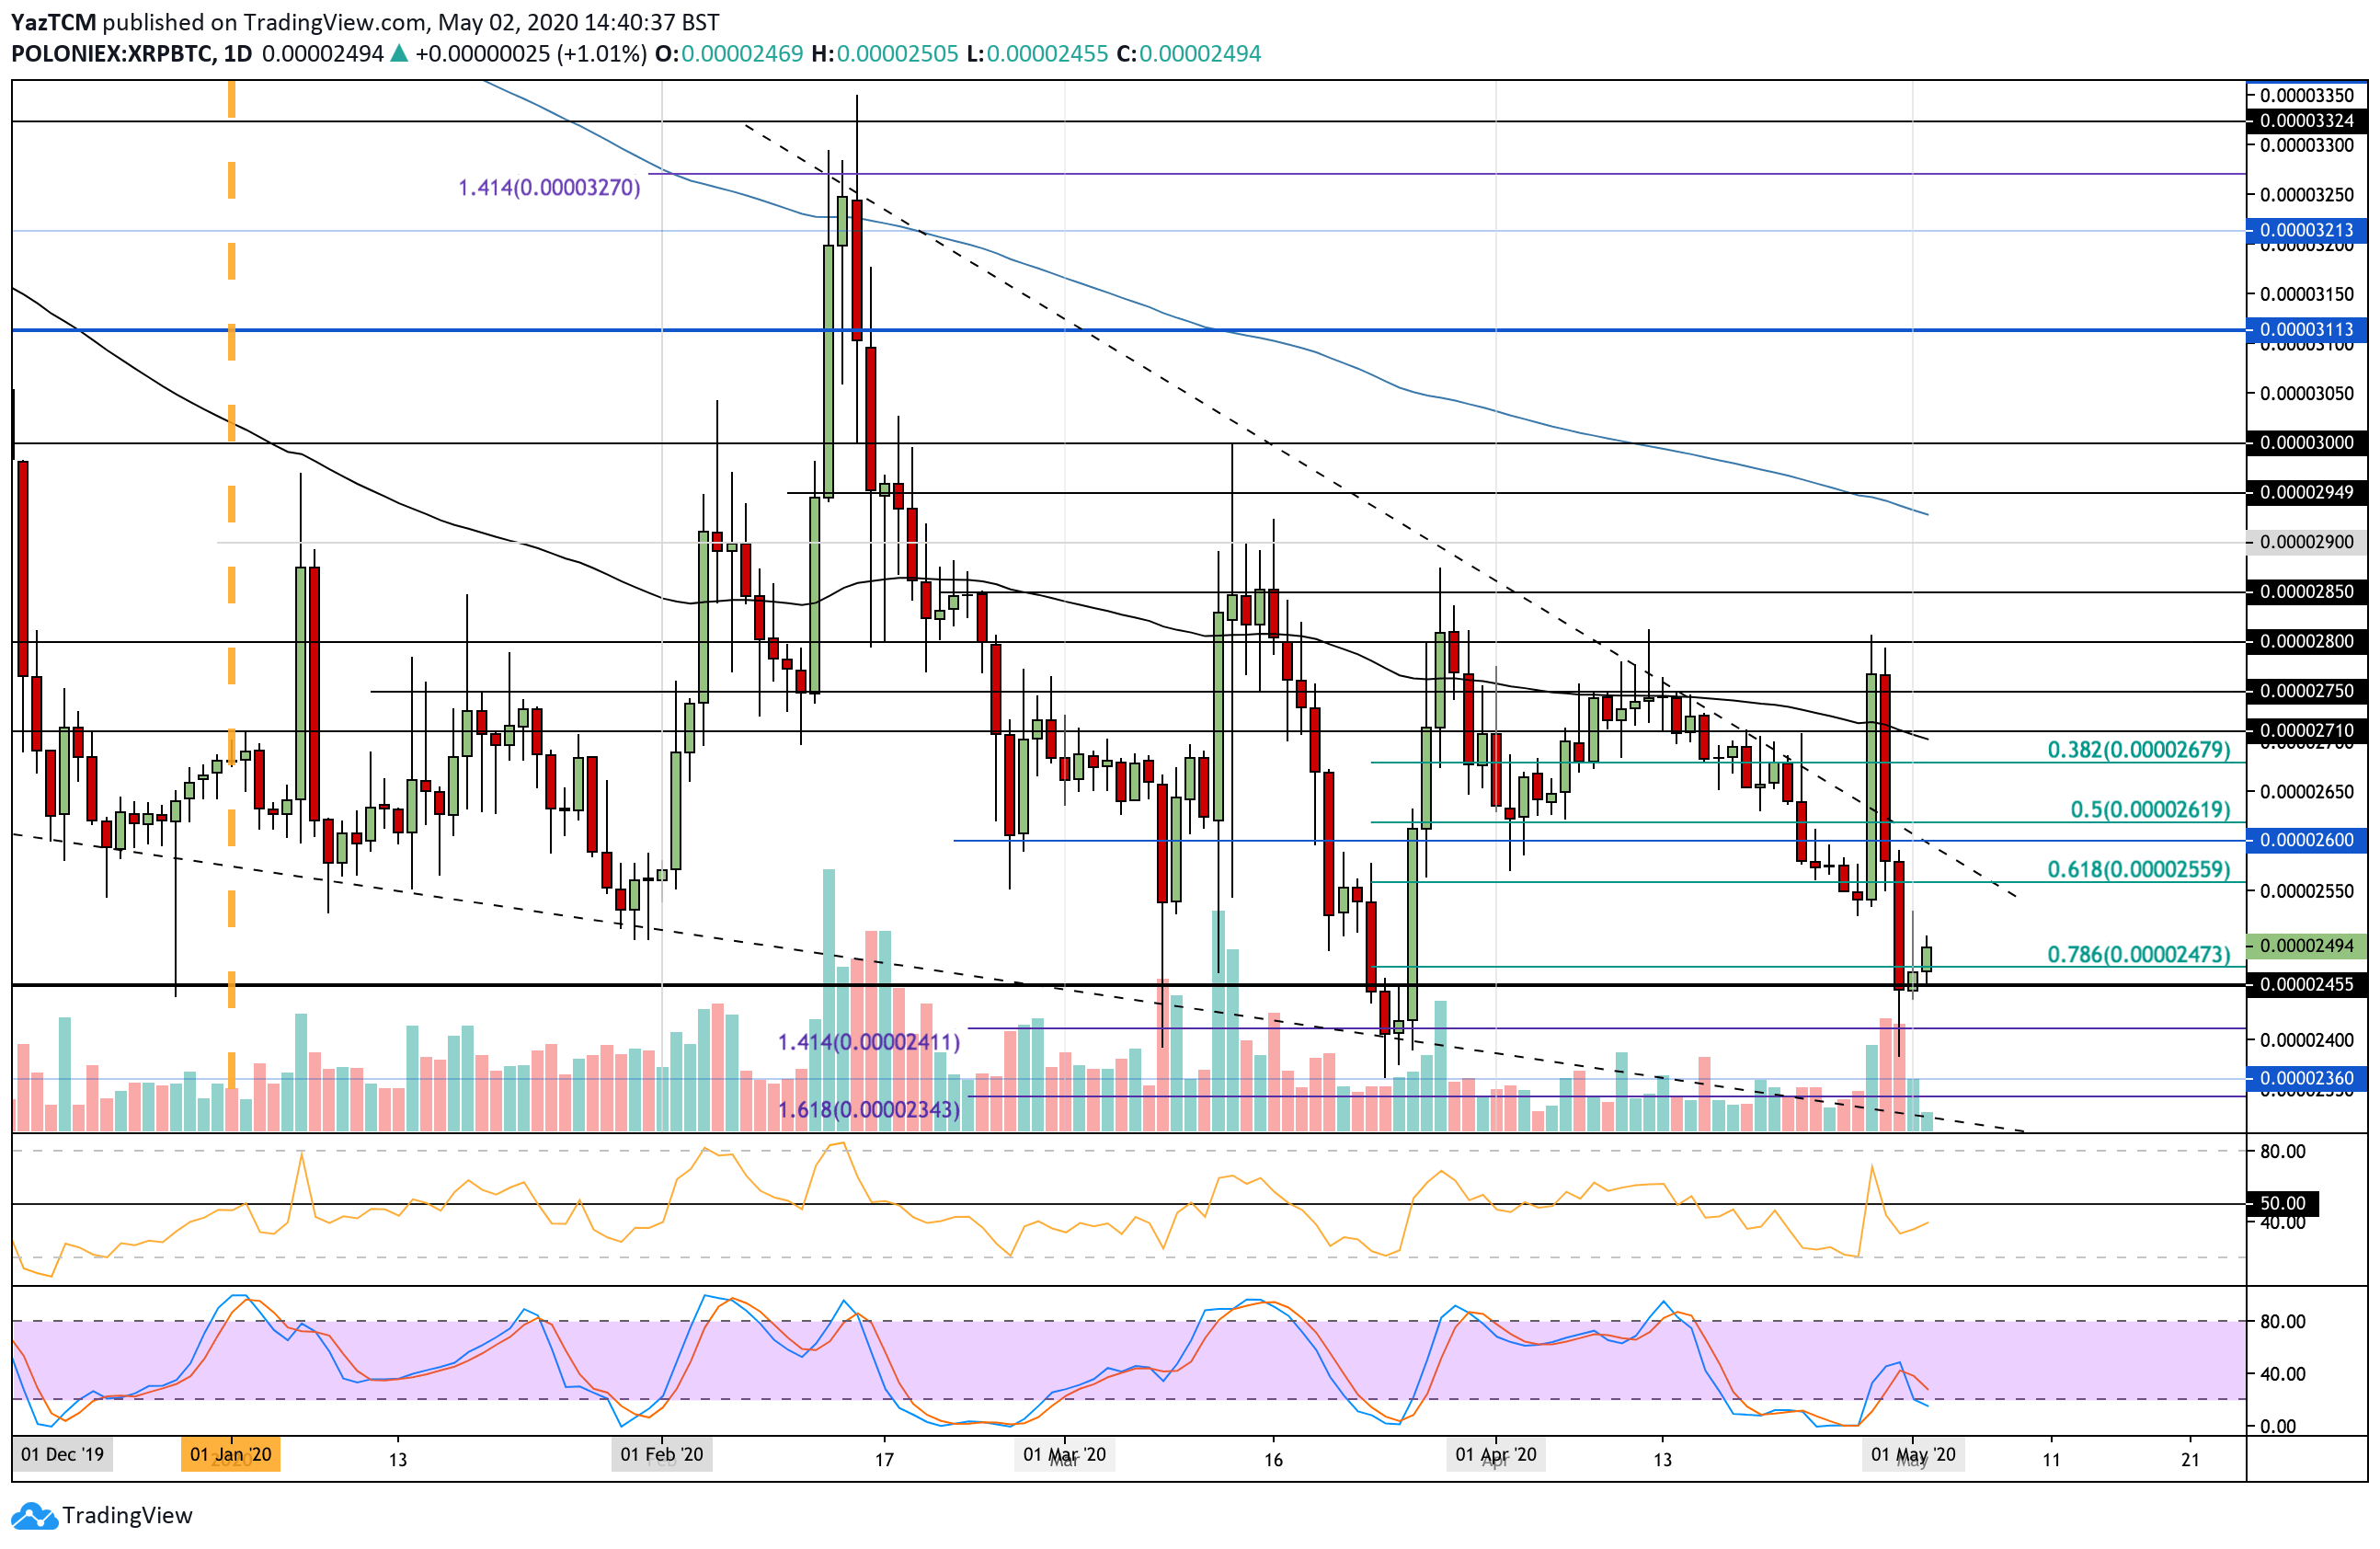
XRP-BTC Short Term Price Prediction
If the bulls push higher from 2500 SAT, resistance is located at 2550 SAT and then the falling trend line. Above this, resistance lies at 2600 SAT, 2680 SAT, and 2700 SAT (100-days EMA).
Toward the downside, the first level of support lies at 2455 SAT. Beneath this, support lies at 2400 SAT and 2360 SAT.
The RSI is beneath 50 as the sellers control the market momentum. However, it is rising, which shows that the bearish momentum is fading. It still needs to break above 50 for any hope of recovery.