XRP dropped by a small 1% today as the coin continues to struggle to find ground above %excerpt%.2.The cryptocurrency continues to consolidate in the descending triangle formation as it approaches the apex.Against Bitcoin, XRP dropped by a nasty 3% today, which could be a sign that XRP/USD might fall out of the triangle soon.Key Support & Resistance LevelsXRP/USD:Support: %excerpt%.192, %excerpt%.18, %excerpt%.175.Resistance: %excerpt%.207, %excerpt%.215, %excerpt%.225.XRP/BTC:Support: 2070 SAT, 2050 SAT, 2022 SAT.Resistance: 2100 SAT, 2200 SAT, 2250 SAT.XRP/USD – XRP Approaching Triangle ApexXRP has been trading within a descending triangle formation throughout the entire period of May 2020. Over the past few days, the coin has struggled to break above the %excerpt%.20 level and is constantly being rejected by the upper boundary of the tight
Topics:
Yaz Sheikh considers the following as important: Ripple (XRP) Price, XRP Analysis, xrpbtc, xrpusd
This could be interesting, too:
Jordan Lyanchev writes Ripple’s (XRP) Surge to Triggers Over Million in Short Liquidations
Jordan Lyanchev writes Trump Confirms Work on Strategic Crypto Reserve: XRP, ADA, SOL Included
Dimitar Dzhondzhorov writes Is a Major Ripple v. SEC Lawsuit Development Expected This Week? Here’s Why
Mandy Williams writes Ripple Releases Institutional DeFi Roadmap for XRP Ledger in 2025
- XRP dropped by a small 1% today as the coin continues to struggle to find ground above $0.2.
- The cryptocurrency continues to consolidate in the descending triangle formation as it approaches the apex.
- Against Bitcoin, XRP dropped by a nasty 3% today, which could be a sign that XRP/USD might fall out of the triangle soon.
Key Support & Resistance Levels
XRP/USD:
Support: $0.192, $0.18, $0.175.
Resistance: $0.207, $0.215, $0.225.
XRP/BTC:
Support: 2070 SAT, 2050 SAT, 2022 SAT.
Resistance: 2100 SAT, 2200 SAT, 2250 SAT.
XRP/USD – XRP Approaching Triangle Apex
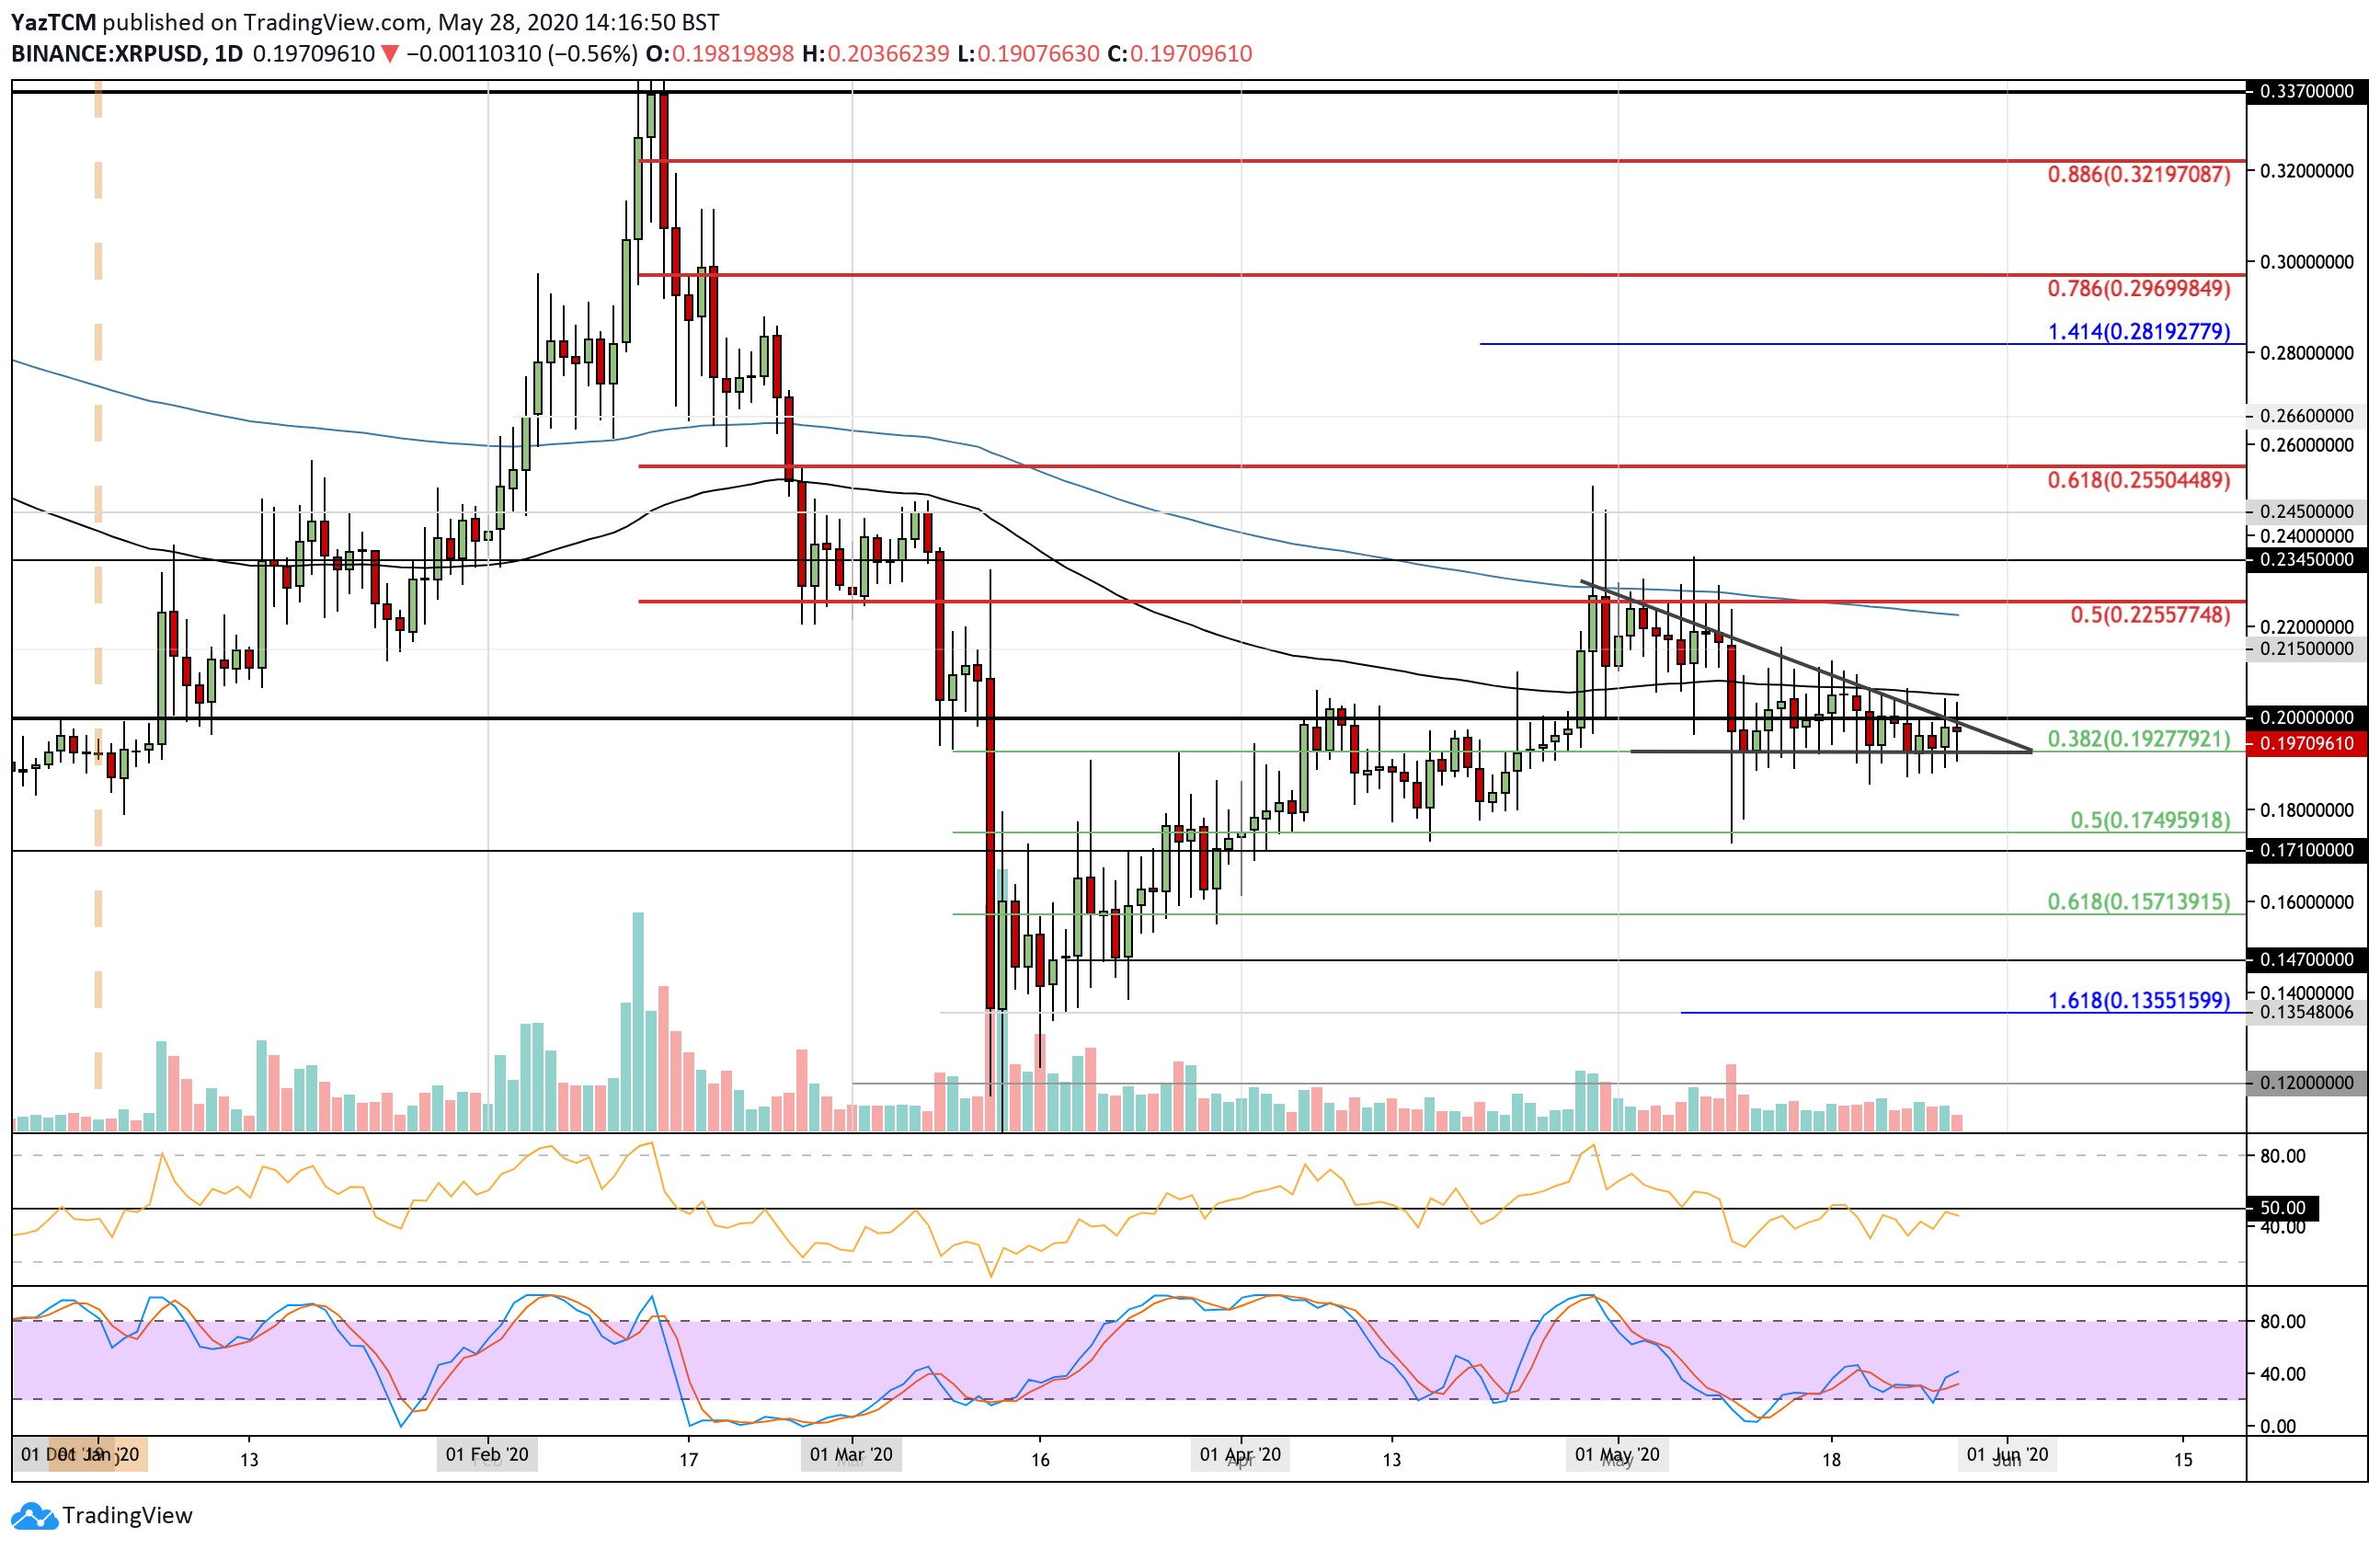
XRP has been trading within a descending triangle formation throughout the entire period of May 2020. Over the past few days, the coin has struggled to break above the $0.20 level and is constantly being rejected by the upper boundary of the tight triangle.
The apex is quickly approaching, and, typically, a breakout happens before the apex is reached. This means we could expect a breakout in either direction pretty soon. However, the way things look for XRP/BTC, all indicators point to a downside break.

XRP-USD Short Term Price Prediction
If the sellers do push lower, the first level of support lies at the lower boundary of the triangle at $0.192 (.382 Fib Retracement). Beneath this, support is located at $0.18, $0.175 (.5 Fib Retracement), and $0.171. Additional support can be expected at $0.157 (.618 Fib Retracement).
On the other side, the first level of resistance lies at $0.20, which is also the upper boundary of the triangle. Above this, resistance lies at $0.206 (100-day EMA), $0.215, and $0.225 (200-day EMA & bearish .5 Fib Retracement). Added resistance is located at $0.245 and $0.255.
The RSI is struggling to climb above the 50 line as the bears continue to control the market momentum. For a positive triangle breakout, the RSI will have to break above 50.
XRP/BTC – Is XRP About To Create Fresh Multi-Year Lows Against BTC?
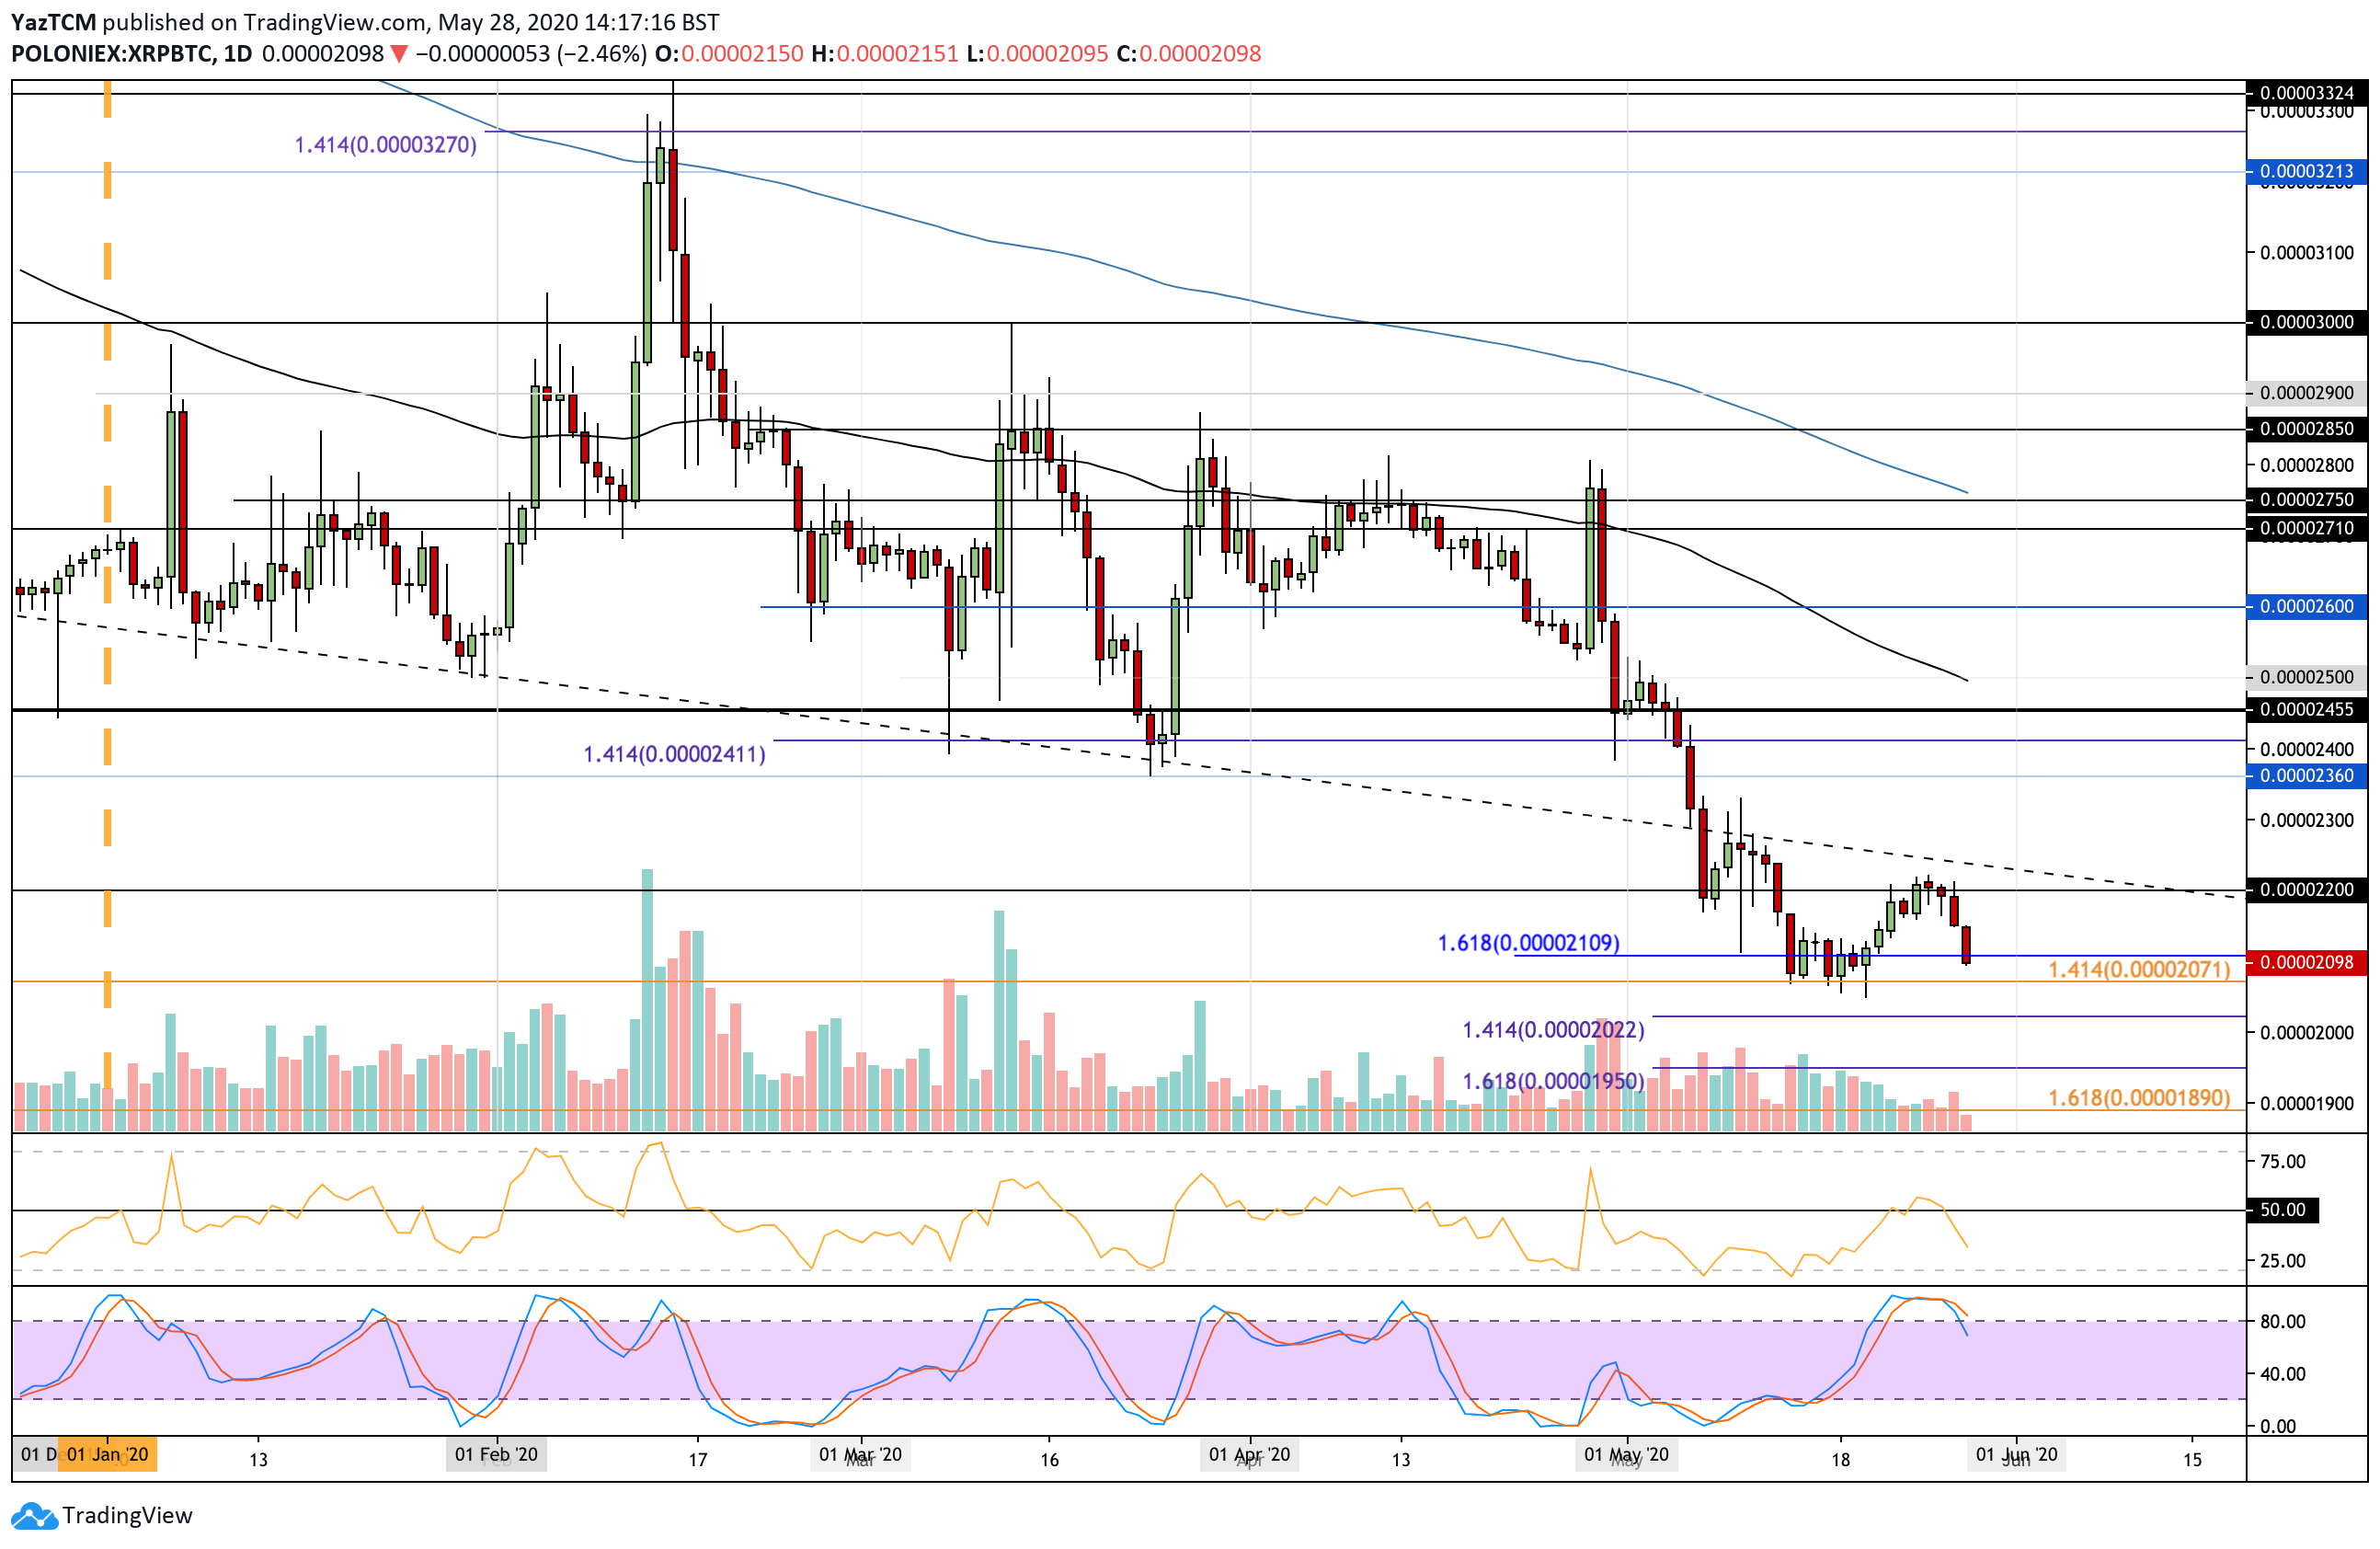
Against Bitcoin, XRP has taken a turn for the worse after failing to capitalize above 2200 SAT. The coin has fallen from here as it breaks beneath 2100 SAT today.
XRP previously created fresh multi-year lows this month as it reached the 2071 SAT level. However, this increased selling momentum could suggest that XRP might see even further lows beneath this.

XRP-BTC Short Term Price Prediction
If the sellers continue to push lower, the first level of support lies at 2071 SAT. This level had provided strong support for the market during May 2020. Beneath this, support is expected at 2050 SAT, 2022 SAT (downside 1.414 Fib Extension), 2000 SAT, and 1950 SAT.
Alternatively, if the buyers can defend 2071 SAT and push higher, resistance lies at 2100 SAT, 2200 SAT, and 2250 SAT.
The RSI took a nosedive beneath the 50 line as the selling momentum starts to take hold. Additionally, the Stochastic RSI produced a bearish crossover signal to signal that the selling pressure is increasing.
