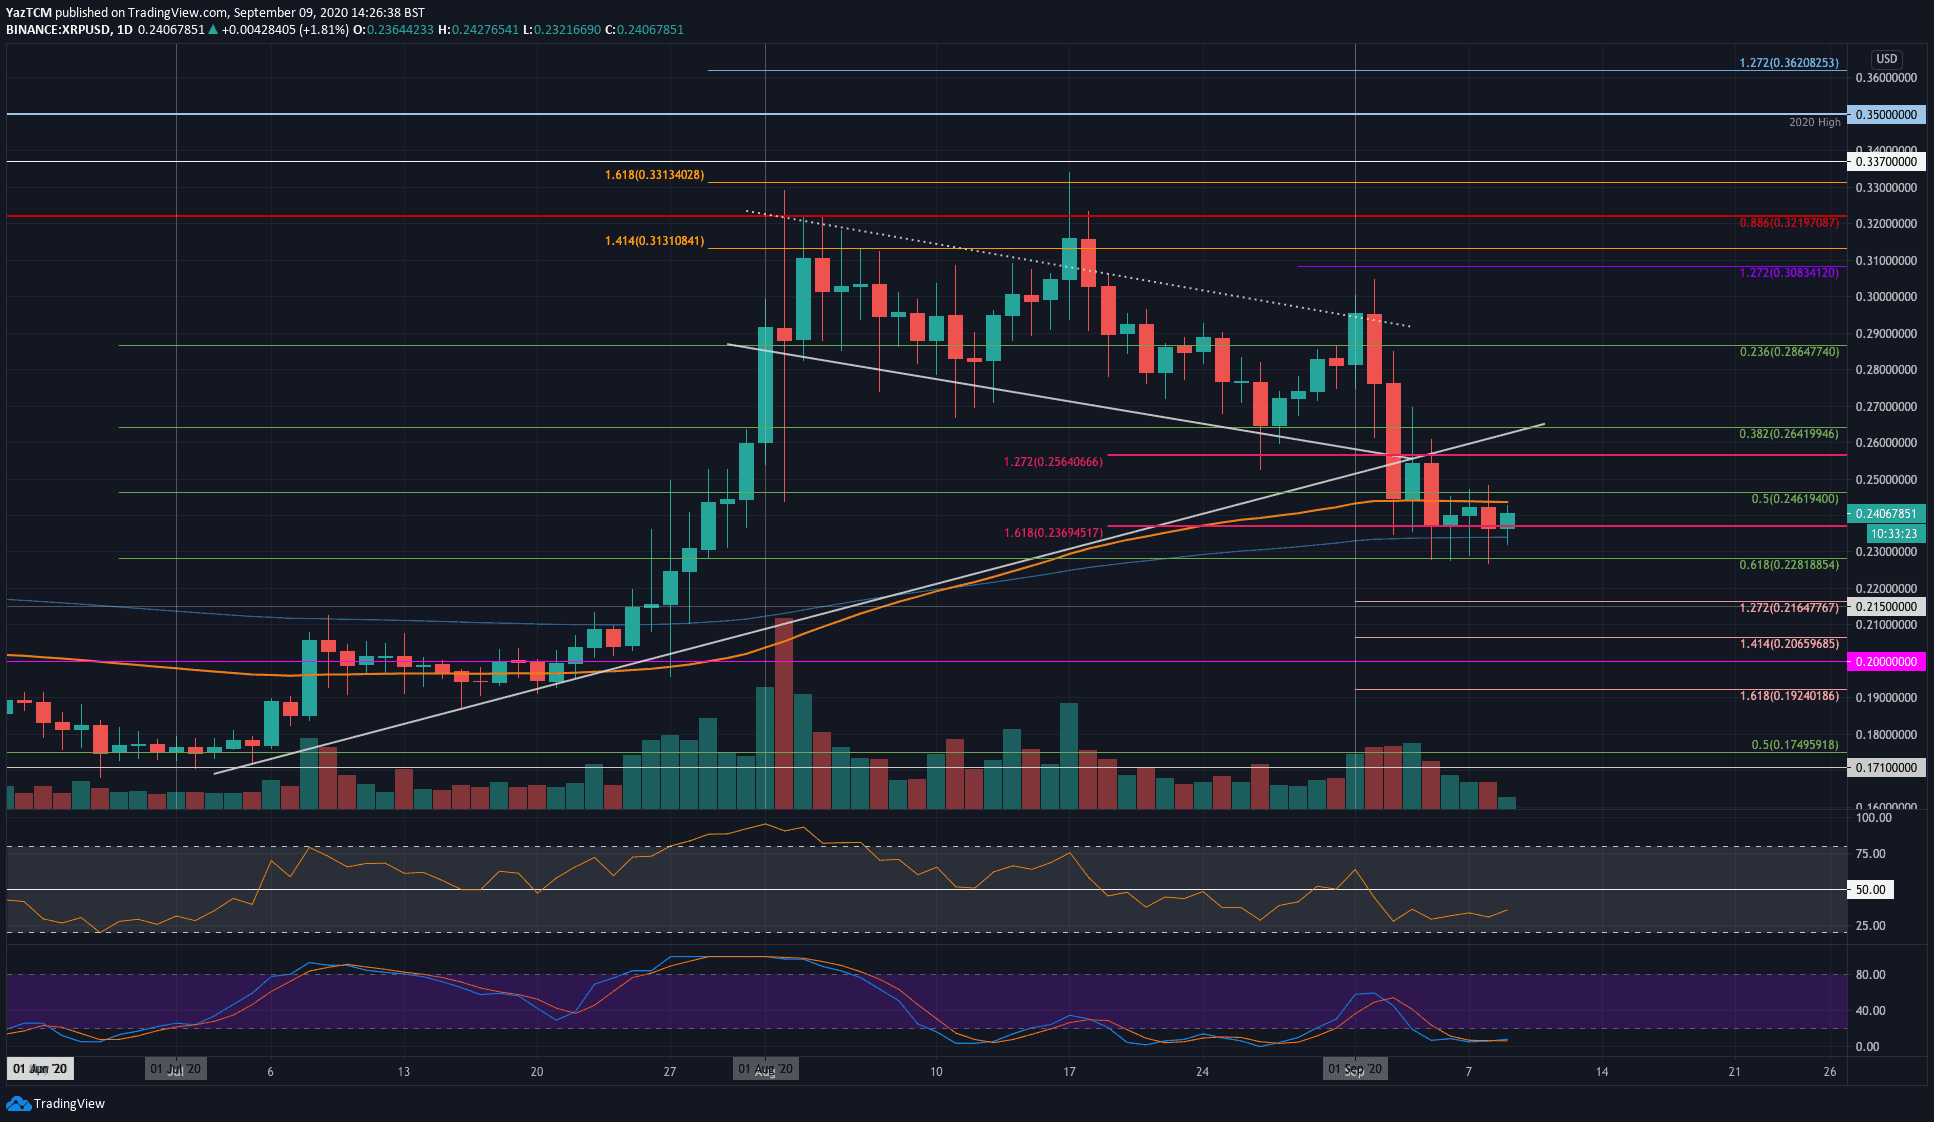
XRP saw a small 2.5% price increase today as the support at %excerpt%.236 continues to hold firm.The coin is trapped between %excerpt%.228 and %excerpt%.236 for the past 4-days of trading.Against Bitcoin, the 100-days EMA continues to show its strength as the bears fail to close beneath it.XRP/USD – Bulls Vehemently Defend %excerpt%.236 Support.Key Support Levels: %excerpt%.236, %excerpt%.22, %excerpt%.216.Key Resistance Levels: %excerpt%.244, %excerpt%.25, %excerpt%.264.After dropping from %excerpt%.3 earlier in the month, the bulls managed to defend the support at %excerpt%.236 for the last four days straight. The support here is provided by a downside 1.618 Fib Extension, and the market has spiked beneath it but the buyers have closed each daily candle above the level.During its downturn, XRP found support at %excerpt%.228 (.618 Fib Retracement) and bounced higher to close
Topics:
Yaz Sheikh considers the following as important: Ripple (XRP) Price, XRP Analysis, xrpbtc, xrpusd
This could be interesting, too:
Jordan Lyanchev writes Ripple’s (XRP) Surge to Triggers Over Million in Short Liquidations
Jordan Lyanchev writes Trump Confirms Work on Strategic Crypto Reserve: XRP, ADA, SOL Included
Dimitar Dzhondzhorov writes Is a Major Ripple v. SEC Lawsuit Development Expected This Week? Here’s Why
Mandy Williams writes Ripple Releases Institutional DeFi Roadmap for XRP Ledger in 2025
- XRP saw a small 2.5% price increase today as the support at $0.236 continues to hold firm.
- The coin is trapped between $0.228 and $0.236 for the past 4-days of trading.
- Against Bitcoin, the 100-days EMA continues to show its strength as the bears fail to close beneath it.
XRP/USD – Bulls Vehemently Defend $0.236 Support.
Key Support Levels: $0.236, $0.22, $0.216.
Key Resistance Levels: $0.244, $0.25, $0.264.
After dropping from $0.3 earlier in the month, the bulls managed to defend the support at $0.236 for the last four days straight. The support here is provided by a downside 1.618 Fib Extension, and the market has spiked beneath it but the buyers have closed each daily candle above the level.
During its downturn, XRP found support at $0.228 (.618 Fib Retracement) and bounced higher to close above $0.236. The coin has now been trapped within a range between $0.246 and $0.228 for the past four days. It must break this current range to dictate the next direction for XRP.
XRP-USD Short Term Price Prediction
If the sellers break beneath $0.236, the first level of support lies at $0.228 (.618 Fib). Beneath this, support lies at $0.22, $0.216 (downside 1.272 Fib Extension), and $0.206 (downside 1.414 Fib Extension).
On the other side, the first level of resistance lies at $0.244 (100-days EMA). This is followed by resistance at $0.25, $0.264, and $0.27.
The RSI is starting to make its way back toward the mid-line, which shows that the bearish momentum is starting to fade. Additionally, the Stochastic RSI is primed for a bullish crossover signal that could send the market higher when it appears.
XRP/BTC – Bulls Bravely Defend 100-days EMA
Key Support Levels: 2315 SAT, 2275 SAT, 2230 SAT.
Key Resistance Levels: 2400 SAT, 2450 SAT, 2500 SAT.
Against Bitcoin, the bulls have managed to defend the 100-days EMA over these past four days. There have been multiple spikes beneath the level, but the buyers always closed each daily candle above the 100-days EMA.
A .5 Fib retracement level bolsters the support here.
It is looking likely that the bulls might be able to regroup and push higher from the 100-days EMA. However, the volume will need to increase if this is going to happen.
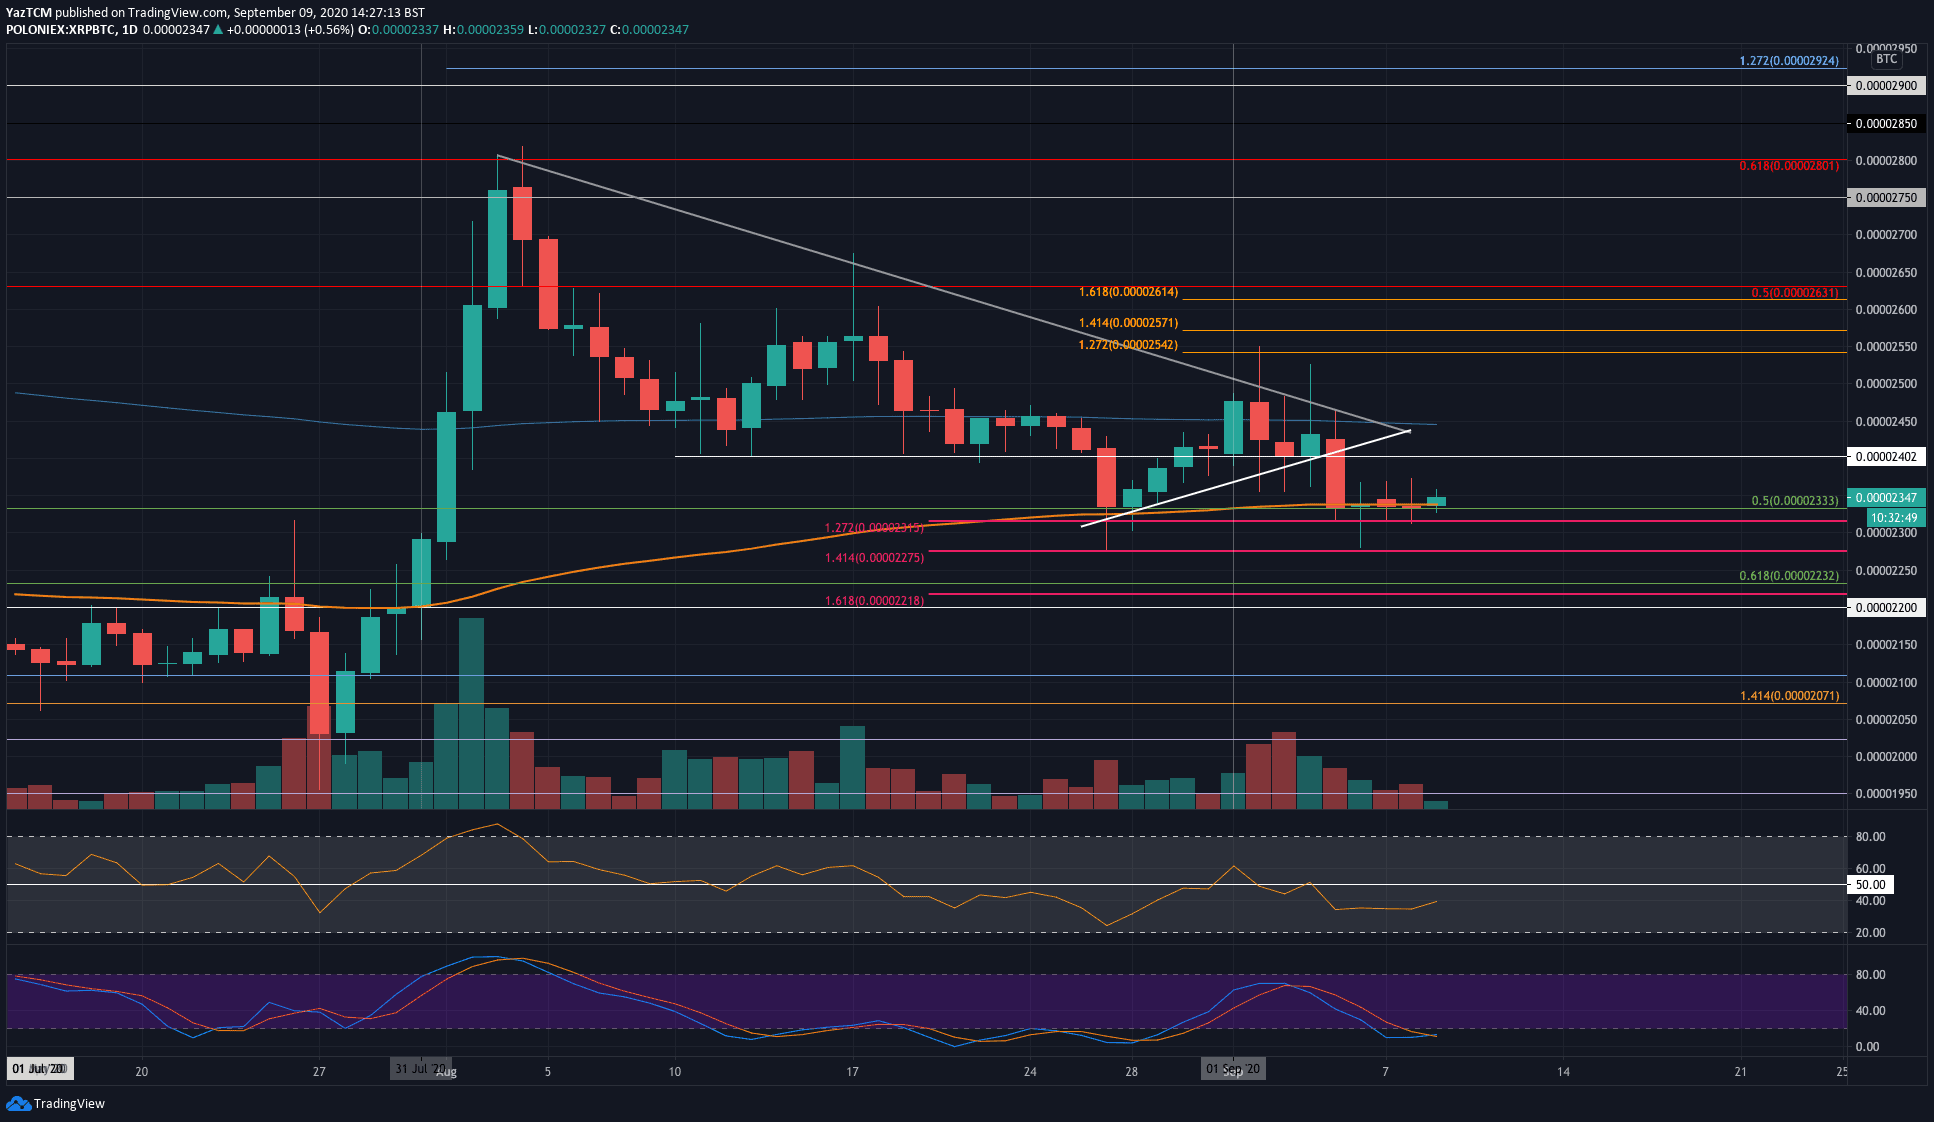
XRP-BTC Short Term Price Prediction
If the buyers push higher, the first level of strong resistance lies at 2400 SAT. This is followed by resistance at 2450 SAT (200-days EMA), 2500 SAT, and 2570 SAT (1.414 Fib Extension).
On the other side, if the sellers break beneath the 100-days EMA, the first level of support lies at 2315 SAT (downside 1.272 Fib Extension). Added support is found at 2275 SAT (downside 1.414 Fib Extension), 2230 SAT (.618 Fib Retracement), and 2200 SAT.
The Stochastic RSI is primed for a bullish crossover signal that could help to send the market higher.