XRP surged by 6% over the past 24 hours of trading as the coin finally breaches %excerpt%.20 and finds %excerpt%.22.The cryptocurrency was trapped beneath %excerpt%.20 for the past 6-weeks but finally broke this resistance yesterday.Against Bitcoin, XRP found support at 2525 SAT and rebounded to break the long term falling trend line.Key Support & Resistance LevelsXRP/USD:Support: %excerpt%.217, %excerpt%.21, %excerpt%.208.Resistance: %excerpt%.228, %excerpt%.24, %excerpt%.245.XRP/BTC:Support: 2700 SAT, 2680 SAT, 2620 SAT.Resistance: 2750 SAT, 2800 SAT, 2850 SAT.XRP/USD – Ripple Finally Breaks %excerpt%.20.XRP finally managed to break the strong resistance at %excerpt%.20 yesterday after being trapped by the level for the past six weeks of trading. The cryptocurrency had found support at %excerpt%.18 earlier last week, which allowed XRP to slowly grind higher toward %excerpt%.20
Topics:
Yaz Sheikh considers the following as important: Ripple (XRP) Price, XRP Analysis, xrpbtc, xrpusd
This could be interesting, too:
Jordan Lyanchev writes Ripple’s (XRP) Surge to Triggers Over Million in Short Liquidations
Jordan Lyanchev writes Trump Confirms Work on Strategic Crypto Reserve: XRP, ADA, SOL Included
Dimitar Dzhondzhorov writes Is a Major Ripple v. SEC Lawsuit Development Expected This Week? Here’s Why
Mandy Williams writes Ripple Releases Institutional DeFi Roadmap for XRP Ledger in 2025
- XRP surged by 6% over the past 24 hours of trading as the coin finally breaches $0.20 and finds $0.22.
- The cryptocurrency was trapped beneath $0.20 for the past 6-weeks but finally broke this resistance yesterday.
- Against Bitcoin, XRP found support at 2525 SAT and rebounded to break the long term falling trend line.
Key Support & Resistance Levels
XRP/USD:
Support: $0.217, $0.21, $0.208.
Resistance: $0.228, $0.24, $0.245.
XRP/BTC:
Support: 2700 SAT, 2680 SAT, 2620 SAT.
Resistance: 2750 SAT, 2800 SAT, 2850 SAT.
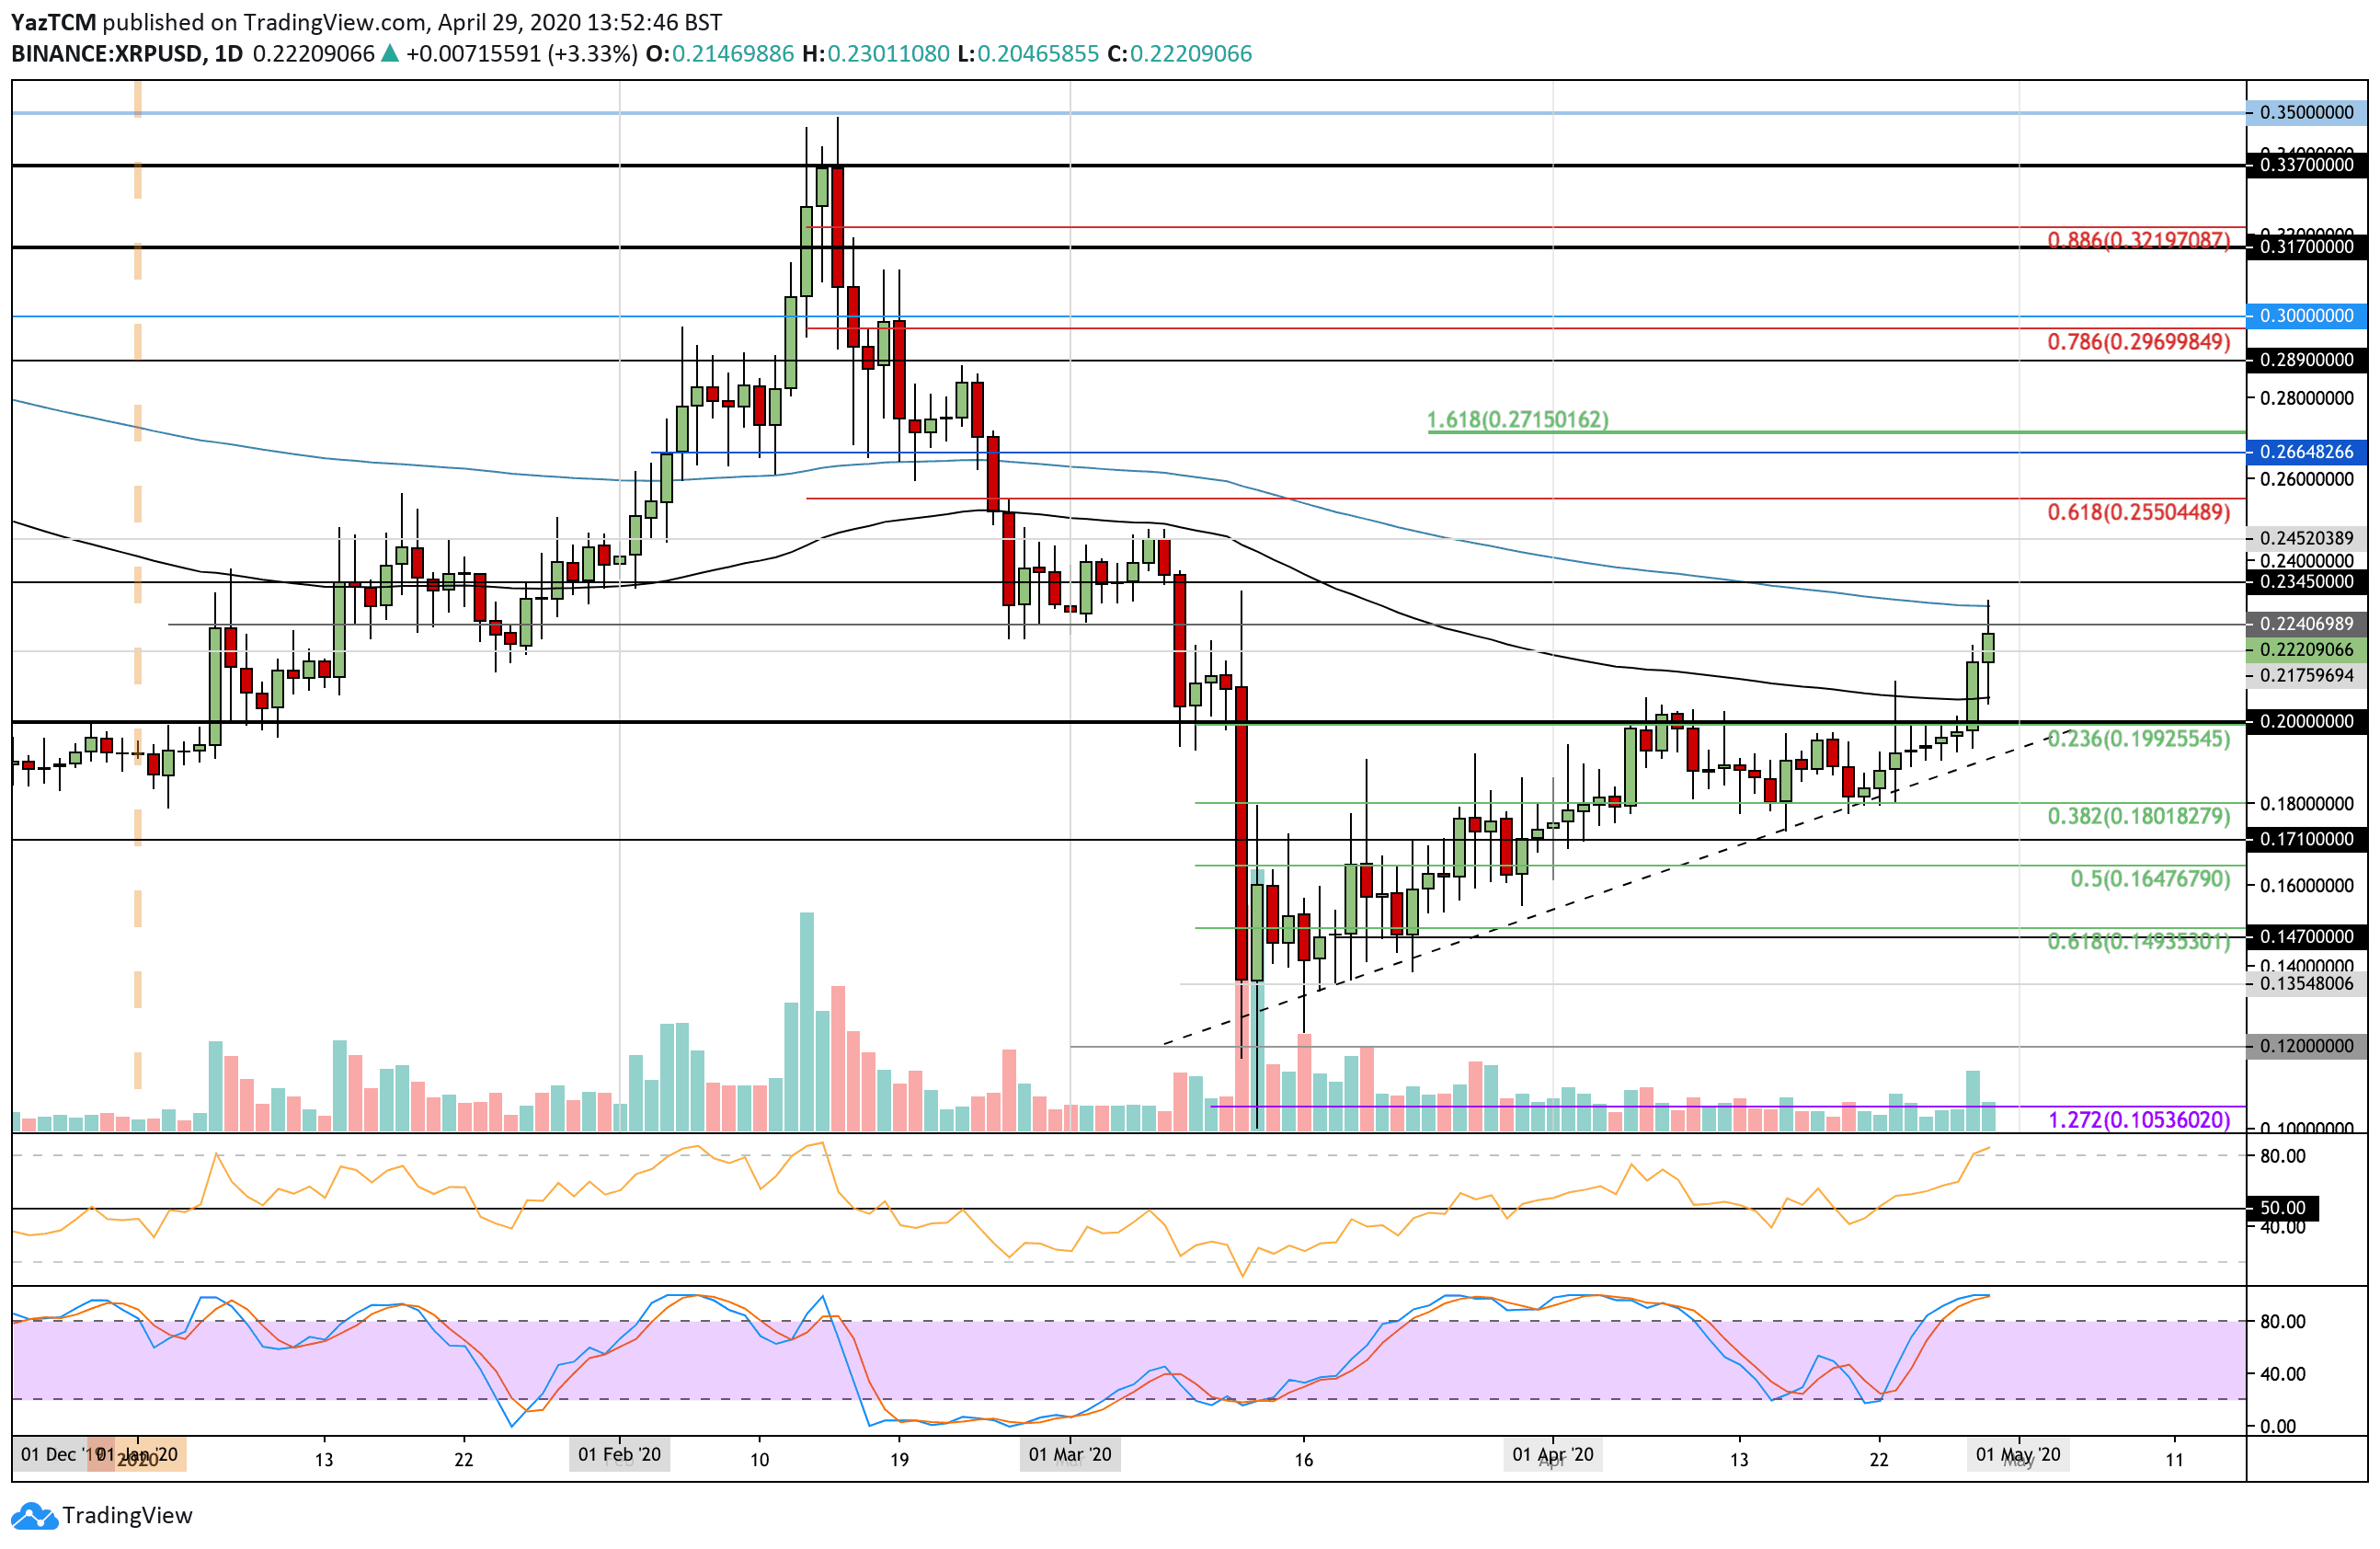
XRP/USD – Ripple Finally Breaks $0.20.
XRP finally managed to break the strong resistance at $0.20 yesterday after being trapped by the level for the past six weeks of trading. The cryptocurrency had found support at $0.18 earlier last week, which allowed XRP to slowly grind higher toward $0.20 for the week.
After breaking $0.20, XRP went on to surge past the 100-days EMA as it broke resistance at $0.22 to reach the 200-days EMA at $0.228 before falling back to $0.222.
The break above $0.20 now puts XRP in a bullish market condition.
XRP-USD Short Term Price Prediction
If the buyers continue to drive XRP higher, they will first need to re-test resistance at $0.228 (200-days EMA). Above this, resistance lies at $0.24, $0.245, and $0.255 (bearish .618 Fib Retracement). Added resistance lies at $0.26 and $0.271 (1.618 Fib Extension).
If the sellers push lower, support can be found at $0.217, $0.21, $0.208 (100-days EMA), and $0.20.
The RSI is now in extremely overbought conditions, which suggest that the buyers might be a little overstretched. Additionally, the Stochastic RSI is overbought, and a bearish crossover signal is likely to push XRP lower in the short term.
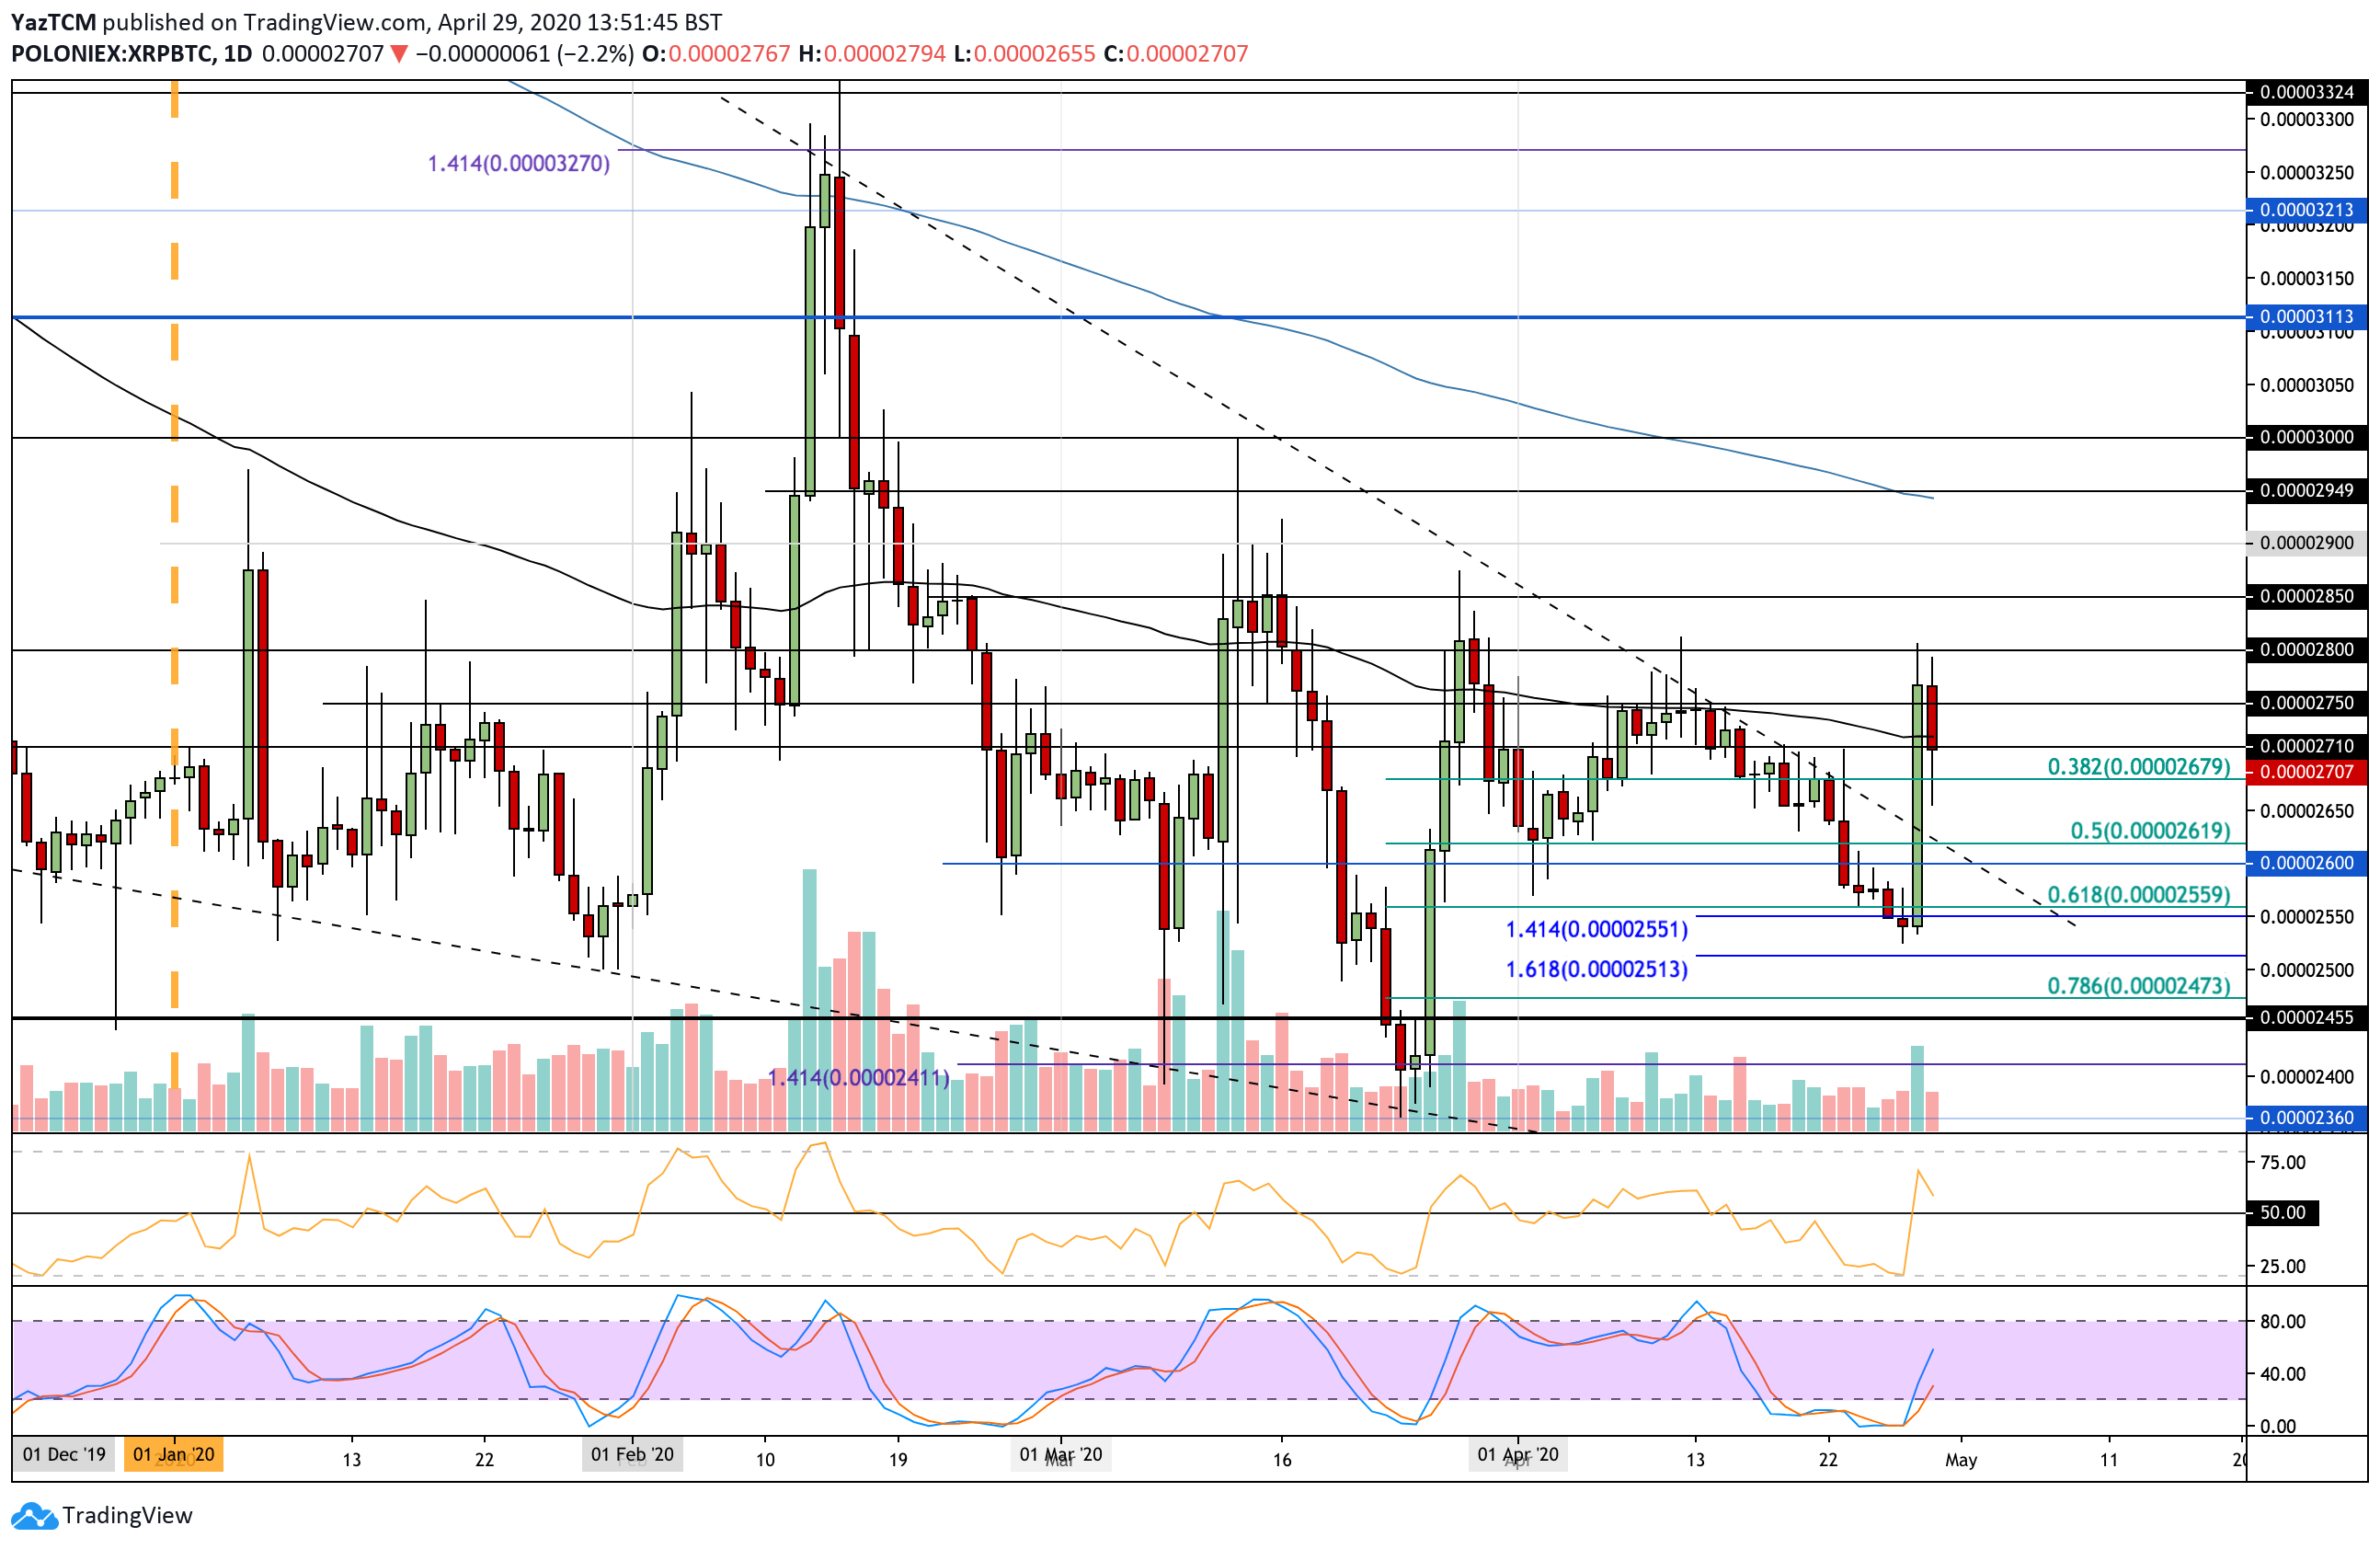
XRP/BTC – Ripple Breaks Long Term Falling Trend Line
Against Bitcoin, XRP was falling throughout April as it struggled to break above a falling trend line that has been in action since mid-February 2020. The coin continued to fall throughout the month until recently, finding support at the 2525 SAT level, where it managed to rebound yesterday.
After rebounding, XRP went on to explode as it broke past the falling trend line and increased as high as 2800 SAT. It has since dropped slightly as it trades at 2710 SAT (100-days EMA).
XRP-BTC Short Term Price Prediction
If the buyers rebound from 2710 SAT and push higher, there will be resistance at 2750 SAT and 2800 SAT. Above this, resistance is located at 2850 SAT, 2900 SAT, and 2950 SAT (200-days EMA).
On the other side, if the sellers push beneath 2700 SAT, support is found at 2680 SAT, 2620 SAT, and 2600 SAT.
The RSI also managed to break above 50 to show that the buyers control the market momentum. So long as it remains above the 50 line, the XRP bulls will remain in charge. Furthermore, the Stochastic RSI produced a bullish crossover signal in the oversold territory to show the bullish pressure is rising.