XRP witnessed a 10.7% surge in price over the past 24 hours as it breaks above the 200-days EMA to reach %excerpt%.277.XRP climbed above the 100-days EM, finding resistance at 3000 SAT against Bitcoin.The latest price hike could be attributed to BitMEX adding the XRP/USD perpetual contract to their platform.Key Support & Resistance LevelsXRP/USDSupport: %excerpt%.262, %excerpt%.255, %excerpt%.245.Resistance: %excerpt%.28, %excerpt%.289, %excerpt%.30.XRP/BTC:Support: 2900 SAT, 2850 SAT, 2710 SAT.Resistance: 3115 SAT, 3255 SAT, 3376 SAT.XRP/USD: XRP Climbs To Upper Boundary Of Ascending Price ChannelSince our last analysis, the cryptocurrency surged above the 200-days EMA. It continued to climb higher until meeting resistance at the upper boundary of the ascending price channel at around %excerpt%.28.This latest price increase could be
Topics:
Yaz Sheikh considers the following as important: Ripple (XRP) Price, XRP Analysis
This could be interesting, too:
Jordan Lyanchev writes Ripple’s (XRP) Surge to Triggers Over Million in Short Liquidations
Jordan Lyanchev writes Trump Confirms Work on Strategic Crypto Reserve: XRP, ADA, SOL Included
Mandy Williams writes Ripple Releases Institutional DeFi Roadmap for XRP Ledger in 2025
Jordan Lyanchev writes ChatGPT and DeepSeek Analyze Ripple’s (XRP) Price Potential for 2025
- XRP witnessed a 10.7% surge in price over the past 24 hours as it breaks above the 200-days EMA to reach $0.277.
- XRP climbed above the 100-days EM, finding resistance at 3000 SAT against Bitcoin.
- The latest price hike could be attributed to BitMEX adding the XRP/USD perpetual contract to their platform.
Key Support & Resistance Levels
XRP/USD
Support: $0.262, $0.255, $0.245.
Resistance: $0.28, $0.289, $0.30.
XRP/BTC:
Support: 2900 SAT, 2850 SAT, 2710 SAT.
Resistance: 3115 SAT, 3255 SAT, 3376 SAT.
XRP/USD: XRP Climbs To Upper Boundary Of Ascending Price Channel
Since our last analysis, the cryptocurrency surged above the 200-days EMA. It continued to climb higher until meeting resistance at the upper boundary of the ascending price channel at around $0.28.
This latest price increase could be attributed to the fact that the XRP/USD perpetual contract has finally been added to the BitMEX margin trading exchange. Previously, users could only trade XRP against Bitcoin, but now they have the opportunity to do so against the USD as well.
The ascending price channel has been in play for around 6-weeks and it will be difficult for XRP to climb above the upper boundary. However, if it does break above, the cryptocurrency should rocket toward the $0.30 level.
At this moment, XRP remains strongly bullish. If it was to drop beneath the $0.25 it would turn neutral with only a further break beneath the ascending price channel turning it bearish.
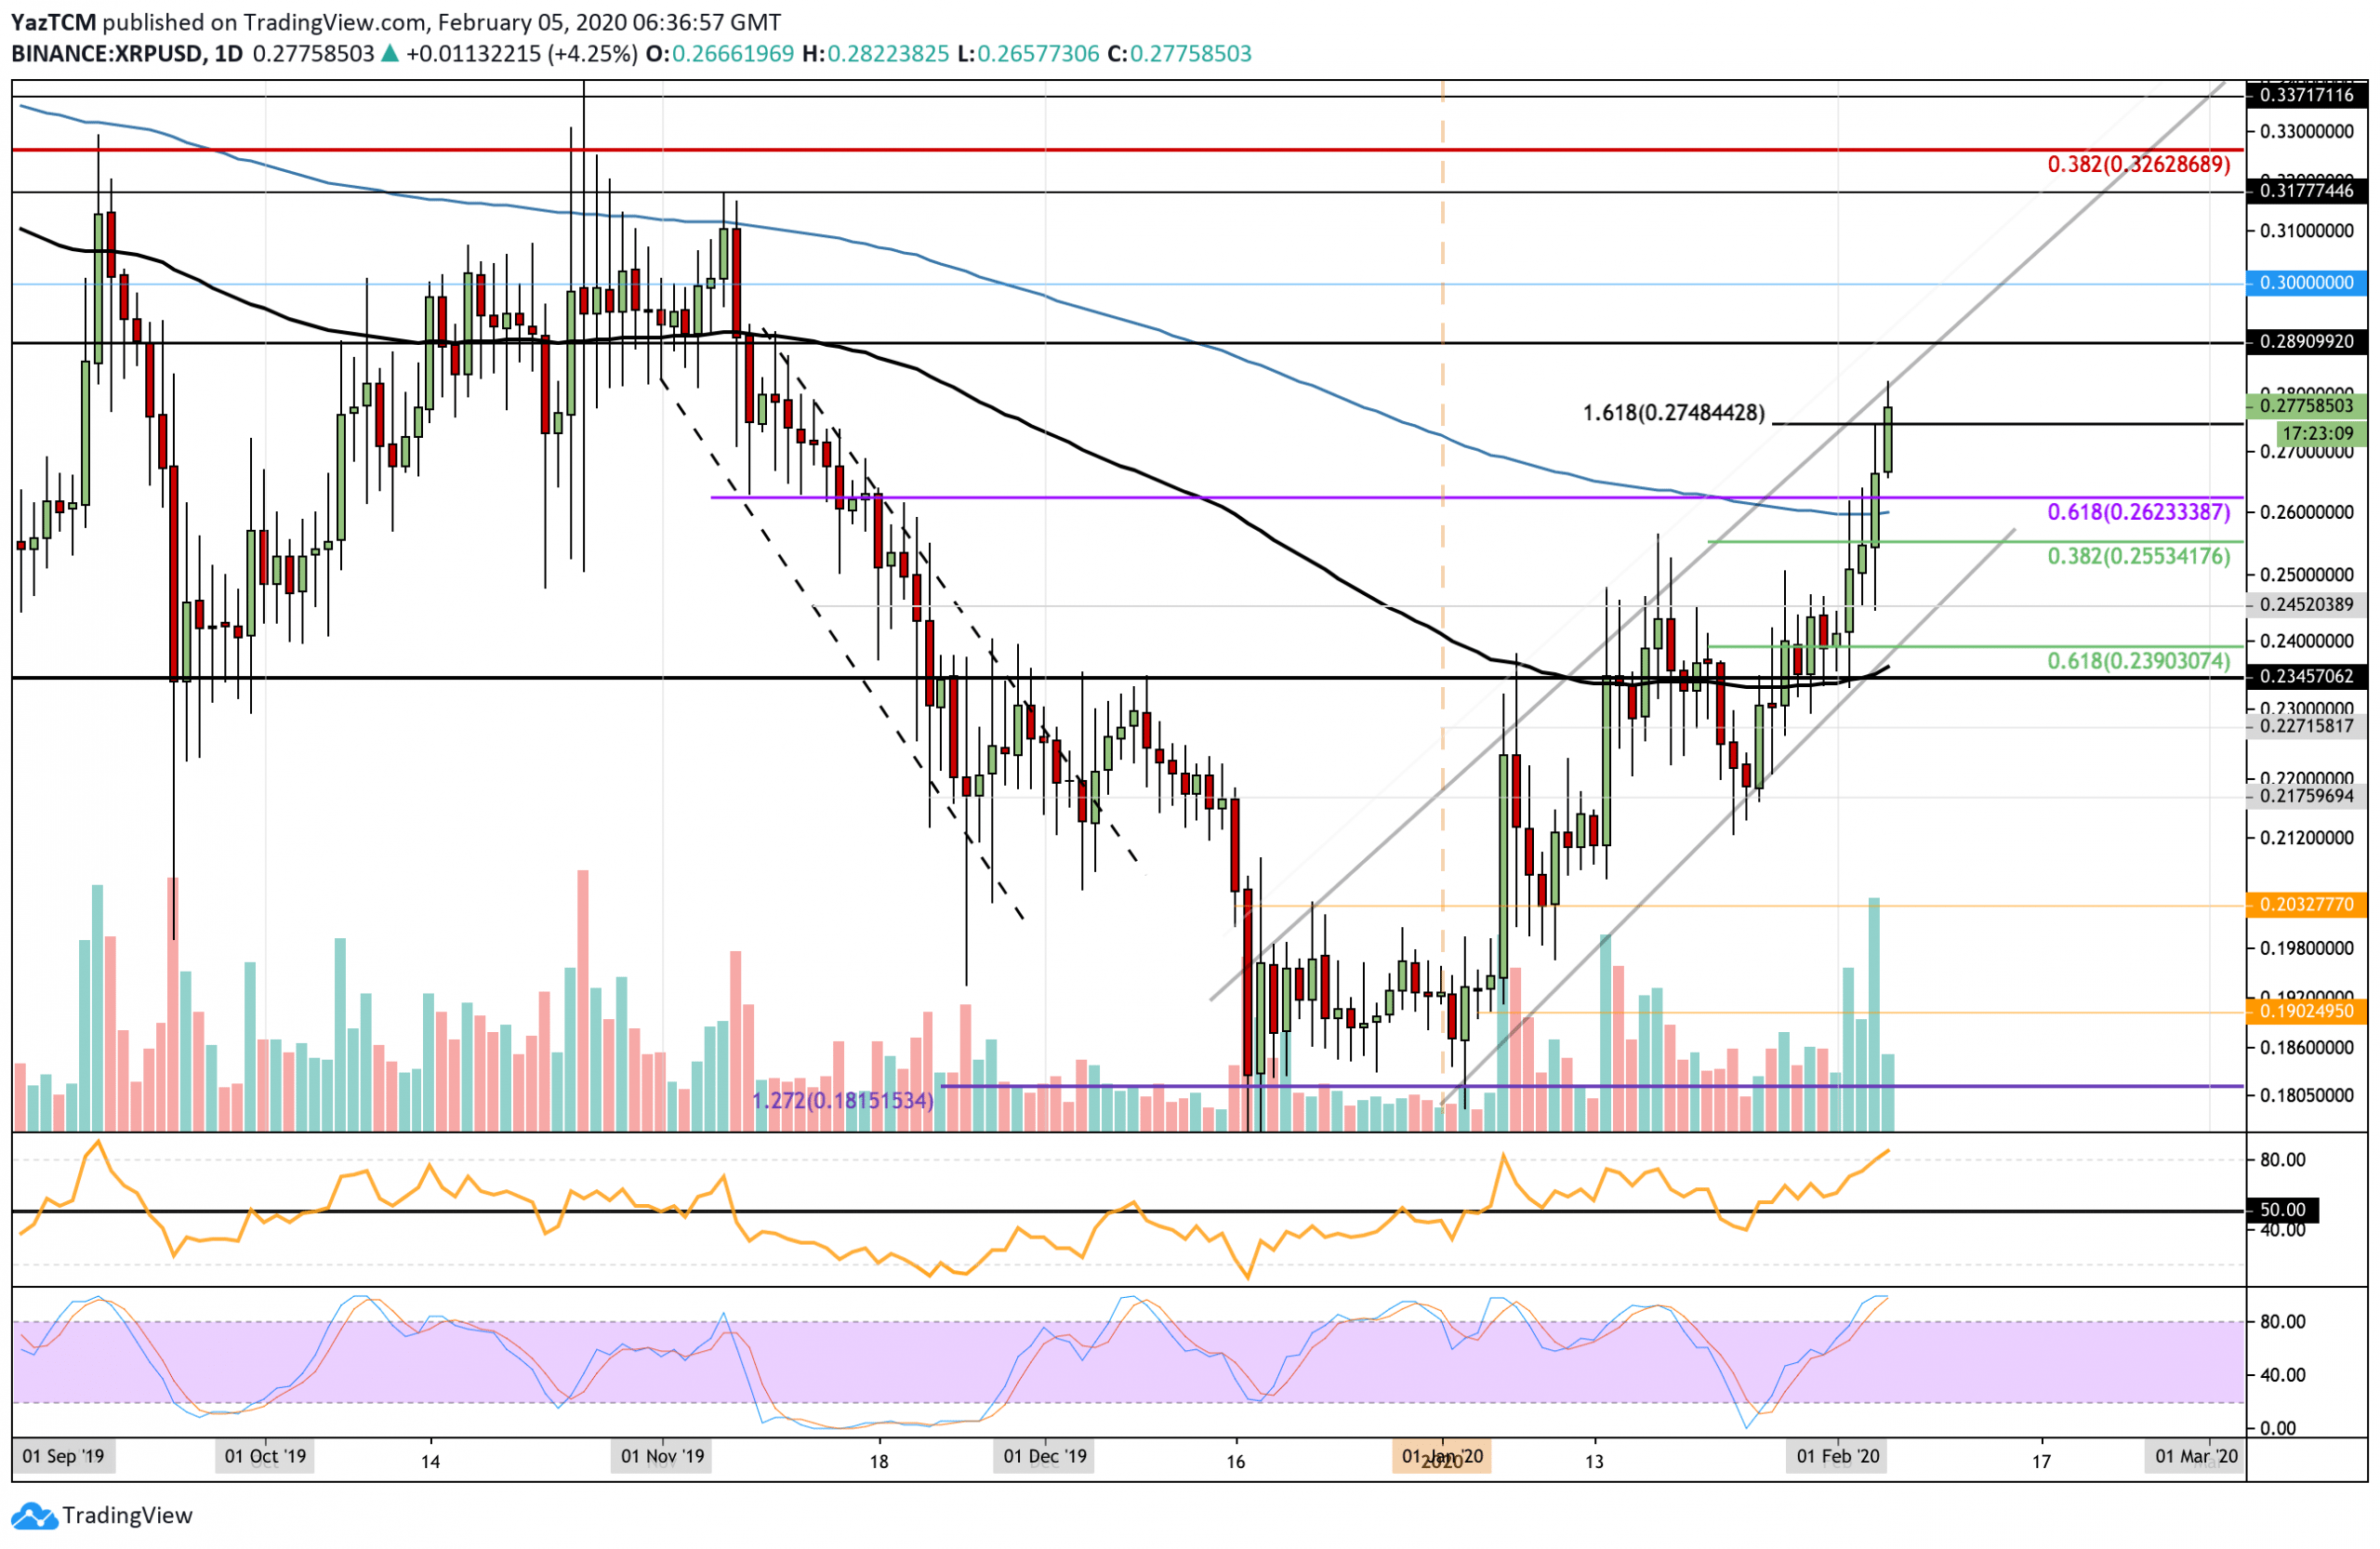
XRP Short Term Price Prediction
If the buyers continue to push the price above $0.28 (and the ascending price channel) the next level of resistance lies at $0.289. Above $0.29, resistance lies at $0.30, $0.317, and $0.326 (bearish .382 Fib Retracement).
Alternatively, if the sellers push XRP beneath $0.275, support is expected at $0.262. Beneath this, additional support lies at $0.255, $0.245, and $0.239.
The RSI has risen into overbought conditions. Furthermore, the Stochastic RSI is primed for a bearish crossover signal. Both of these signals should warn traders to be cautious about entering into any new positions at this moment as the market may be a little overstretched.
XRP/BTC: Price Stalls At Falling Trend Line – Can It Break Above?
Against Bitcoin, the coin saw a 17% increase over the past 4 days of trading. This price hike saw XRP breaking above the 3-month old descending trend line at 2710 SAT and above the 100-days EMA at 2850 SAT. It continued to climb higher above 2900 SAT to reach the current resistance at 3000 SAT.
The break above the descending trend line now puts XRP into a short term bullish trend. For it to continue, the price needs to break above the 3000 SAT level. A drop below 2850 SAT (100-days EMA) would turn XRP neutral with a further drop beneath 2710 SAT turning it bearish.
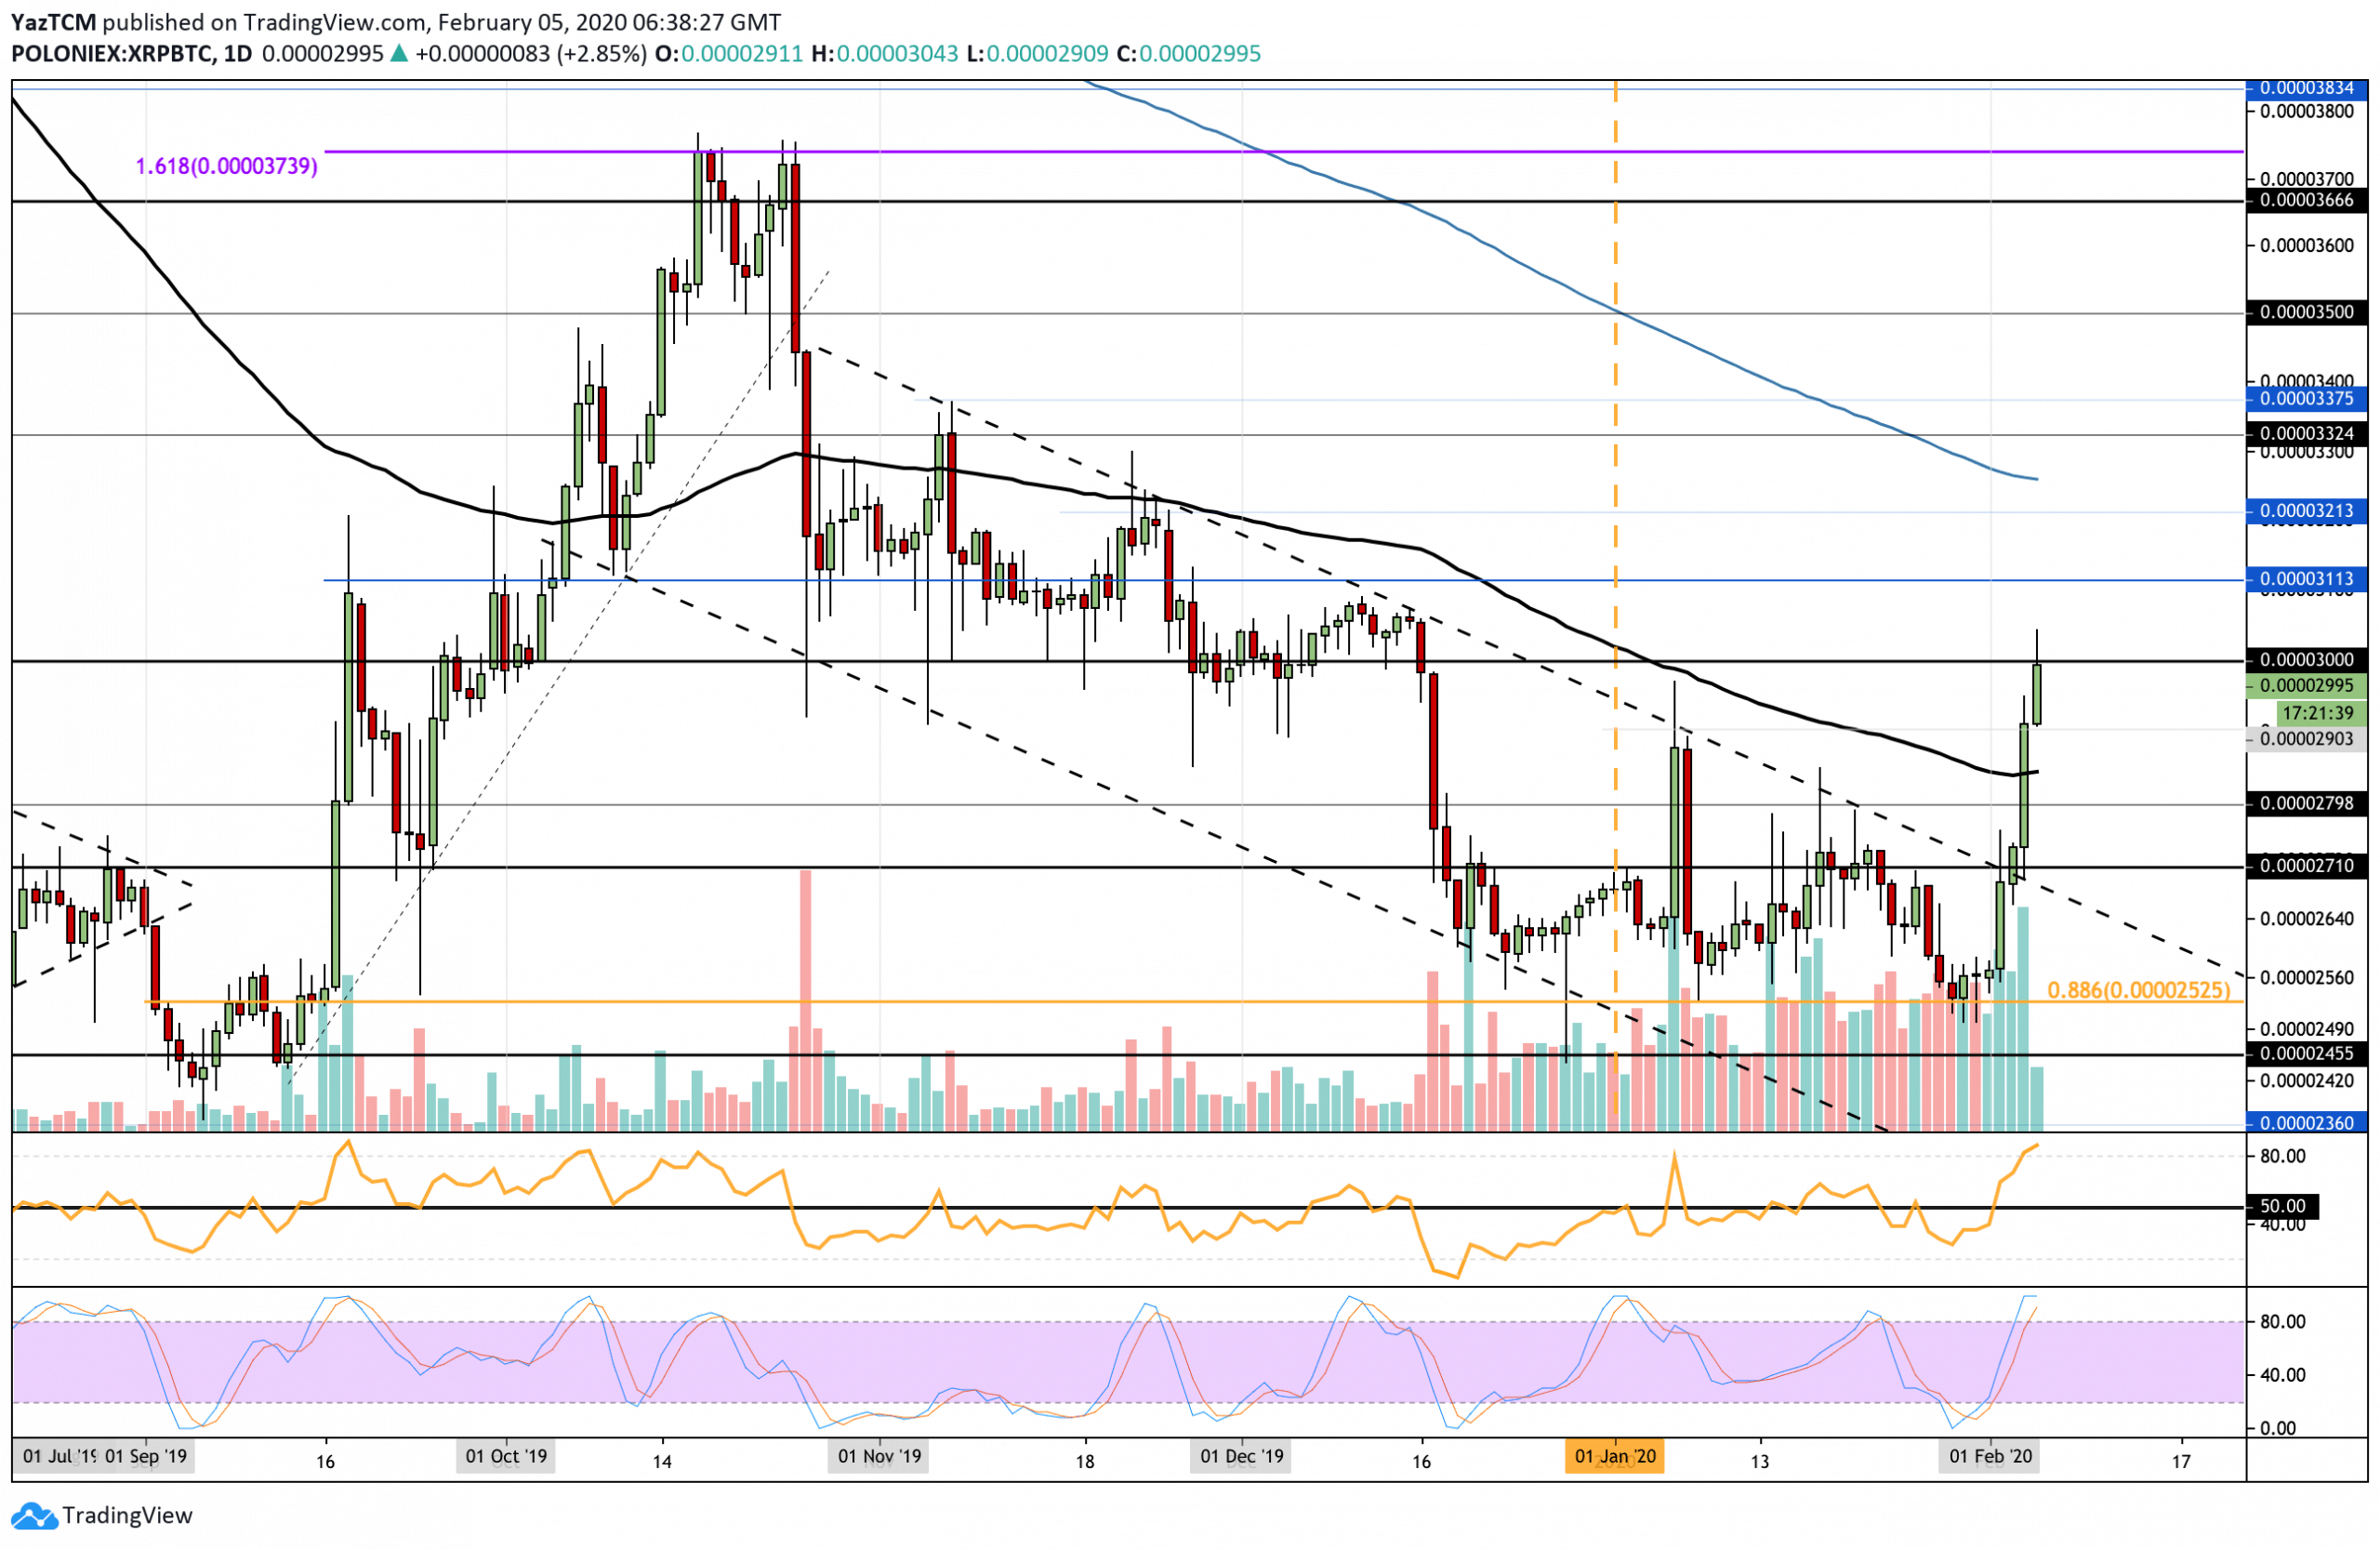
XRP Short Term Price Prediction
If the bulls break 3000 SAT, resistance lies at 3115 SAT, 3200 SAT, and 3255 SAT (200-days EMA). Above this, additional resistance lies at 3375 SAT and 3500 SAT.
On the other side, if XRP drops below 3000 SAT, support lies at 2900 SAT, 2850 SAT (100-days EMA), and 2710 SAT.
Likewise, the RSI has reached extremely overbought conditions which should warn traders to be cautious as the market may be overstretched. The Stochastic RSI is also preparing for a bearish crossover which might stop the bullish increase.