A brief glimpse at the Bitcoin price chart over the past decade clearly shows that we are in what appears to be the early days of the fourth bull market cycle. The asset has experienced multiple boom-and-bust cycles in its brief history, and three can be clearly identified with tops and bottoms.600 Days Into Current CycleIn a recent report by CoinMetrics, these cycles have been overlaid in an effort to attempt estimation at the length of the current cycle.The current cycle began when Bitcoin last hit a low, which was in December 2018 when it fell to around ,200. Since then, it has been grinding higher and closing in on its previous all-time high, despite a pandemic induced global market crash in mid-March, which drove prices back below k briefly.Bitcoin cycles. Source: coinmetricsThe
Topics:
Martin Young considers the following as important: AA News, Bitcoin (BTC) Price, BTCEUR, BTCGBP, btcusd, btcusdt
This could be interesting, too:
Chayanika Deka writes Yuga Labs Secures Major Win as SEC Closes Investigation Without Charges
Andrew Throuvalas writes Bitcoin Soars Back To ,000 After BlackRock CEO Says “Buy The Dip”
Chayanika Deka writes XRP, SOL, and ADA Inclusion in US Crypto Reserve Pushes Traders on Edge
Chayanika Deka writes Why Arthur Hayes Is Bullish on Bitcoin Under Trump’s Economic Strategy
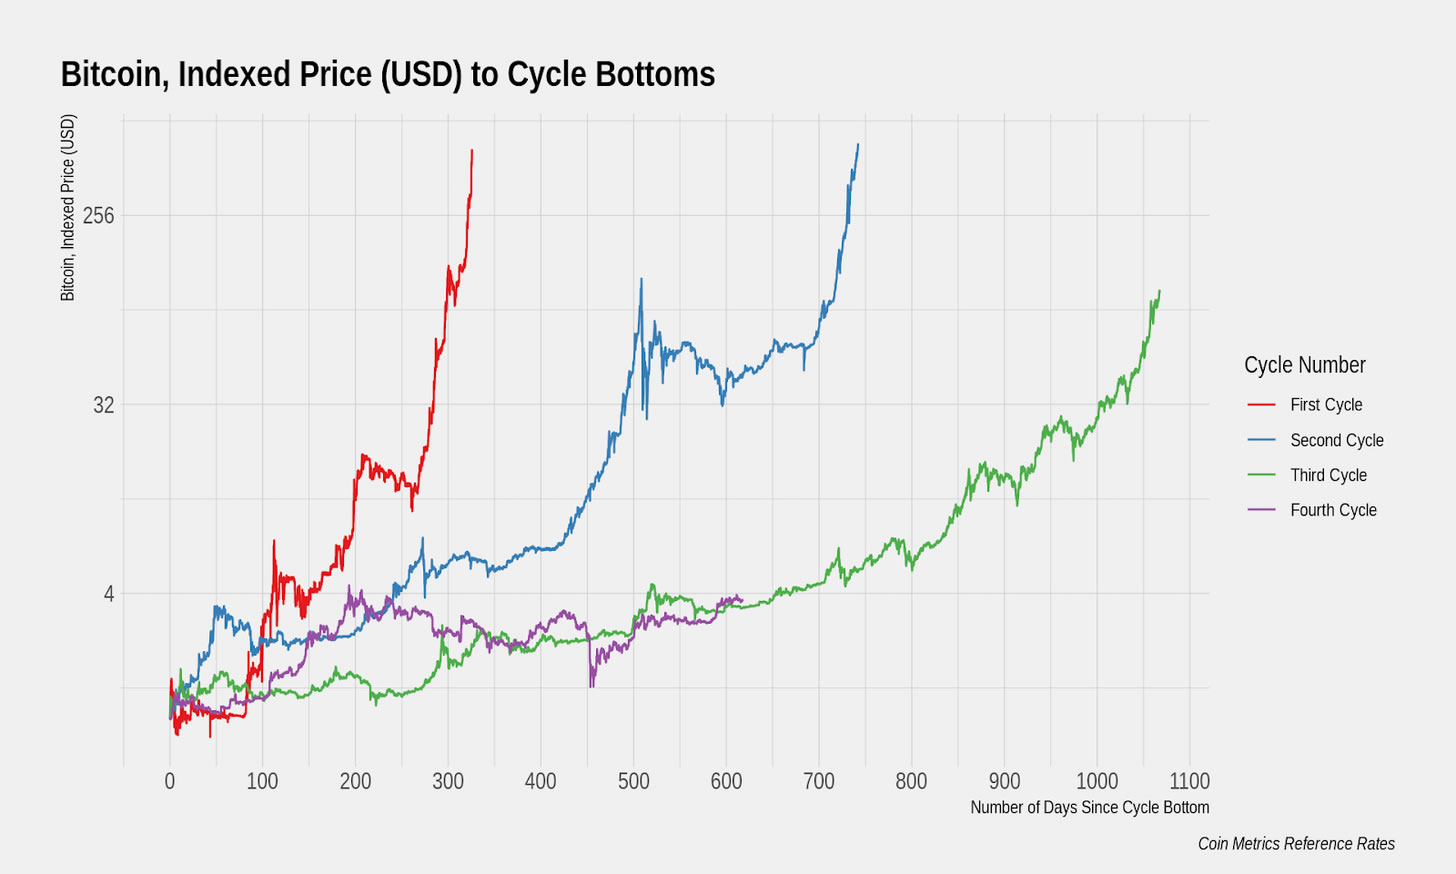
A brief glimpse at the Bitcoin price chart over the past decade clearly shows that we are in what appears to be the early days of the fourth bull market cycle. The asset has experienced multiple boom-and-bust cycles in its brief history, and three can be clearly identified with tops and bottoms.
600 Days Into Current Cycle
In a recent report by CoinMetrics, these cycles have been overlaid in an effort to attempt estimation at the length of the current cycle.
The current cycle began when Bitcoin last hit a low, which was in December 2018 when it fell to around $3,200. Since then, it has been grinding higher and closing in on its previous all-time high, despite a pandemic induced global market crash in mid-March, which drove prices back below $5k briefly.

The research noted that we are currently 600 days into the present cycle and compared this to the previous one, which began in early 2015. It stated that there is no guarantee that markets will follow historical patterns, but …
“Financial history has shown us that the formation of asset bubbles appear to be linked to deeply rooted aspects of human behavior.”
It added that the market has grown to a point where further increases are more complicated than before. As each previous cycle has been longer than the one before it, there is a good chance that this one will be longer than the previous three-year cycle from trough to peak at the end of 2017.
It concluded that there could be at least several hundred more days remaining in the current cycle. Looking at the chart, it seems that around two years more would result in a cycle of the same length as the previous.
Bitcoin Price Update
Back in the present, Bitcoin price appears to have started a minor pull-back cycle from its 2020 high of $12,400. The asset has retreated 8.5% from those levels and is likely to drop further before resuming its upwards momentum. Analyst and trader Josh Rager said that corrections by 30-40% are perfectly natural, and have happened countless times in the past.
Tweet from over a year ago
I hope you’re not worried about this pullback by $BTC
You can expect several more 30% to 40% pullbacks on the way up to new highs for Bitcoin
This is just the reality of the market https://t.co/sOwgmbWAKG
— Josh Rager ? (@Josh_Rager) August 25, 2020
The path to a new high is not going to be a straight one and, going by previous cycles, could be a long way off yet.
