The futures market experienced a moderate reset in the funding rate. The recent price volatility in the range between and K has caused it to decline. However, similar to the price rally from the COVID crash in 2020, a rising macro trend in the funding rate becomes obvious. At the same time, the momentum of the open interest has also dropped through the last two weeks of volatile price movements. Chart by CryptoQuantThe market has the same structure that we saw in December 2020. The critical point here is that the Monthly Realized Cap Oscillator structure (the rate of realizing a profit on a 30-day basis) is not similar to that of April 2021, when the market was realizing profit equal to 5-10% of the realized cap. Currently, this metric remains below 5%, which is the
Topics:
George Georgiev considers the following as important: AA News, Bitcoin (BTC) Price, BTCEUR, BTCGBP, btcusd, btcusdt
This could be interesting, too:
Chayanika Deka writes Yuga Labs Secures Major Win as SEC Closes Investigation Without Charges
Andrew Throuvalas writes Bitcoin Soars Back To ,000 After BlackRock CEO Says “Buy The Dip”
Chayanika Deka writes XRP, SOL, and ADA Inclusion in US Crypto Reserve Pushes Traders on Edge
Chayanika Deka writes Why Arthur Hayes Is Bullish on Bitcoin Under Trump’s Economic Strategy
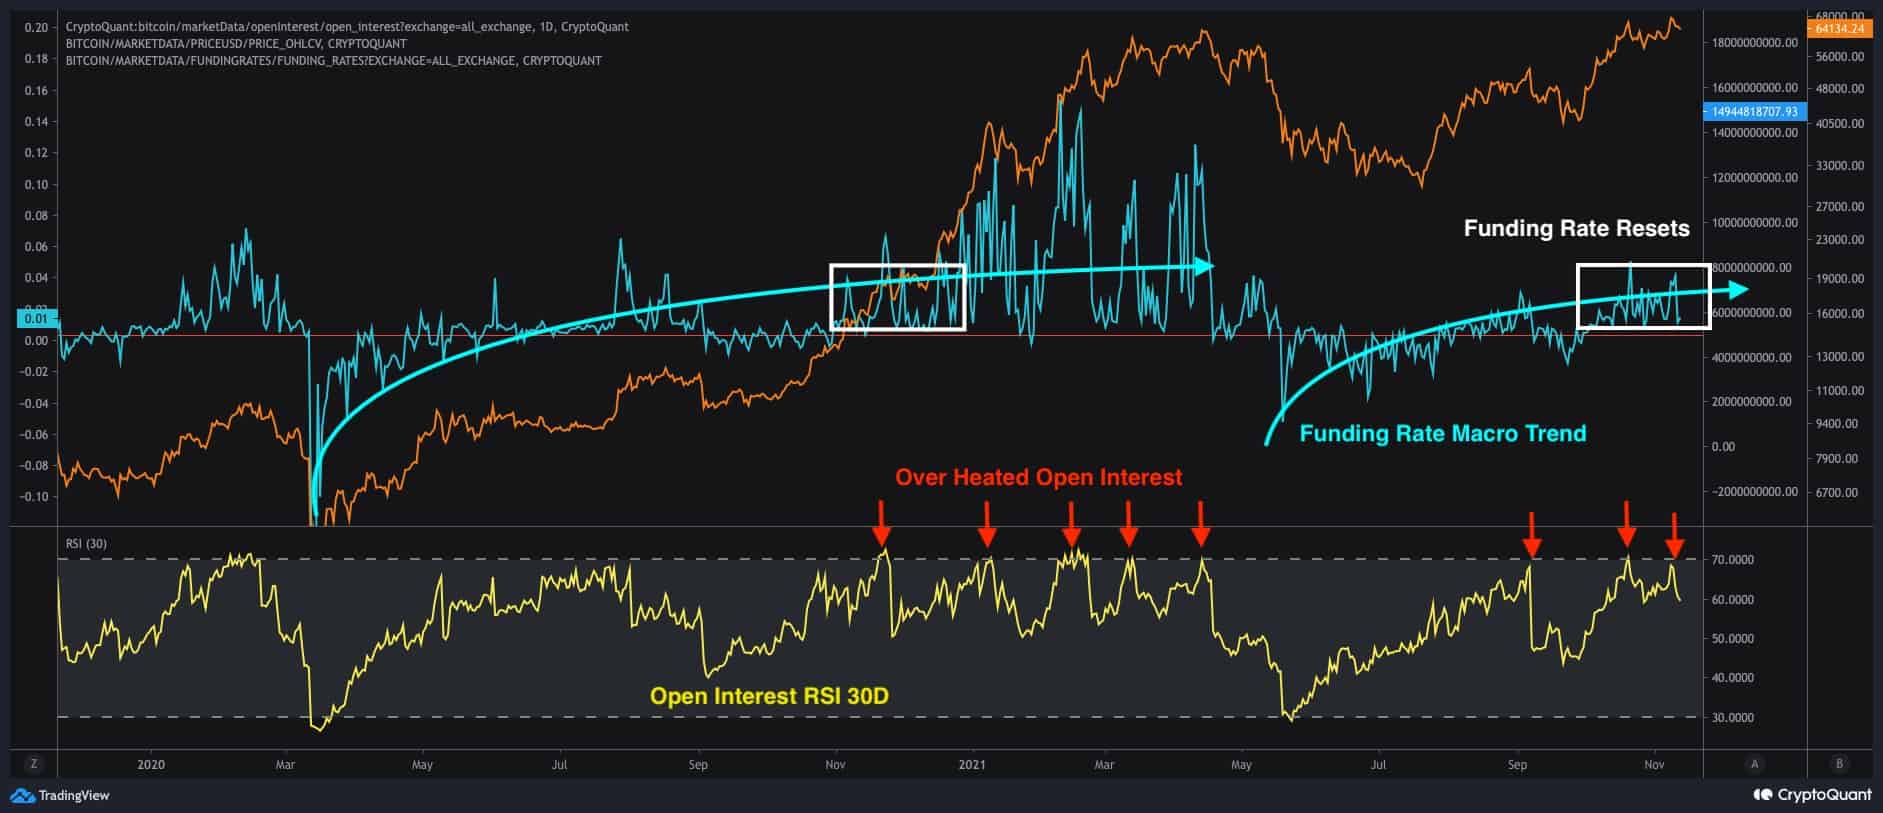
The futures market experienced a moderate reset in the funding rate. The recent price volatility in the range between $58 and $69K has caused it to decline. However, similar to the price rally from the COVID crash in 2020, a rising macro trend in the funding rate becomes obvious.
At the same time, the momentum of the open interest has also dropped through the last two weeks of volatile price movements.
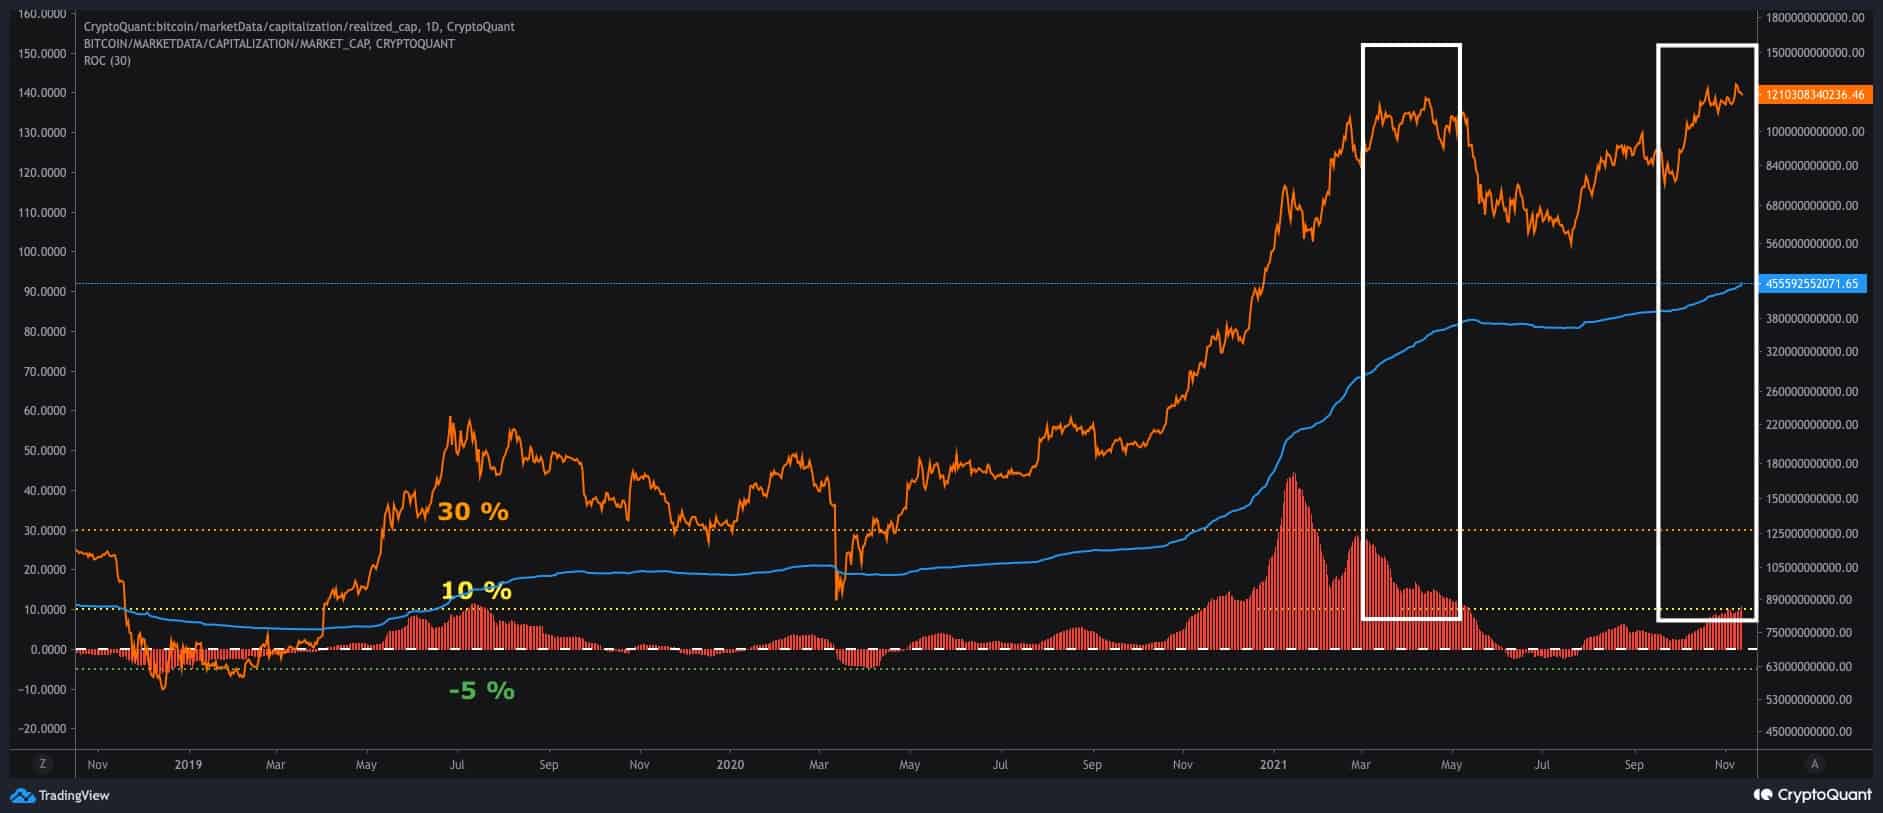
The market has the same structure that we saw in December 2020. The critical point here is that the Monthly Realized Cap Oscillator structure (the rate of realizing a profit on a 30-day basis) is not similar to that of April 2021, when the market was realizing profit equal to 5-10% of the realized cap. Currently, this metric remains below 5%, which is the same level it was in December 2020.
Studying the UTXO Change Histogram for the last 14 days can demonstrate the change of hands in the network. Almost 28% of the selling pressure was from coins that last bought between the $61.8K and $64.2K range.
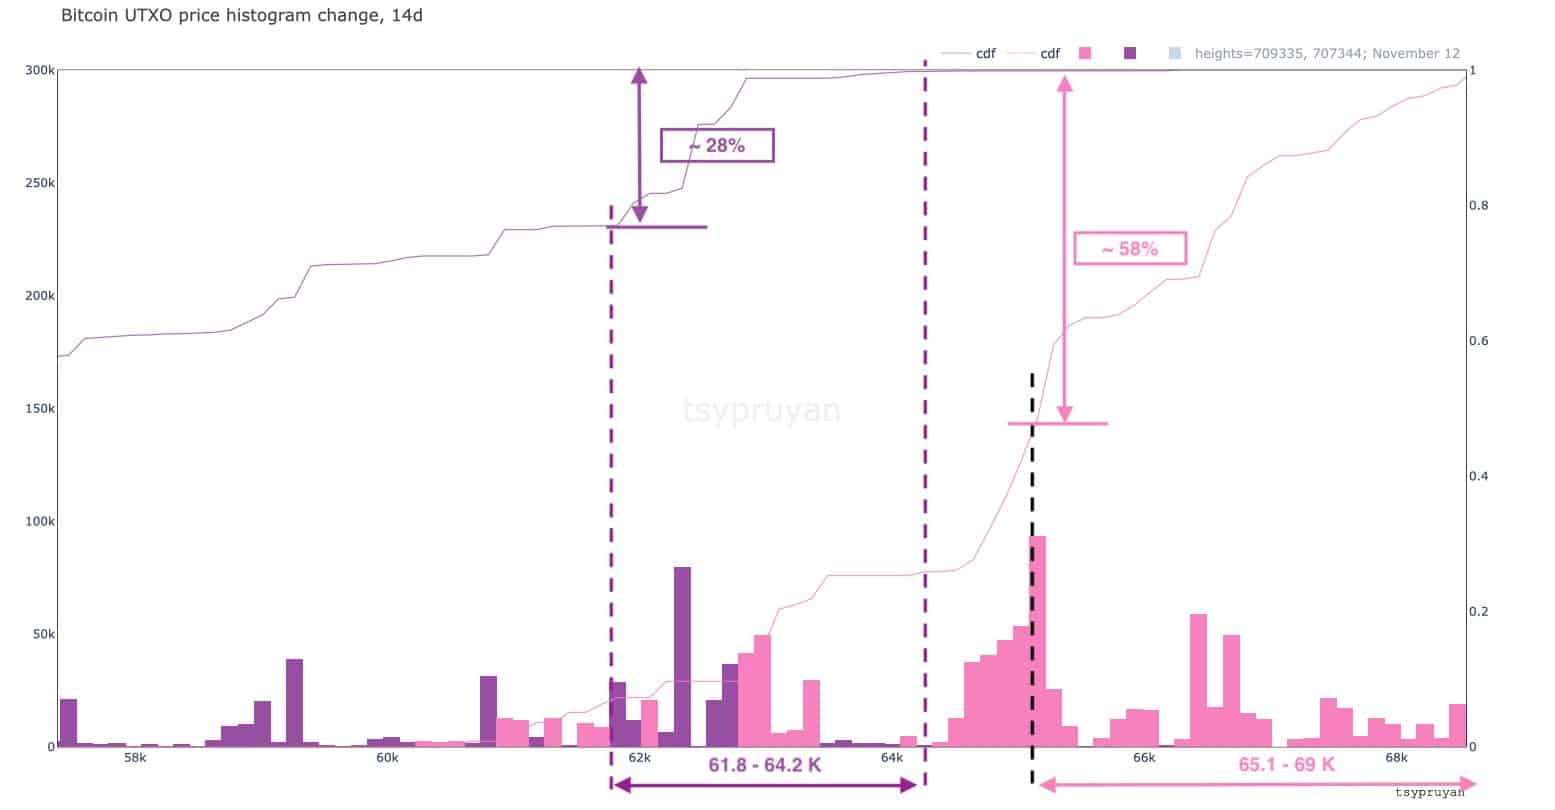
On the other hand, almost 58% of the selling pressure was absorbed by buyers at the range between $65.1K and $69K. Looking at these numbers, we can see that old coins are not selling aggressively currently. Also, the $60K level is expected to be strong support that should hold through possible short-term price fluctuations.
The above analysis is compiled by on-chain analyst CryptoVizArt for CryptoPotato