After the price topped at K on Monday, Bitcoin had lost over 00 in just a day. Is BTC entering a deeper correction, or where is the local bottom? Technical Analysis Short-Term Analysis Last week the bitcoin price broke above a mid-term descending trend line on the 4-hour timeframe. After completing a pullback, the price increased again and touched k resistance (Monday). However, the market did not have enough momentum to continue the rally (low volume), and the bears won the battle. For now, BTC is supported by the static support zone – as can be seen on the following chart. If BTC loses the first support zone, the k-46k range will be the next critical supporting level. Additionally, looking at the RSI indicator, we can see that the lower band of the Bollinger
Topics:
George Georgiev considers the following as important: Bitcoin (BTC) Price, BTC Analysis, BTCEUR, BTCGBP, btcusd, btcusdt
This could be interesting, too:
Chayanika Deka writes XRP, SOL, and ADA Inclusion in US Crypto Reserve Pushes Traders on Edge
Chayanika Deka writes Why Arthur Hayes Is Bullish on Bitcoin Under Trump’s Economic Strategy
Mandy Williams writes Why the Bitcoin Market Is Stuck—and the Key Metric That Could Change It: CryptoQuant CEO
Wayne Jones writes Metaplanet Acquires 156 BTC, Bringing Total Holdings to 2,391
After the price topped at $52K on Monday, Bitcoin had lost over $4000 in just a day. Is BTC entering a deeper correction, or where is the local bottom?
Technical Analysis
Short-Term Analysis
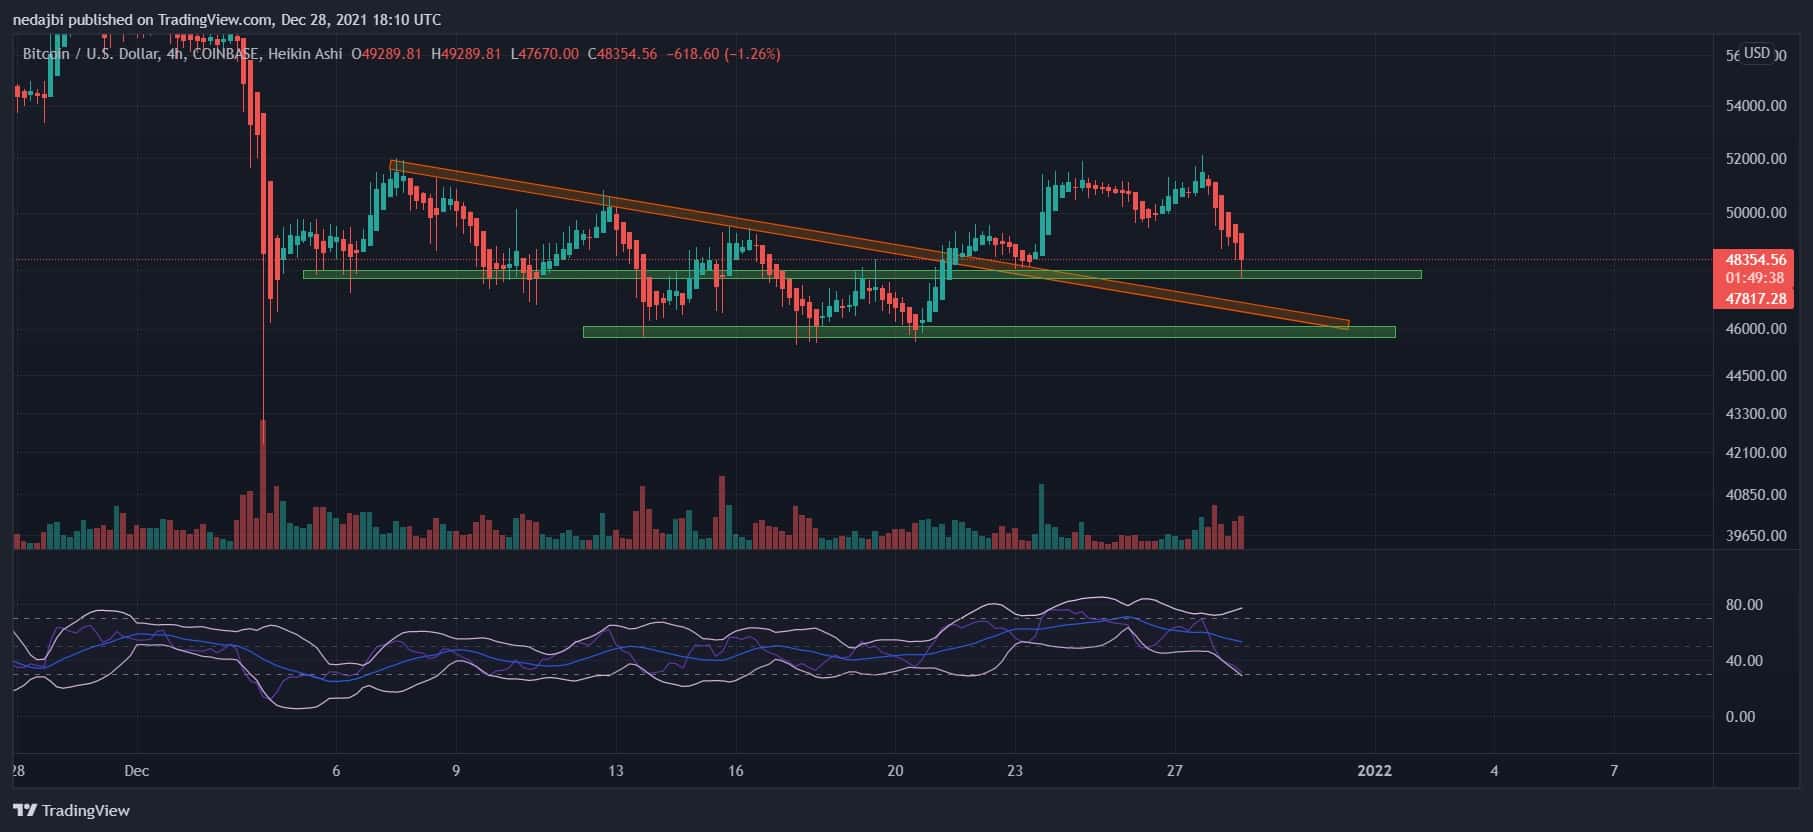
Last week the bitcoin price broke above a mid-term descending trend line on the 4-hour timeframe. After completing a pullback, the price increased again and touched $52k resistance (Monday).
However, the market did not have enough momentum to continue the rally (low volume), and the bears won the battle. For now, BTC is supported by the static support zone – as can be seen on the following chart.
If BTC loses the first support zone, the $45k-46k range will be the next critical supporting level. Additionally, looking at the RSI indicator, we can see that the lower band of the Bollinger is getting closer to the oversold territory; hence, we likely see a positive correction at some point.
Daily Analysis
Bitcoin could not break out of the Ichimoku Cloud on the daily time frame. Now, the primary cryptocurrency had lost Tenkan-Sen as support.
Based on the historical reactions that the price has shown before, bitcoin must break above the Ichimoku Cloud in order to regain its bullish momentum. As shown on the chart below, the green zones might serve as strong supports levels on the daily time frame.

Onchain Analysis
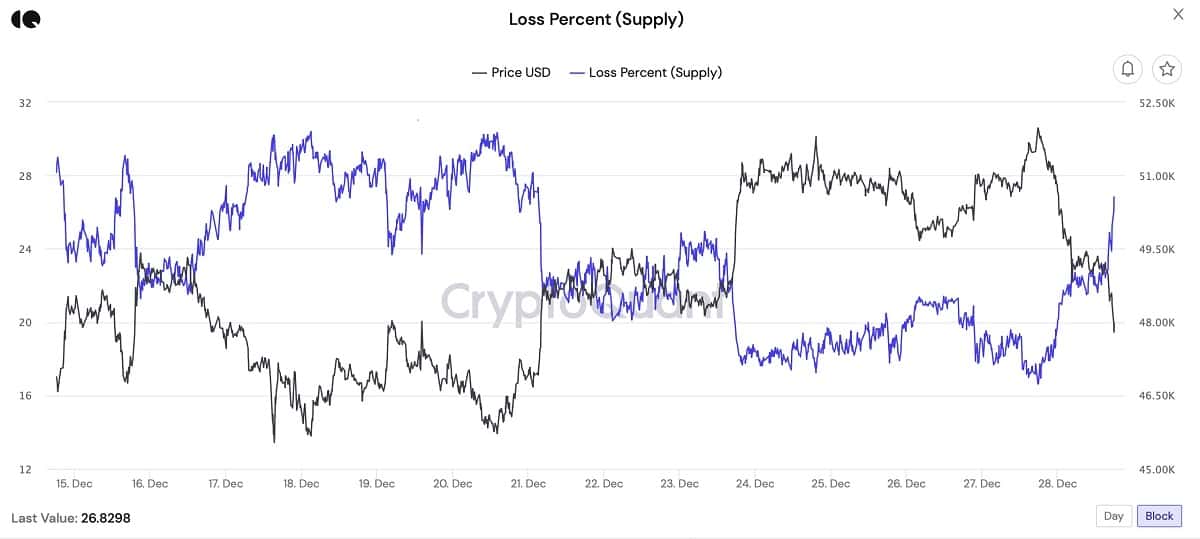
Currently, 26% of the supply is in the loss territory. Historically, the market saw 32% supply-in-loss at $29K bottom in July.
Therefore, there is a high possibility that the $40K-$42K range will be retested, and likely become a local bottom for the midterm. As a matter of fact, the lowest level was reached amid the March-2020 COVID crash, where almost 60% of the supply was in loss.
The above analysis was complied by analysts @GrizzlyBTClover, @N__E__D__A, and @CryptoVizArt exclusively for CryptoPotato.