Bitcoin’s price has failed to recover and seems to be struggling below the K mark. As of now, BTC has lost 7% over the last week, trading in the range of -56K, failing to reclaim the 50-day moving average line. Chart by TradingViewThe Technicals Bitcoin’s price painted a lower low yesterday. Today, it continues to decline and taps the critical support zone between K and K – something we’ve been tracking in our previous analysis. The K level provides very strong support in terms of both technical and on-chain indicators. From a technical perspective, there are two confluences found there – the first one is the 38% Fibonacci retracement level on the current structure, whereas the second is the trendline that dates back to March 2020 and has acted as support on
Topics:
George Georgiev considers the following as important: Bitcoin (BTC) Price, BTC Analysis, BTCEUR, BTCGBP, btcusd, btcusdt
This could be interesting, too:
Chayanika Deka writes XRP, SOL, and ADA Inclusion in US Crypto Reserve Pushes Traders on Edge
Chayanika Deka writes Why Arthur Hayes Is Bullish on Bitcoin Under Trump’s Economic Strategy
Mandy Williams writes Why the Bitcoin Market Is Stuck—and the Key Metric That Could Change It: CryptoQuant CEO
Wayne Jones writes Metaplanet Acquires 156 BTC, Bringing Total Holdings to 2,391
Bitcoin’s price has failed to recover and seems to be struggling below the $60K mark. As of now, BTC has lost 7% over the last week, trading in the range of $55-56K, failing to reclaim the 50-day moving average line.
The Technicals
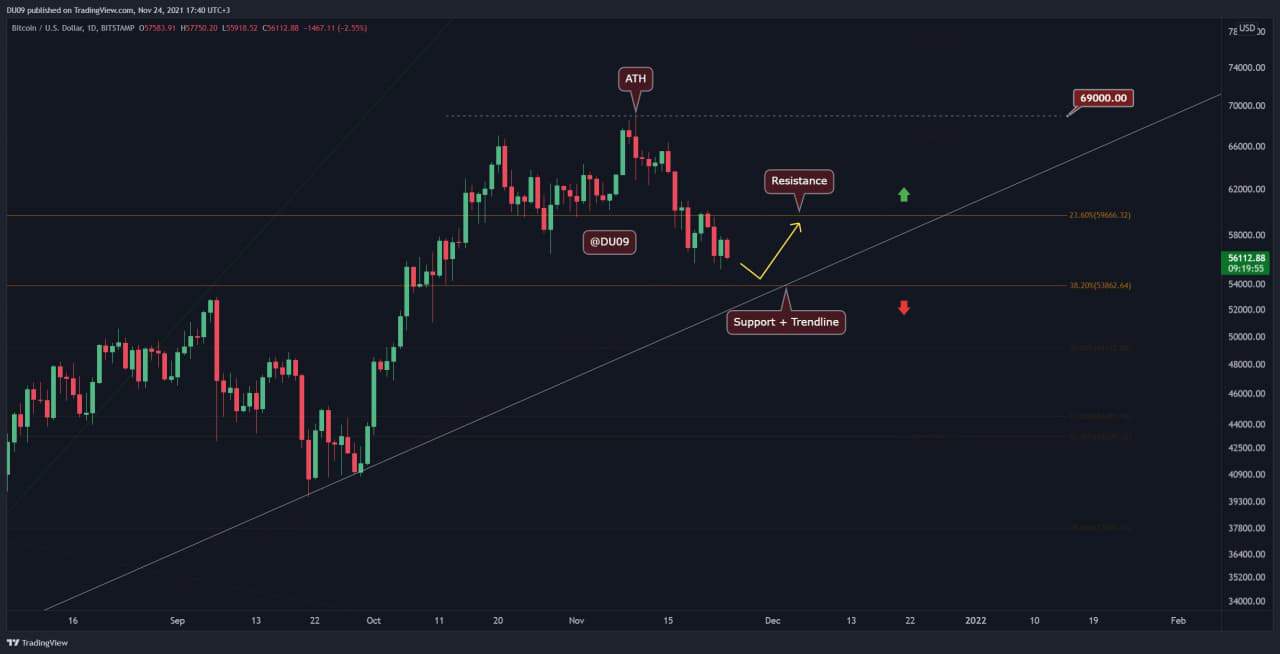
Bitcoin’s price painted a lower low yesterday. Today, it continues to decline and taps the critical support zone between $53K and $58K – something we’ve been tracking in our previous analysis. The $53K level provides very strong support in terms of both technical and on-chain indicators.
From a technical perspective, there are two confluences found there – the first one is the 38% Fibonacci retracement level on the current structure, whereas the second is the trendline that dates back to March 2020 and has acted as support on numerous occasions.
Therefore, it might be the case that the uptrend might be resumed once the level is successfully backtested as support. On the other hand, the most notable immediate resistance seems to be the 50-day MA (~$60.6K) along with the psychological level of $60K.
The trading volume has remained constant during this correction, and bears might still have some runway in them. Therefore, it’s important to be cautious in the near term. The RSI on the daily time frame continues to decline (but not yet reached oversold conditions), although there are signs of bullish divergence on the 4-hour chart as the RSI is making higher lows. To confirm it, BTC needs to hold above $53K and produce a meaningful push to the upside.

The On-Chain
For the on-chain outlook, we take a closer look at the analysis of Daniel Joe. According to the analyst (which writes for CryptoPotato), the confluent technical uptrend support is strong, while we have also seen no serious signs of a major trend of distribution.
On the other hand, miners are back in accumulation mode, while older coins are not selling at these rates.
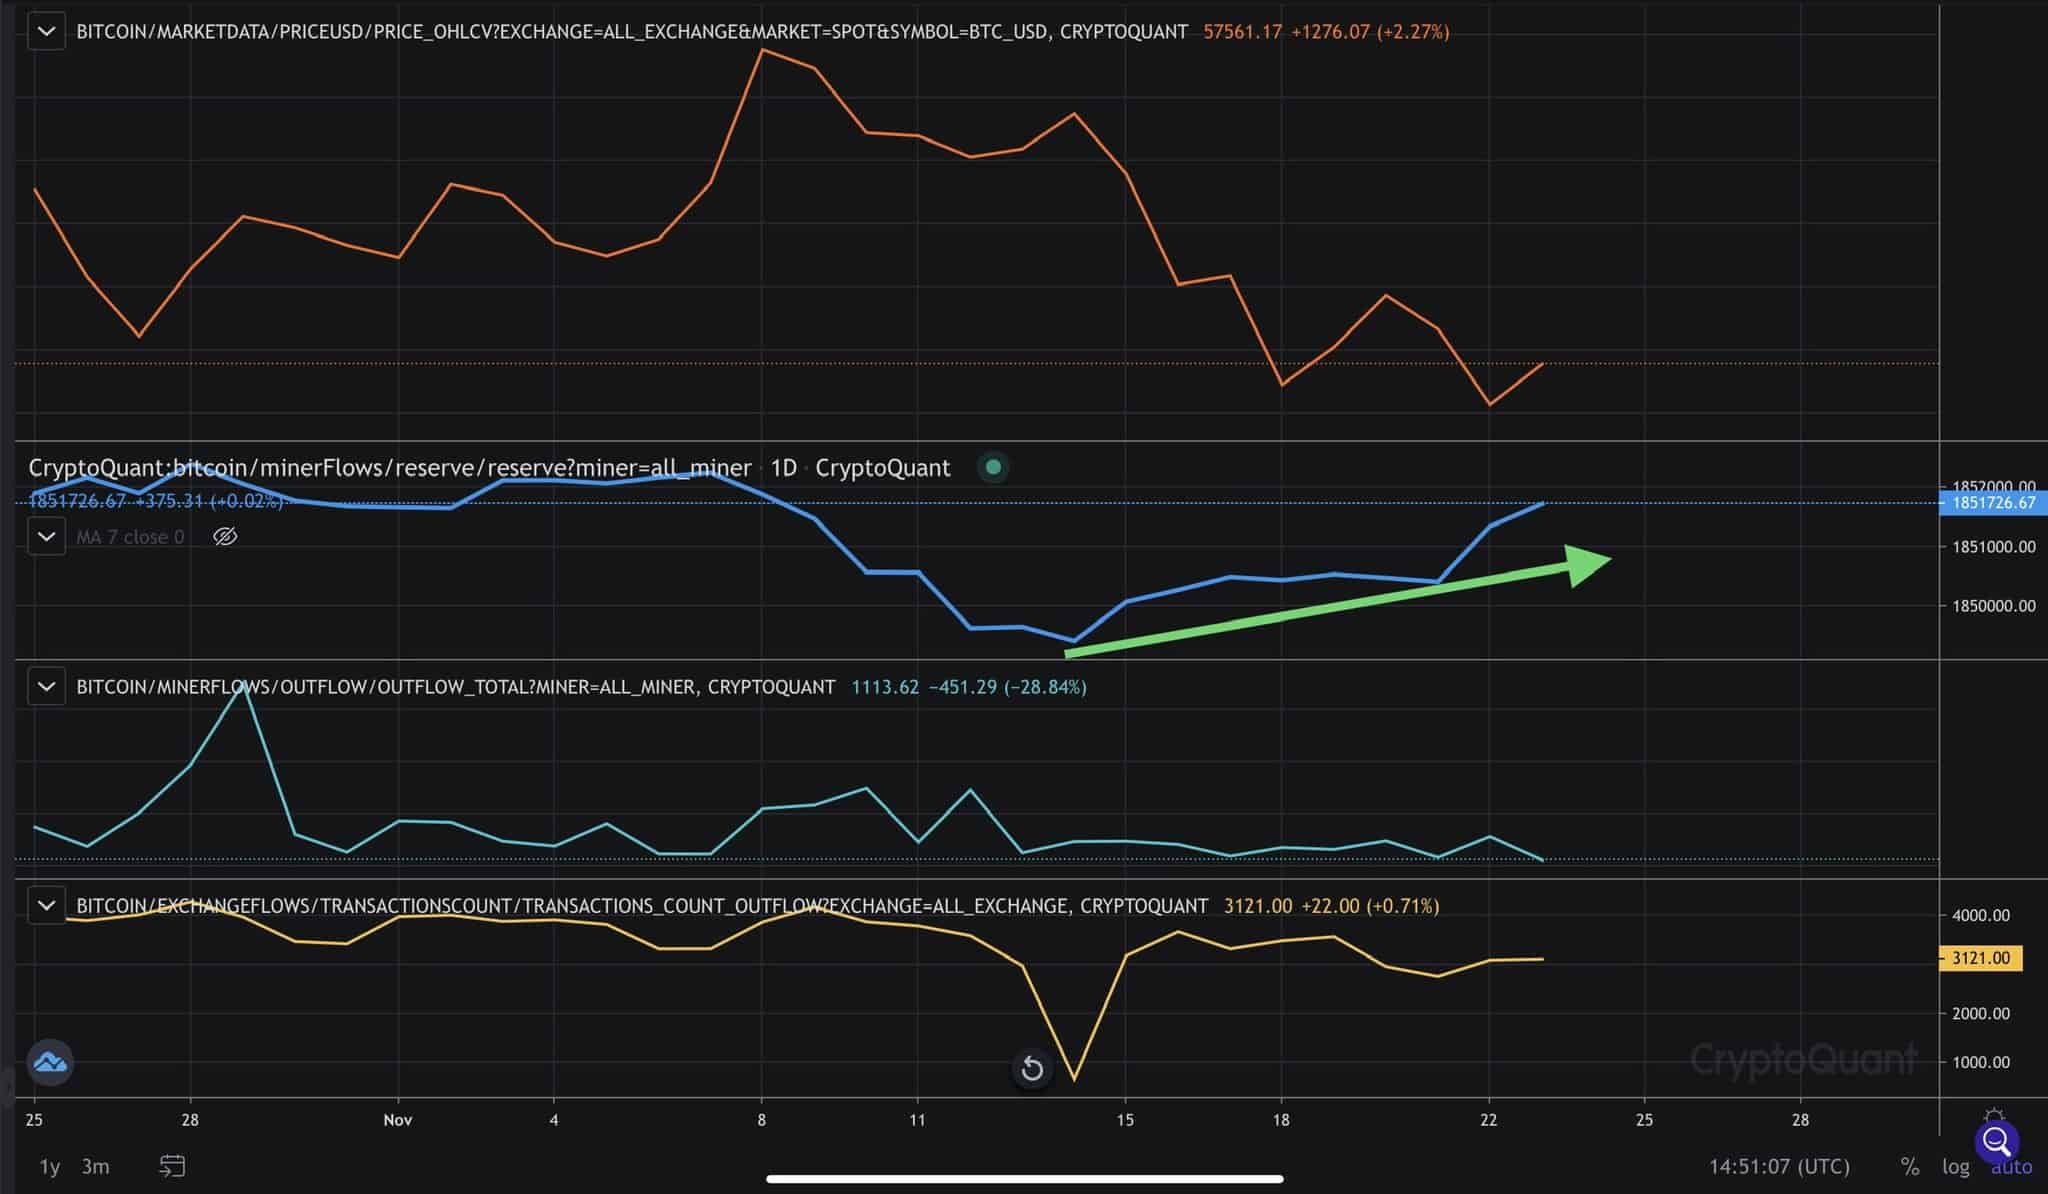
As CryptoPotato reported today, the third-largest bitcoin whale even added roughly $375 million worth of BTC to his position in the past 11 days – an obvious sign that the entity is betting on bullish continuation.
Joe concludes that should the immediate support hold, the bottom seems to be closing in.
“If the bulls can hold the uptrend support line confluent with support, with older coins and miners continuing to HODL, I think the bottom is getting closer.” – He said.
The analyst also believes that $69K (Bitcoin’s current ATH) is not this cycle’s top, as we’ve reported on numerous occasions. He considers that there’s plenty of upside ahead and that the current pullback is mainly driven by liquidations.
The technical analysis provided by Duo Nine.