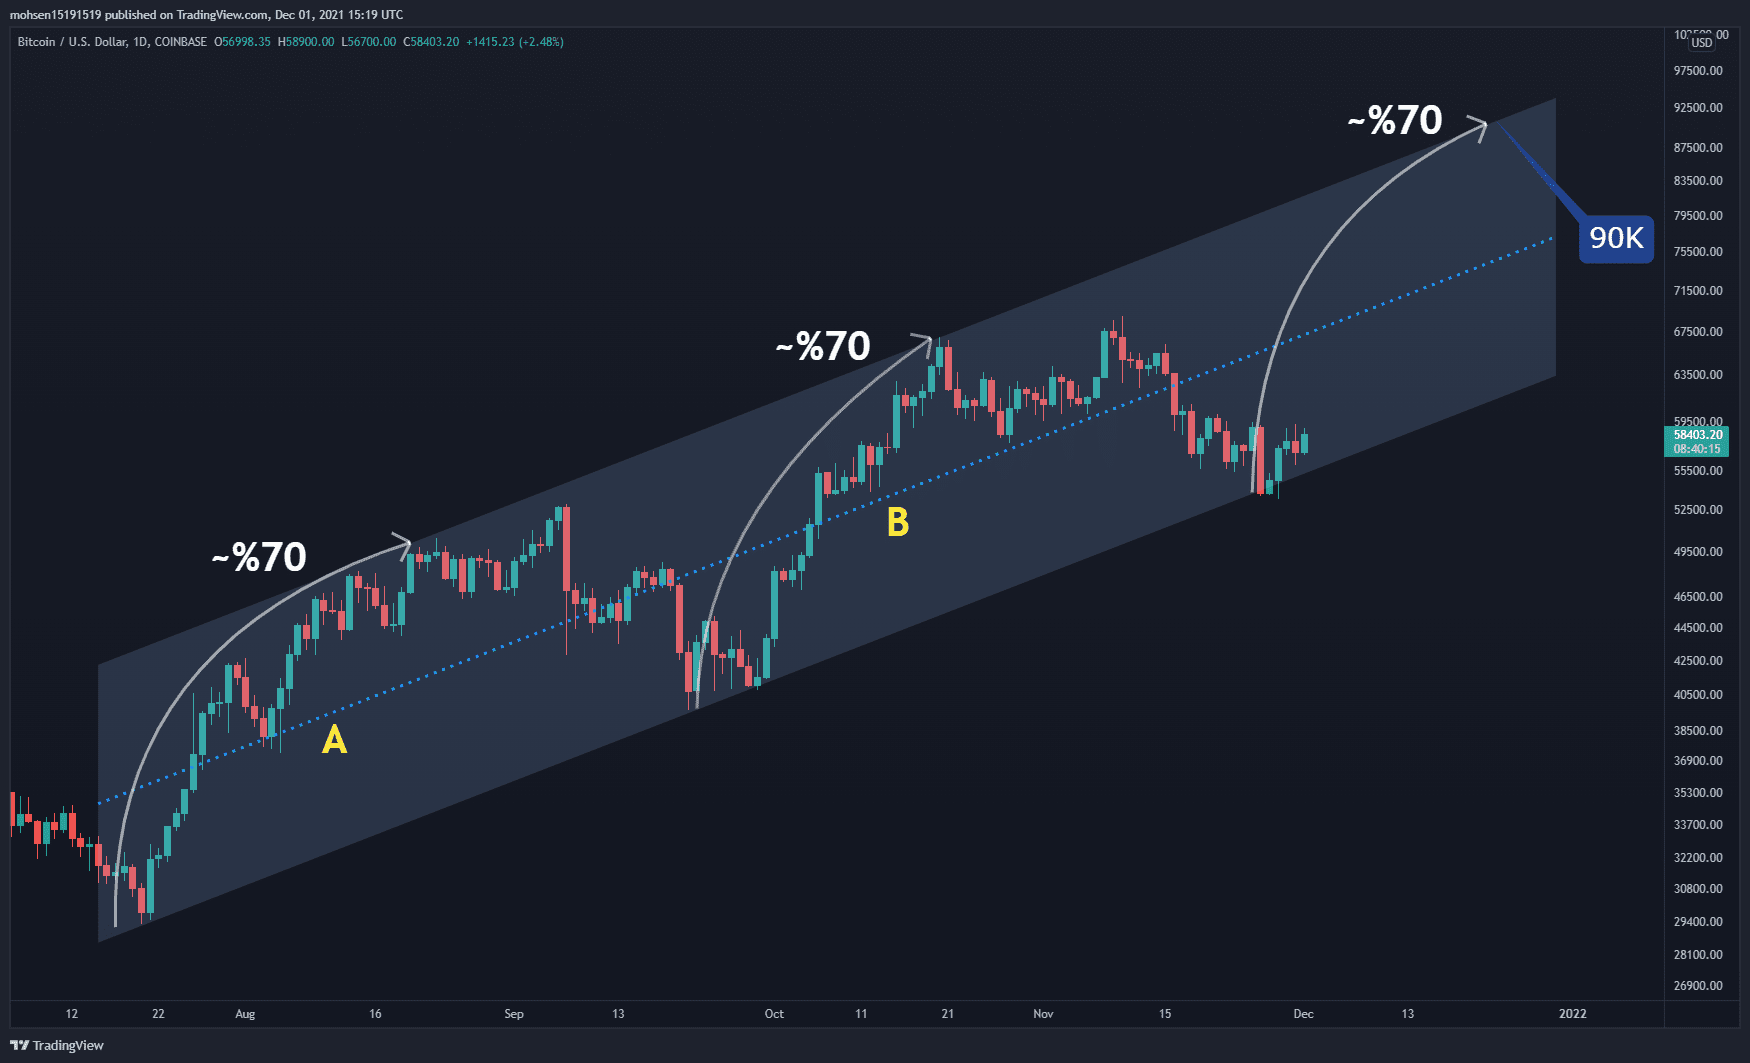
Bitcoin’s price action continues to be shaky in the short term, but that might largely be attributed to headwinds caused by the newfound COVID variant. Despite the recent bearishness, the on-chain metrics and the mid-to-long-term technicals continue to favor extended bull market and show no real signs of worry. This analysis was compiled by analysts GrizzlyBTClover and CryptoVizArt to CryptoPotato. Mid-Term Technical Analysis Bitcoin is moving up inside the uptrend channel on the daily timeframe, and the formation of higher highs and higher lows confirms its bullish bias. With the recent upside move (~70% from the bottom of the channel), the market has experienced a 20-day correction. Considering the mentioned structure, the current bullish rally is likely to continue
Topics:
George Georgiev considers the following as important: Bitcoin (BTC) Price, BTC Analysis, BTCEUR, BTCGBP, btcusd, btcusdt
This could be interesting, too:
Chayanika Deka writes XRP, SOL, and ADA Inclusion in US Crypto Reserve Pushes Traders on Edge
Chayanika Deka writes Why Arthur Hayes Is Bullish on Bitcoin Under Trump’s Economic Strategy
Mandy Williams writes Why the Bitcoin Market Is Stuck—and the Key Metric That Could Change It: CryptoQuant CEO
Wayne Jones writes Metaplanet Acquires 156 BTC, Bringing Total Holdings to 2,391
Bitcoin’s price action continues to be shaky in the short term, but that might largely be attributed to headwinds caused by the newfound COVID variant.
Despite the recent bearishness, the on-chain metrics and the mid-to-long-term technicals continue to favor extended bull market and show no real signs of worry.
This analysis was compiled by analysts GrizzlyBTClover and CryptoVizArt to CryptoPotato.
Mid-Term Technical Analysis
Bitcoin is moving up inside the uptrend channel on the daily timeframe, and the formation of higher highs and higher lows confirms its bullish bias.
With the recent upside move (~70% from the bottom of the channel), the market has experienced a 20-day correction. Considering the mentioned structure, the current bullish rally is likely to continue because of the difference between waves A and B. Wave A moved with a gentler slope than wave B and reached the top of the channel, while wave B moved with a steeper slope in a shorter time.
On the other hand, the red candles in wave B are weaker than wave A and the depth of the correction of wave B was less than wave A. These all point to a strong uptrend move. Assuming Bitcoin completes its last uptrend wave in the same manner as the past and moves towards the top of the channel, BTC prices may reach 90K.
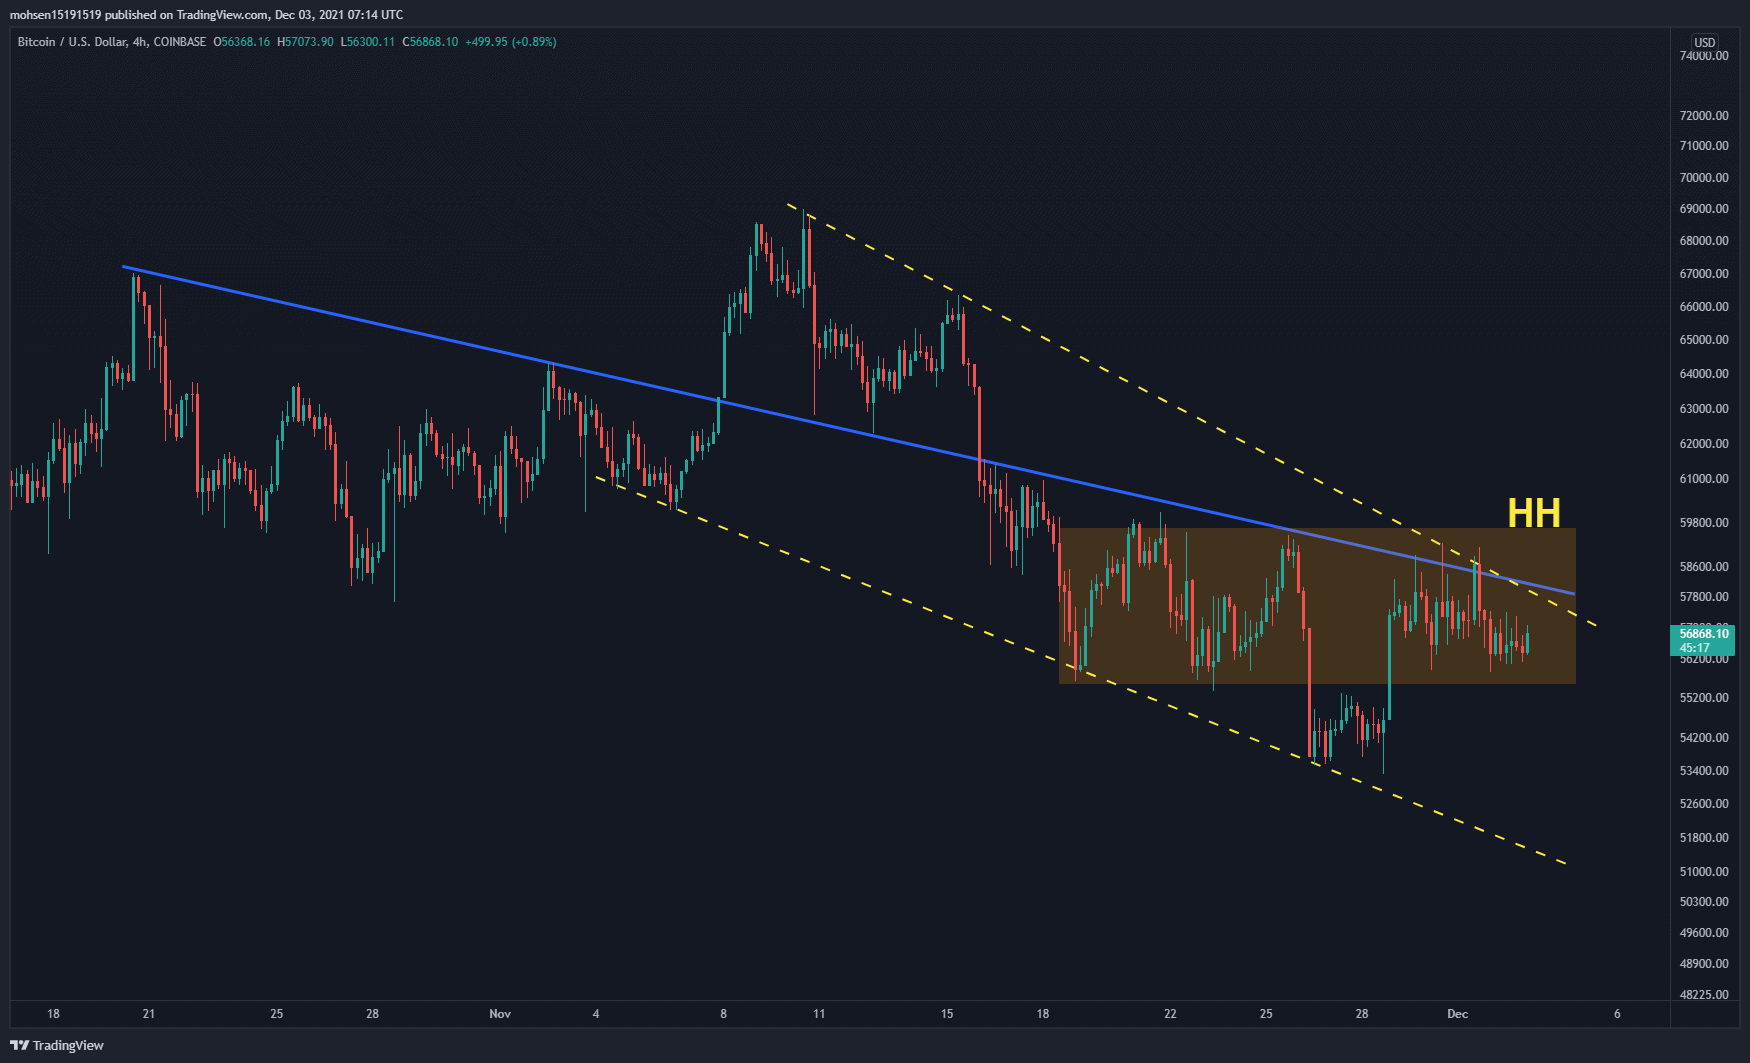
Short-Term Technical Analysis
As the next step, it’s important to look at lower timeframes to examine the mid-term trend’s reliance. The price has been struggling with the downtrend line (blue line) and crossed it a few hours ago, but this breakout hasn’t yet been confirmed (turned into a fakeout). A reversal move is confirmed when the price crosses its short-term downtrend line and forms a higher high.
As a result of the formation of a higher high at 60,000$, a continuation of the uptrend looks probable. Bearish selling pressure is indicated by upper shadows towards $60K on this timeframe. But, first, the bulls will have to break this line, and on the other hand, hold the next critical support level of $56K and the past week’s low at $53K.
Supply/Demand Analysis
Looking at the rate of change in All Exchange Reserves, it’s possible to estimate the supply & demand strength in the market.
As illustrated, the long-term trend confirms a continuous reserve depletion across all exchanges. The current declining trend started mid-July when the market bounced back from ~30K support level. Since then, the price action has been driven up by the supply shock.

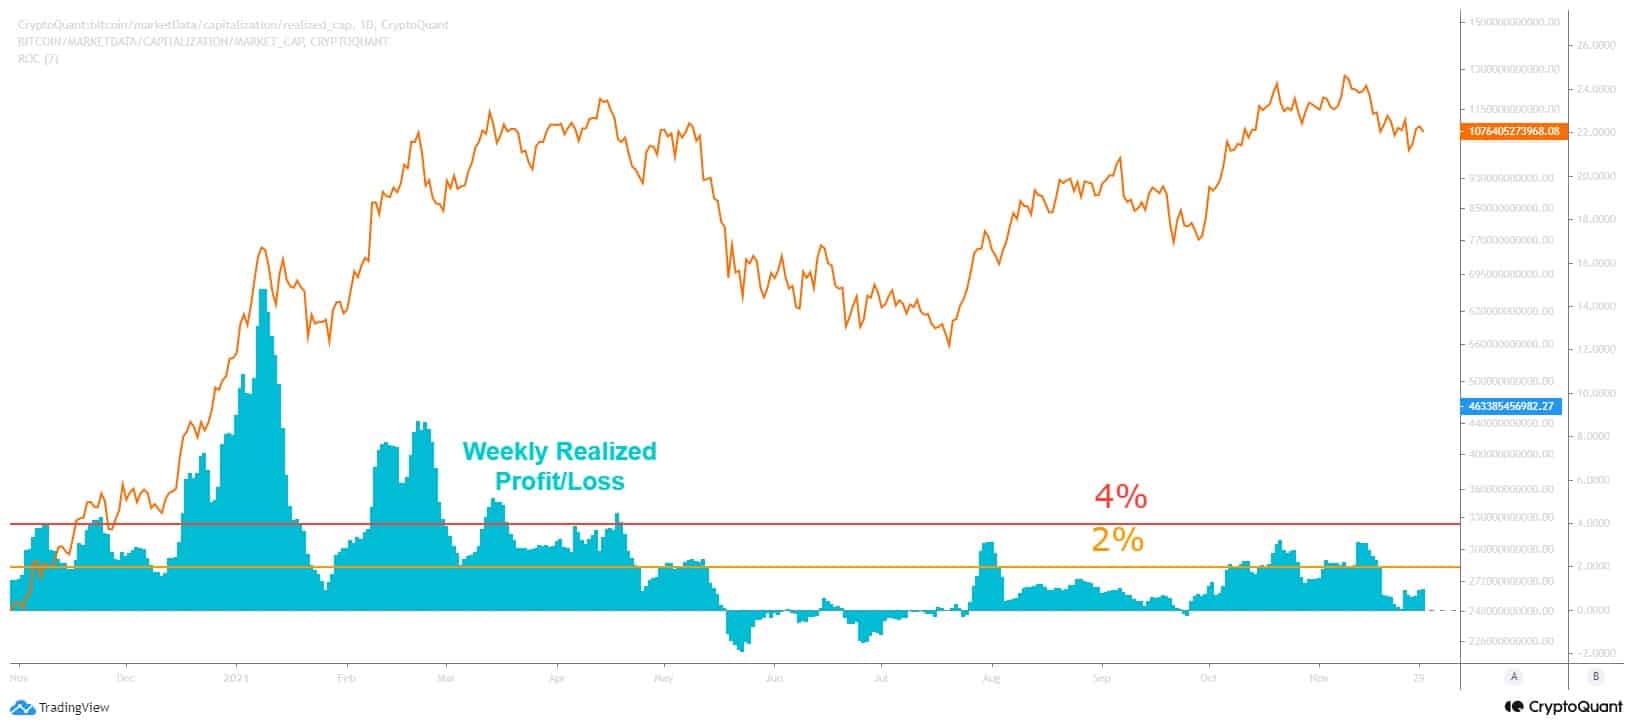
Profit/Loss Realization: Was $69K the Cycle’s Top?
The market saw a 23% dip after recording the new ATH of $69K in late November. The main concern was if this ATH was the cycle top.
To shed some light, we can compare the intensity of profit realization at the new ATH in late November ($69K top) and the previous ATH in April ($64K). The image below presents the weekly profit/loss intensity as a percentage of the realized cap. The recent rally to the $69K has not experienced an intensive profit realization like 2021 Q1.
Risk Analysis
The Mayer Multiple is a multiple of the 200-day moving average and the price. This metric uses the historical price values and estimates if the market price is statistically overheated, fair, or undervalued. The current price is slightly higher than its 200-MA ($46K) and in the low-risk zone. Based on the existing market structure, the high-risk zone is between ~$80-110K.
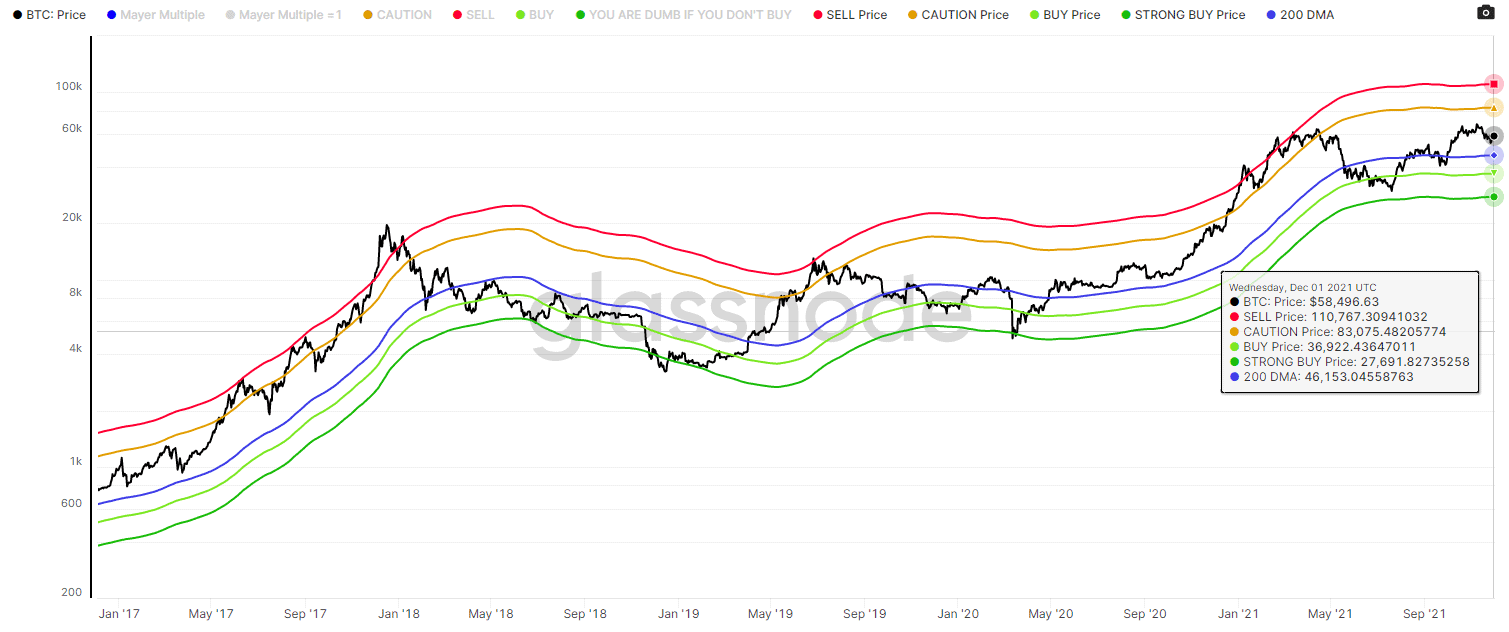
Chart by TradingView