Going through the recent week and touching the K mark, there are some promising signs in on-chain data that could lead to a further price recovery in the market. However, some metrics still make an immediate rally back to the all-time high a questionable probability. Let’s explore the bull and the bear case for Bitcoin’s price in the current market condition, stemming from predominantly on-chain information. Supply Shock – The Bull Case To summarize the overall bullish indications from an on-chain perspective, we can look at the exchange net position change on all exchanges. This examines the change of the supply held in exchange wallets over the past 30 days. To make things smoother, there’s a 90-SMA version of the metric presented in the chart below. Historically
Topics:
George Georgiev considers the following as important: Bitcoin (BTC) Price, BTCEUR, BTCGBP, btcusd, btcusdt, featured1, social
This could be interesting, too:
Chayanika Deka writes XRP, SOL, and ADA Inclusion in US Crypto Reserve Pushes Traders on Edge
Chayanika Deka writes Why Arthur Hayes Is Bullish on Bitcoin Under Trump’s Economic Strategy
Mandy Williams writes Why the Bitcoin Market Is Stuck—and the Key Metric That Could Change It: CryptoQuant CEO
Wayne Jones writes Metaplanet Acquires 156 BTC, Bringing Total Holdings to 2,391
Going through the recent week and touching the $40K mark, there are some promising signs in on-chain data that could lead to a further price recovery in the market. However, some metrics still make an immediate rally back to the all-time high a questionable probability.
Let’s explore the bull and the bear case for Bitcoin’s price in the current market condition, stemming from predominantly on-chain information.
Supply Shock – The Bull Case
To summarize the overall bullish indications from an on-chain perspective, we can look at the exchange net position change on all exchanges.
This examines the change of the supply held in exchange wallets over the past 30 days. To make things smoother, there’s a 90-SMA version of the metric presented in the chart below.
Historically speaking, there is a repeated pattern in all last three bitcoin cycles.
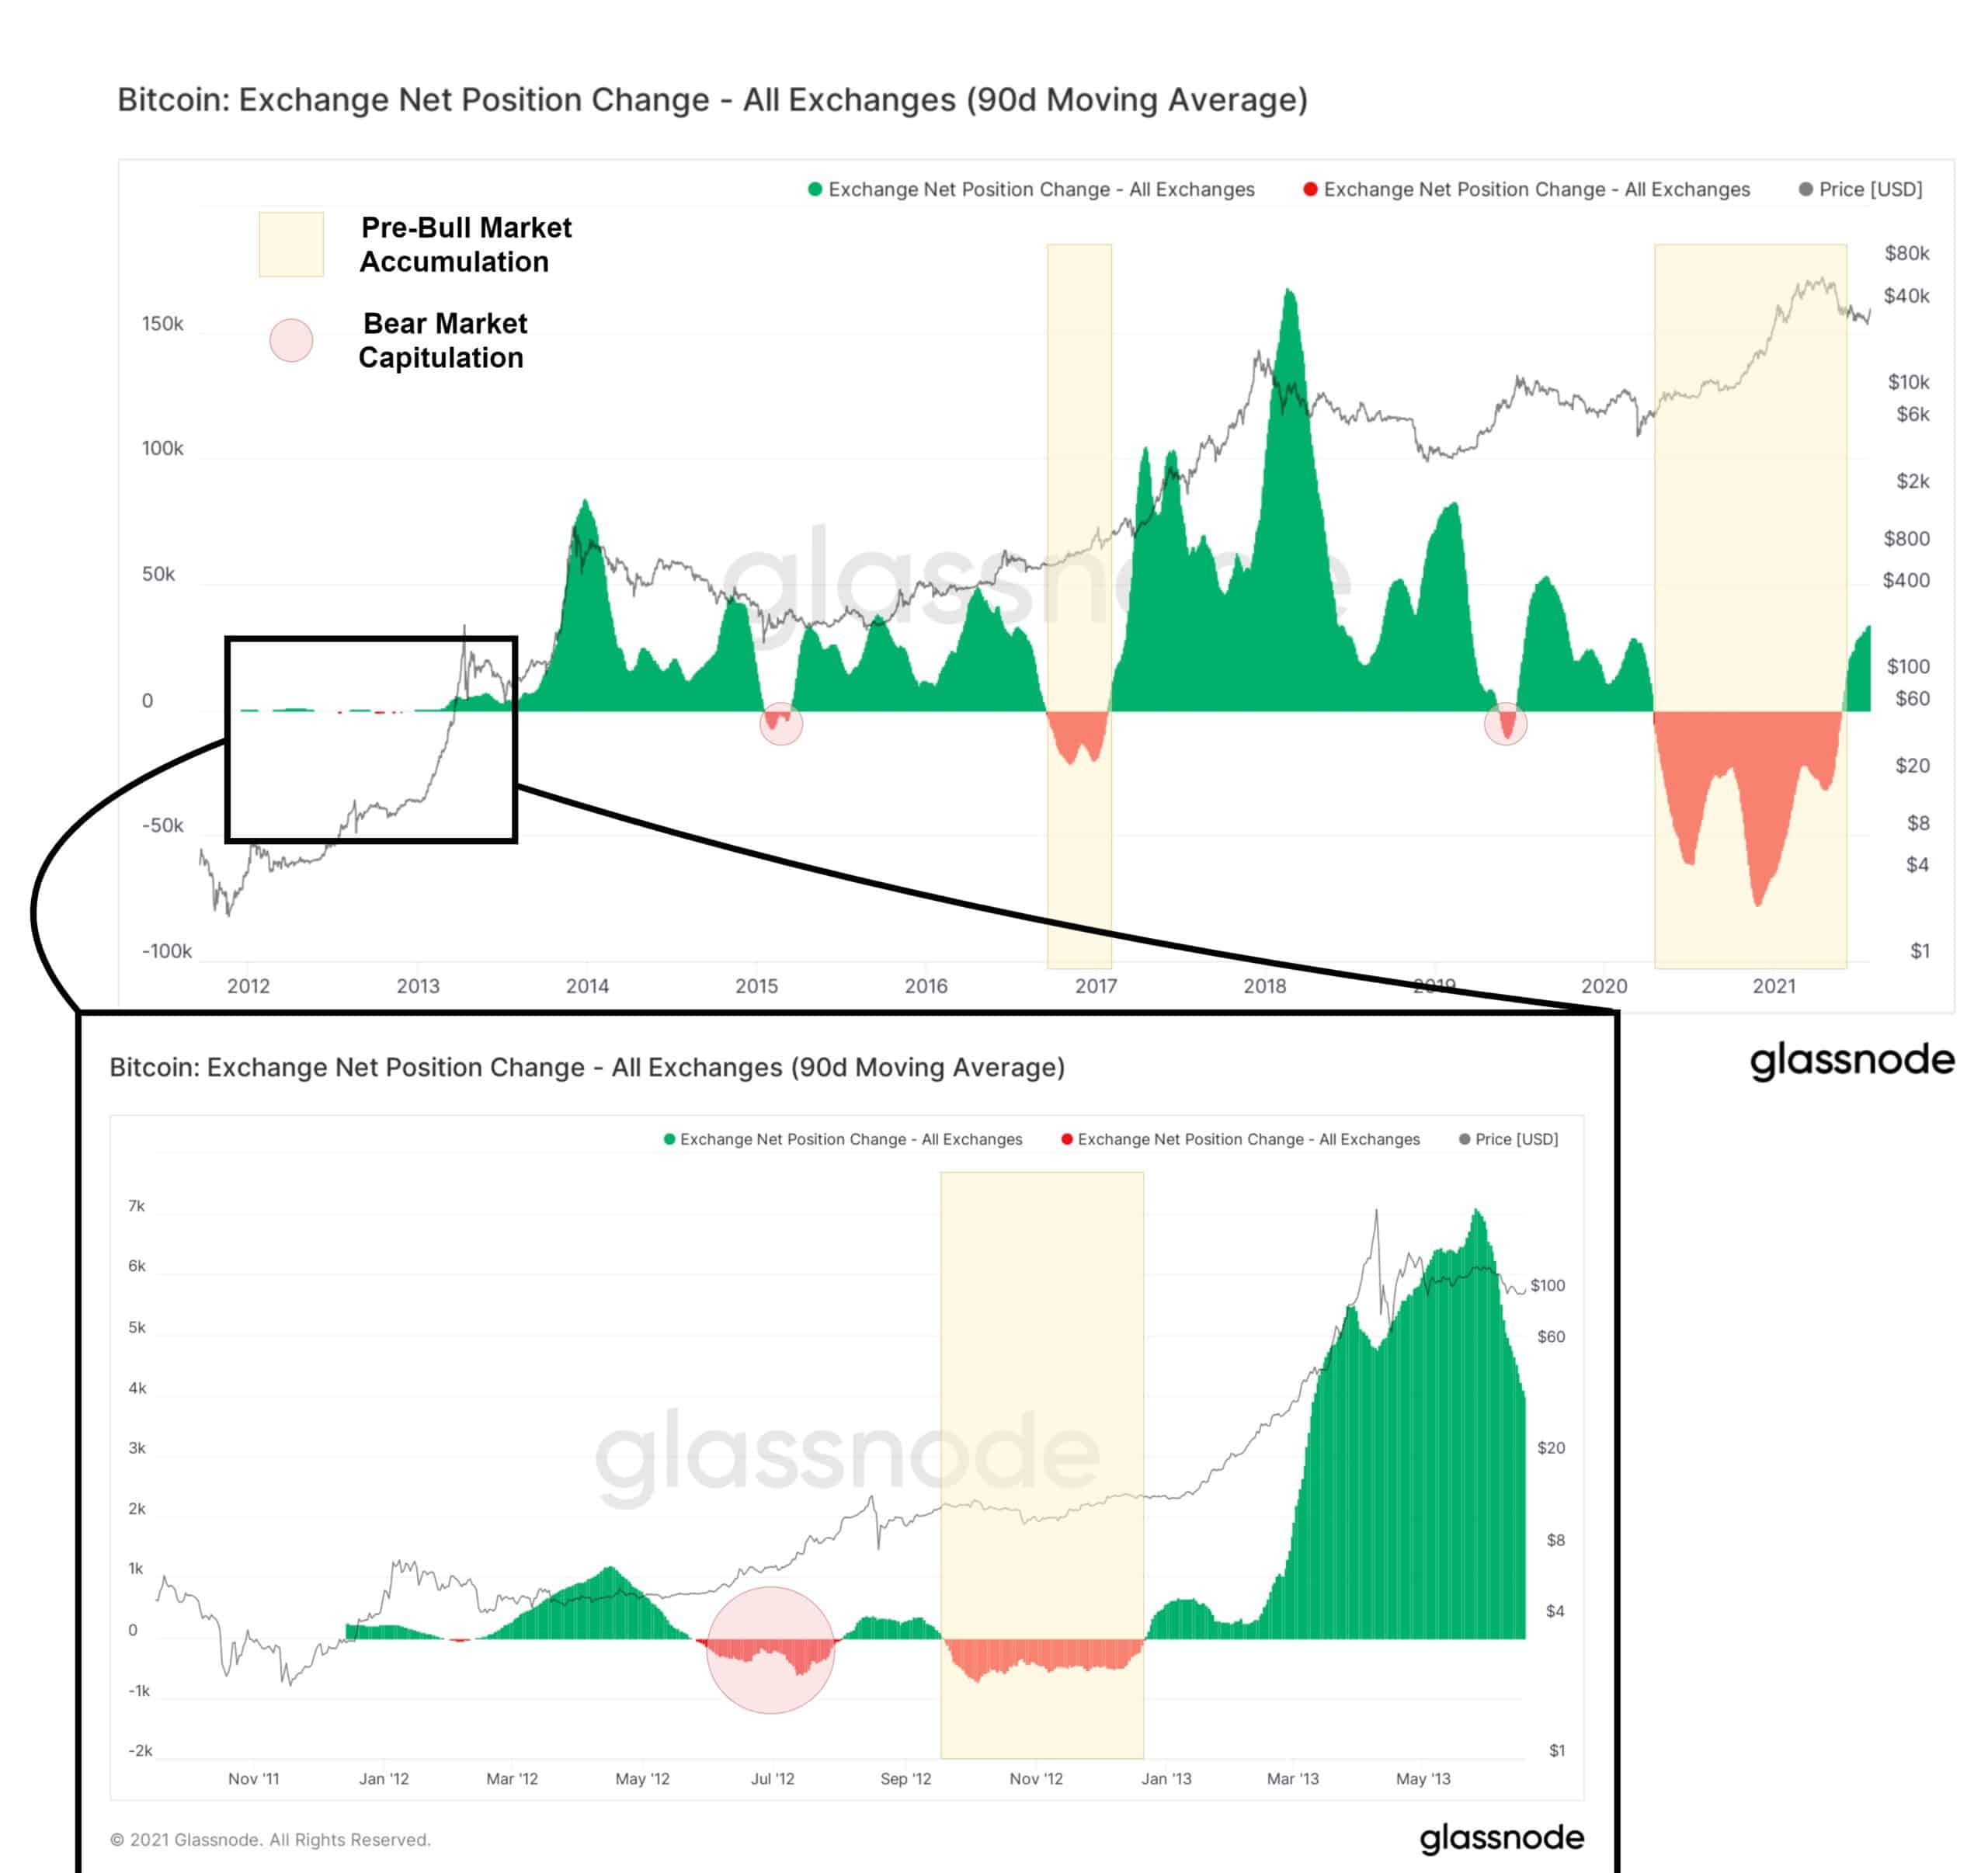
- Around the middle of the cycle, wherein the bearish phase, a significant capitulation usually occurs, and we observe a slight net decline in the exchange’s reserve (red circle)
- Before the significant bull run phase, there’s an enormous negative net change in exchanges’ Bitcoin reserve (yellow rectangle). In practicality, this is an accumulation phase for experienced players in the market. These stakeholders intend to withdraw from exchanges wallets.
- Through the following phase, Euphoria, wherein the prominent entities in the market (whales, institutional players, and smart money) are selling into the market’s strength. Here in this phase, inflowing Bitcoins into exchanges are bought by newcomers who intend to hold their assets on the exchanges.
The first two parts of the above pattern have already occurred in the current cycle. Therefore, assuming Bitcoin repeats the three parts of the cycle, we could be at the beginning of a long bull run, similar more to that of 2013 with a double top formation.
Besides the positive signals from an on-chain viewpoint, the metrics attributed to the activity level on the network still do not promise a robust recovery.
This lack of activity on the network can be observed in the Number of Active Addresses and Number of Transactions. These parameters have fallen because of fear, uncertainty, and doubt (FUD) among newcomers after the recent 50% drop. The primary fuel needed for a bull run is the inflowing capital by these investors who are willing to buy Bitcoin at inflated prices.
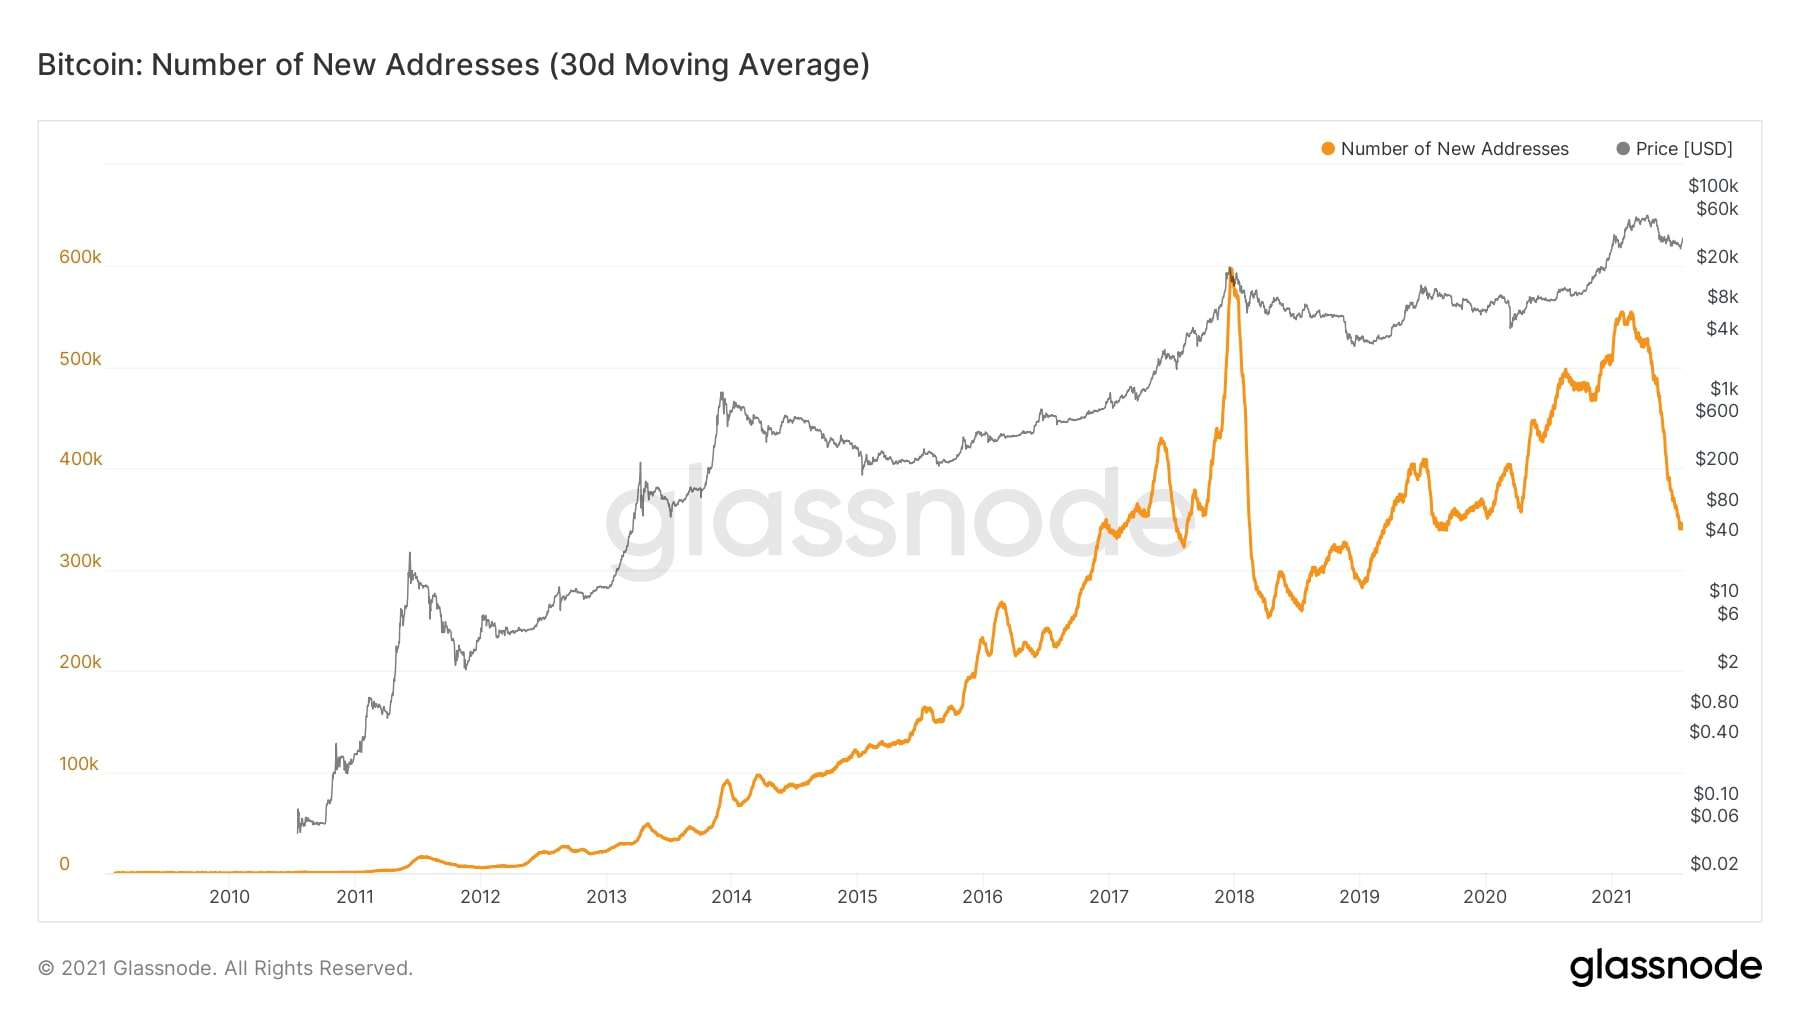
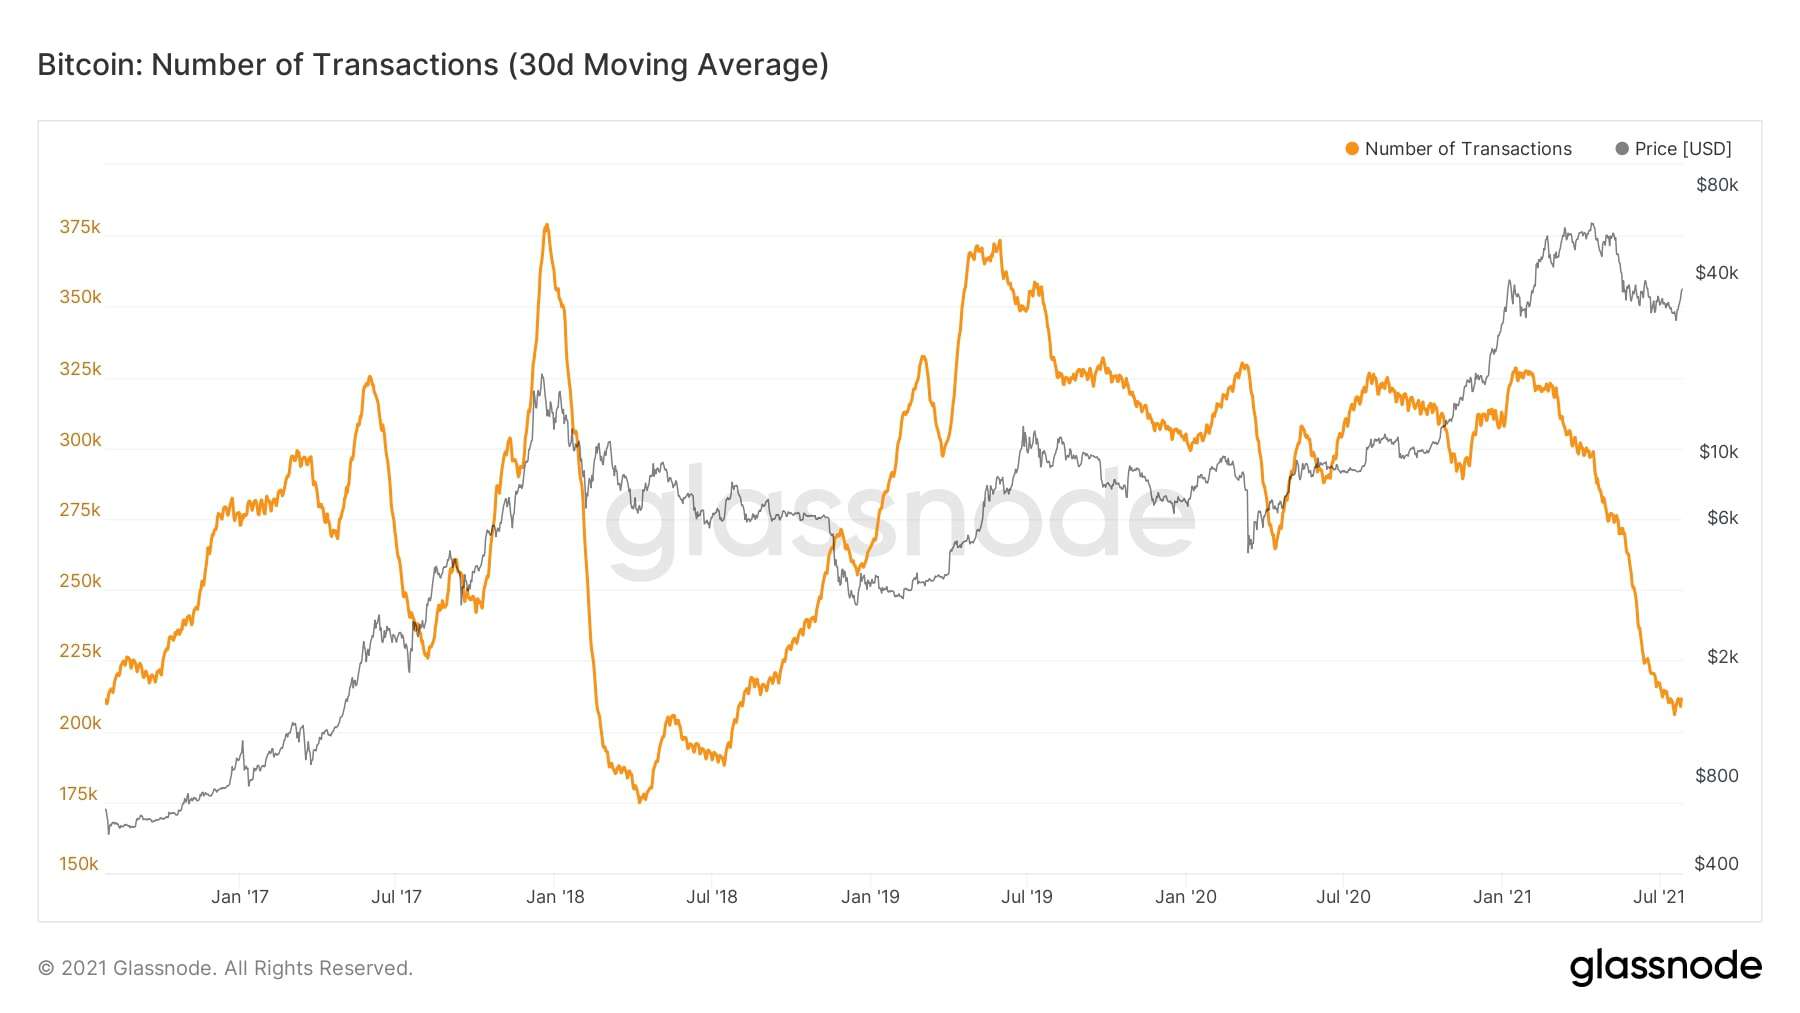
Even though some early evidence, such as supply shock structure, could lead to a healthy rally to a new ATH, some on-chain metrics are still not back to the pre-price crash. The most critical metrics to watch here are the volume, number of transactions, and new addresses on the blockchain.
The above analysis is compiled by on-chain analyst CryptoVizArt for CryptoPotato