Key Support level: ,900 Key Resistance level: ,380 After Bitcoin set a new all-time high at almost ,000, Ethereum broke the ,000 level and looks primed to follow in Bitcoin’s footsteps. It seems as if it is only a matter of time now until ETH will also break its all-time high at ,380 (Bitstamp). The bulls have taken full control of the market, and higher prices are expected for ETH as well. Chart by TradingViewETH Technical Indicators Volume: Sustained volume this week has positioned ETH for a test of the all-time high level. This might happen by the end of the week or even earlier. RSI: On the daily timeframe, the RSI is approaching the top of its channel, indicating a strong bullish move is in play. This is expected to continue as we approach the all-time
Topics:
George Georgiev considers the following as important: ETH Analysis, ETHBTC, Ethereum (ETH) Price, ethusd
This could be interesting, too:
Mandy Williams writes Ethereum Derivatives Metrics Signal Modest Downside Tail Risk Ahead: Nansen
Jordan Lyanchev writes Weekly Bitcoin, Ethereum ETF Recap: Light at the End of the Tunnel for BTC
CryptoVizArt writes Will Weak Momentum Drive ETH to .5K? (Ethereum Price Analysis)
Jordan Lyanchev writes Bybit Hack Fallout: Arthur Hayes, Samson Mow Push for Ethereum Rollback
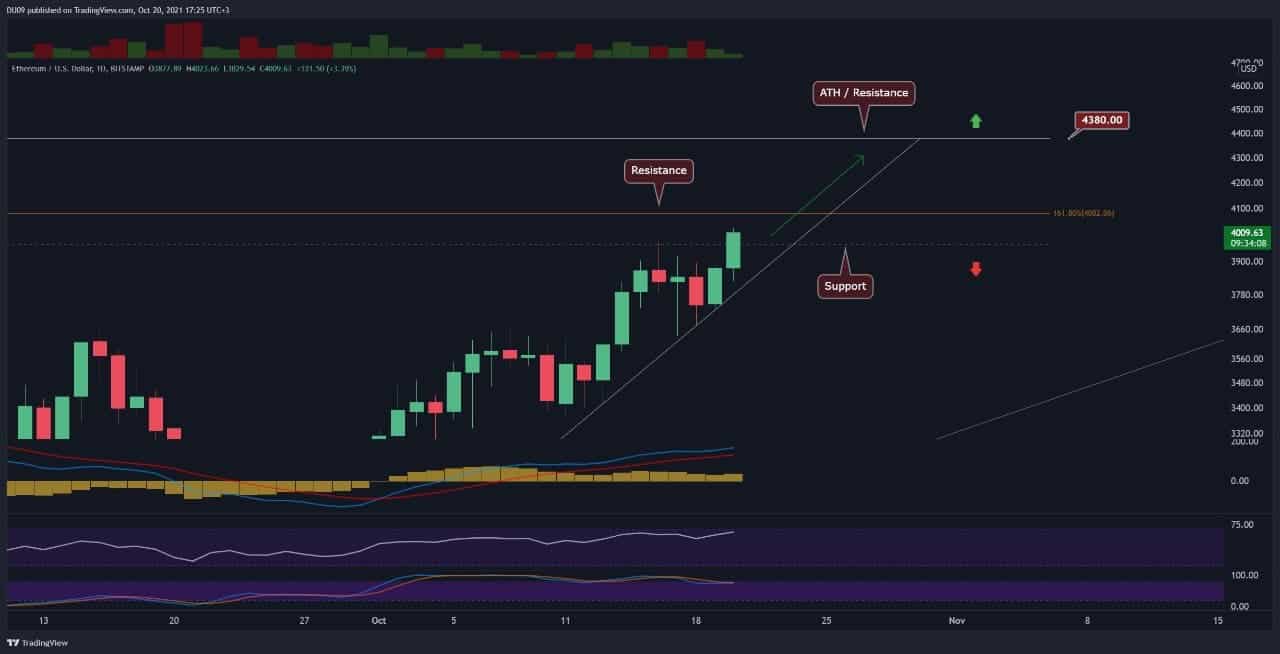
Key Support level: $3,900
Key Resistance level: $4,380
After Bitcoin set a new all-time high at almost $67,000, Ethereum broke the $4,000 level and looks primed to follow in Bitcoin’s footsteps. It seems as if it is only a matter of time now until ETH will also break its all-time high at $4,380 (Bitstamp). The bulls have taken full control of the market, and higher prices are expected for ETH as well.
ETH Technical Indicators
Volume: Sustained volume this week has positioned ETH for a test of the all-time high level. This might happen by the end of the week or even earlier.
RSI: On the daily timeframe, the RSI is approaching the top of its channel, indicating a strong bullish move is in play. This is expected to continue as we approach the all-time high resistance.
MACD: The moving averages have expanded today on the daily timeframe, and the histogram is firmly placed on the positive side. This is bullish, and there are no signs this can change at this time. Still, it’s important to remain vigilant and watch out for a pullback once we approach the all-time high.
ETH Bias
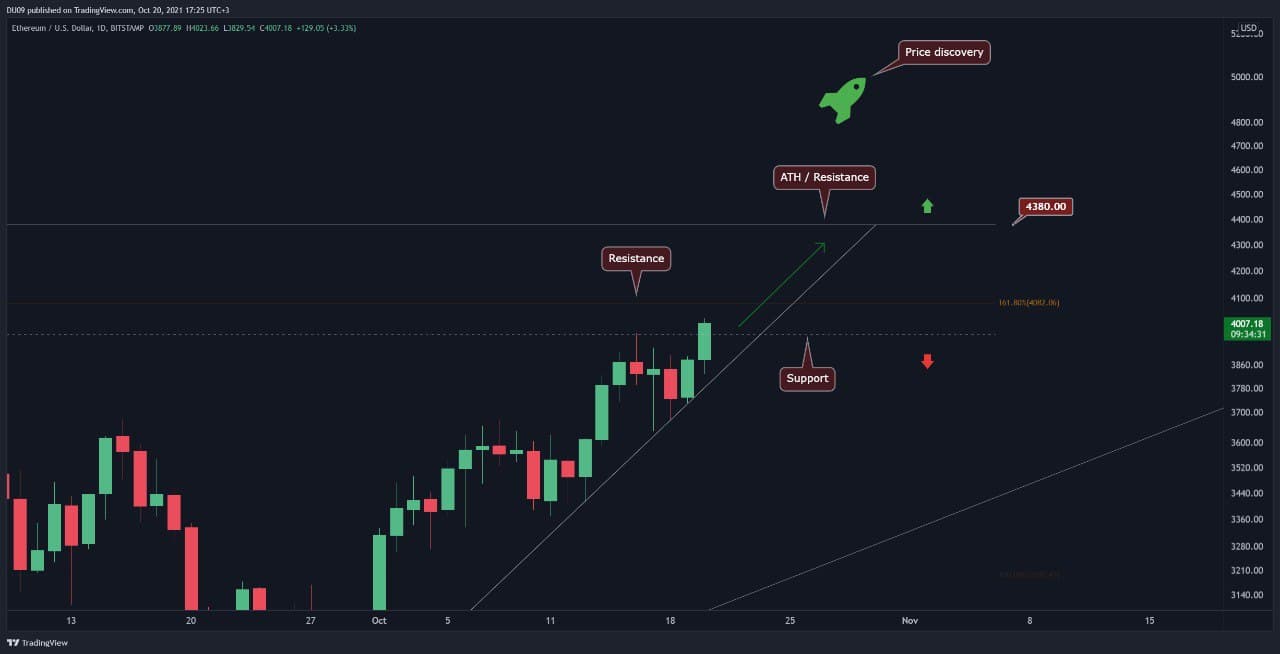
The ETH bias can be currently considered as very bullish with an expectation that price will eventually break above the key resistance and enter price discovery in search of a new all-time high. As we approach $4,380, ETH may consolidate just under this level before a breakthrough takes place.
Short-Term Price Prediction for ETH Price
At this time, the only resistance left for ETH is the $4,380 level. The price might continue its rally towards $5K until profit-taking takes place. At that point, a brief consolidation could take place before ETH potentially breaks out in search of new levels.
Psychological round numbers like $5,000, $6,000 are key areas to keep an eye on once we break into price discovery.