Bitcoin closed the week with the second-largest red candle in its entire history, testing lows near the k price zone following an ATH of K recorded in the previous week. Overall, this was a tough week for markets across the board. From stocks to cryptocurrencies, traders experienced an episode of collective panic marked by the rumor that Joe Biden would be preparing a bill to increase capital gains taxes by almost 100% for all those generating more than million in profits. BTC Registers Its Second-Largest Red Candelstick Ever The news caused a widespread drop in the most important financial indices in the United States and other countries. And cryptocurrencies had an even worse reaction, with Bitcoin confirming its downtrend after breaking the support of a channel
Topics:
Felix Mollen considers the following as important: AA News, Bitcoin (BTC) Price, Bitcoin Bear Market, BTCEUR, BTCGBP, btcusd, btcusdt
This could be interesting, too:
Chayanika Deka writes Yuga Labs Secures Major Win as SEC Closes Investigation Without Charges
Andrew Throuvalas writes Bitcoin Soars Back To ,000 After BlackRock CEO Says “Buy The Dip”
Chayanika Deka writes XRP, SOL, and ADA Inclusion in US Crypto Reserve Pushes Traders on Edge
Chayanika Deka writes Why Arthur Hayes Is Bullish on Bitcoin Under Trump’s Economic Strategy
Bitcoin closed the week with the second-largest red candle in its entire history, testing lows near the $47k price zone following an ATH of $64K recorded in the previous week.
Overall, this was a tough week for markets across the board. From stocks to cryptocurrencies, traders experienced an episode of collective panic marked by the rumor that Joe Biden would be preparing a bill to increase capital gains taxes by almost 100% for all those generating more than $1 million in profits.
BTC Registers Its Second-Largest Red Candelstick Ever
The news caused a widespread drop in the most important financial indices in the United States and other countries. And cryptocurrencies had an even worse reaction, with Bitcoin confirming its downtrend after breaking the support of a channel initiated in late 2020.
Today’s drop puts Bitcoin at $48,000 with lows of $47044, according to Tradingview data. For the first time, the 10-period moving average and the 55-period moving average are crossing to the downside, which could indicate that the bullish trend is getting weaker, at least temporarily.
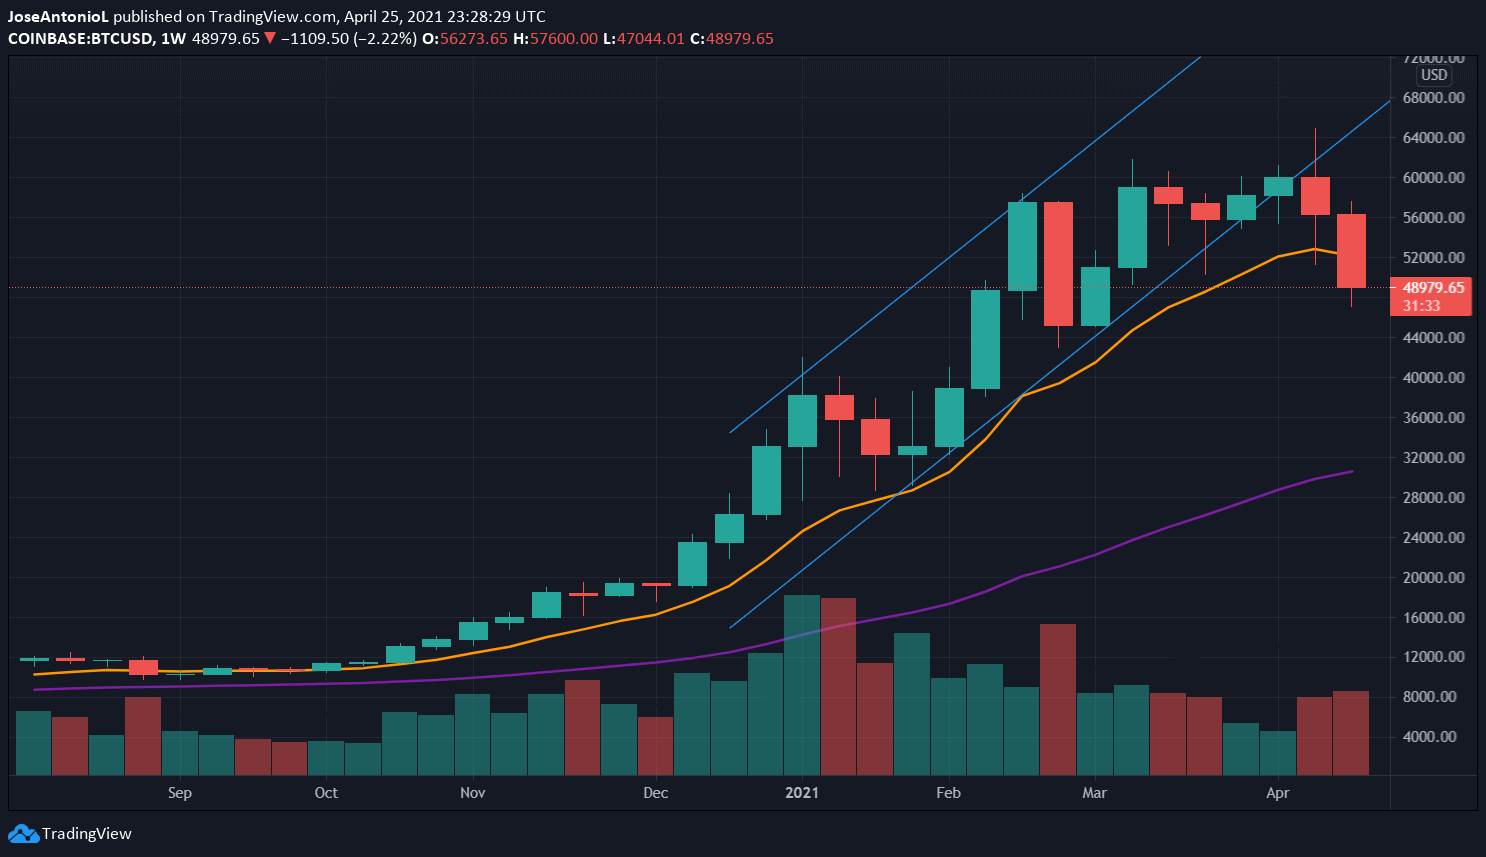
Bitcoin lost just over 5% in the last 24 hours, and 13% over the previous 7 days. With near $8.000 lost, this would be the most significant gross price decrease in history, even though it has seen worst declines in terms of price proportions. To put things in context, a $10 drop when Bitcoin was traded at $100 was proportionally worse than a $1000 drop when Bitcoin was priced at $60,000.
Bitcoin Has Not Been This Oversold Since The 2020 Panic Episode of the COVID-19 Crisis
Indicators show that traders have not yet recovered from the panic episode of the previous days. Bitcoin has not been this oversold since mid-March last year, when fears of a widespread crisis due to the coronavirus pandemic drove markets to the subsoil.
The RSI is an metric that signals whether there is a balance between buyers and sellers. It is currently in the order of 25 points out of 100. That is, there are 25 people placing buy orders vs. 75 people placing sell orders for the same value.

This means that traders are currently looking to exit their positions to increase their holdings of fiat, commodities, or perhaps even altcoins.
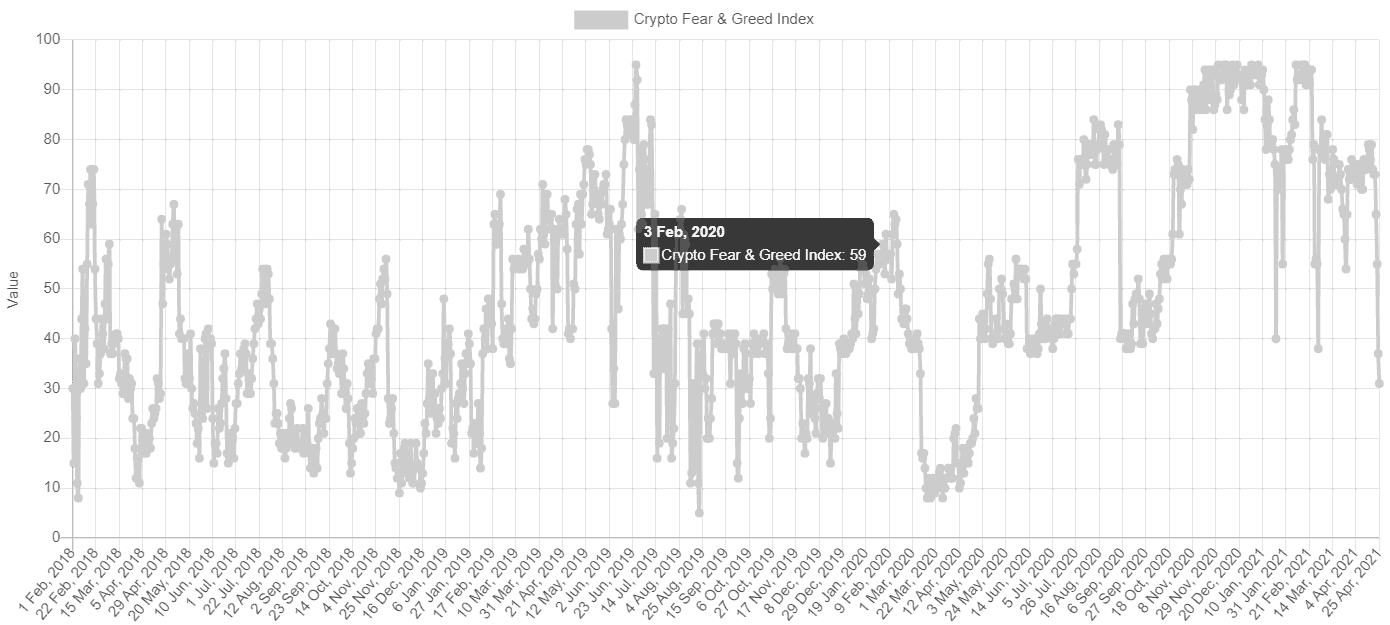
A similar sentiment is shown by the Crypto Fear & Greed Index, which is at its lowest level in a year, indicating that investors’ fear of losing money with Bitcoin hasn’t been this strong since the March 2020 crash.
However, a low RSI is -generally- a bullish sign. In theory, markets tend to achieve equilibrium after such periods of euphoria with a correction to the contrary.