Earlier today, Bitcoin price managed to rise by over ,000 as it bounced from ,800 to reach a daily high of around ,900, according to BItstamp. However, as of writing these lines, BTC failed to hold and retraced down below the crucial support turned resistance level of ,000.As of writing these lines, Bitcoin had failed to close the 4-hour candle above the resistance at a short term bearish .5 Fib Retracement of ,450. As of now, it struggles to maintain the critical area of K.Looking at the bigger picture, Bitcoin recovered nicely over the past 24 hours, after another retest of the K – K support area. As mentioned here yesterday, the latter is the lower angle of a bearish triangle. On the longer scale, if Bitcoin losses the crucial support around the K range, then
Topics:
Yaz Sheikh considers the following as important: Bitcoin (BTC) Price, BTC Analysis, BTCEUR, BTCGBP, btcusd, btcusdt
This could be interesting, too:
Chayanika Deka writes XRP, SOL, and ADA Inclusion in US Crypto Reserve Pushes Traders on Edge
Chayanika Deka writes Why Arthur Hayes Is Bullish on Bitcoin Under Trump’s Economic Strategy
Mandy Williams writes Why the Bitcoin Market Is Stuck—and the Key Metric That Could Change It: CryptoQuant CEO
Wayne Jones writes Metaplanet Acquires 156 BTC, Bringing Total Holdings to 2,391
Earlier today, Bitcoin price managed to rise by over $2,000 as it bounced from $32,800 to reach a daily high of around $34,900, according to BItstamp. However, as of writing these lines, BTC failed to hold and retraced down below the crucial support turned resistance level of $34,000.
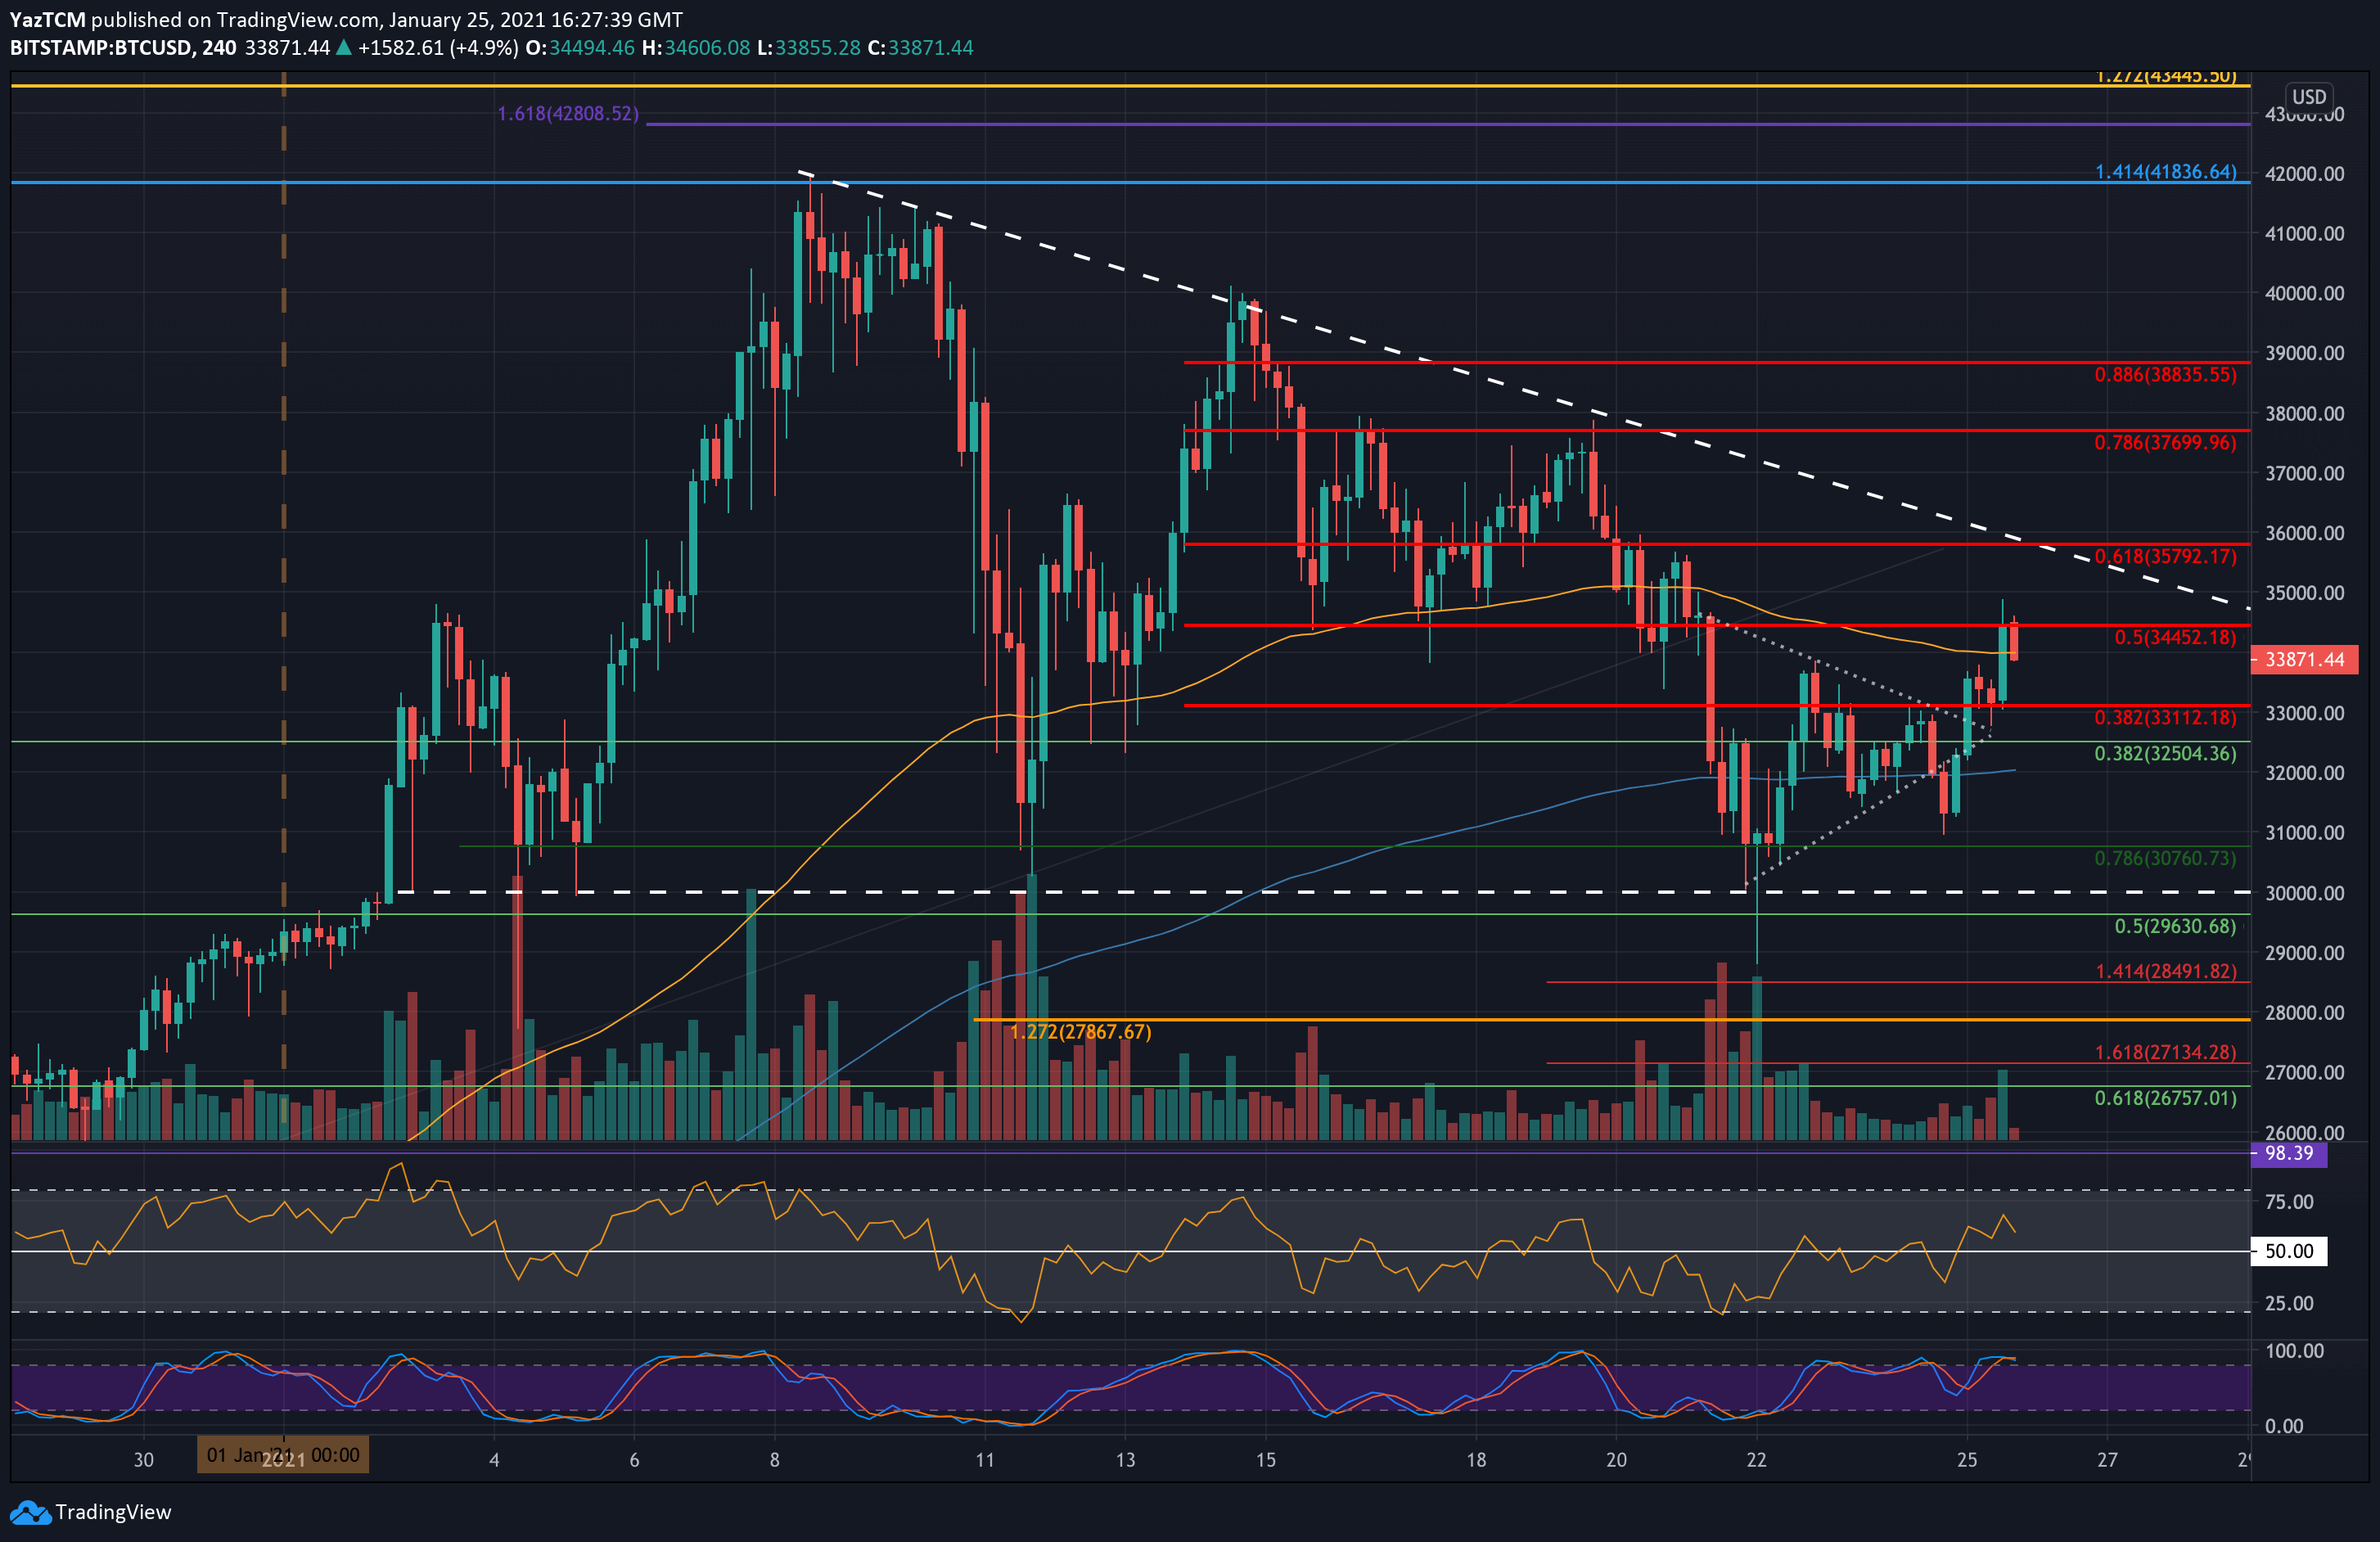
As of writing these lines, Bitcoin had failed to close the 4-hour candle above the resistance at a short term bearish .5 Fib Retracement of $34,450. As of now, it struggles to maintain the critical area of $34K.
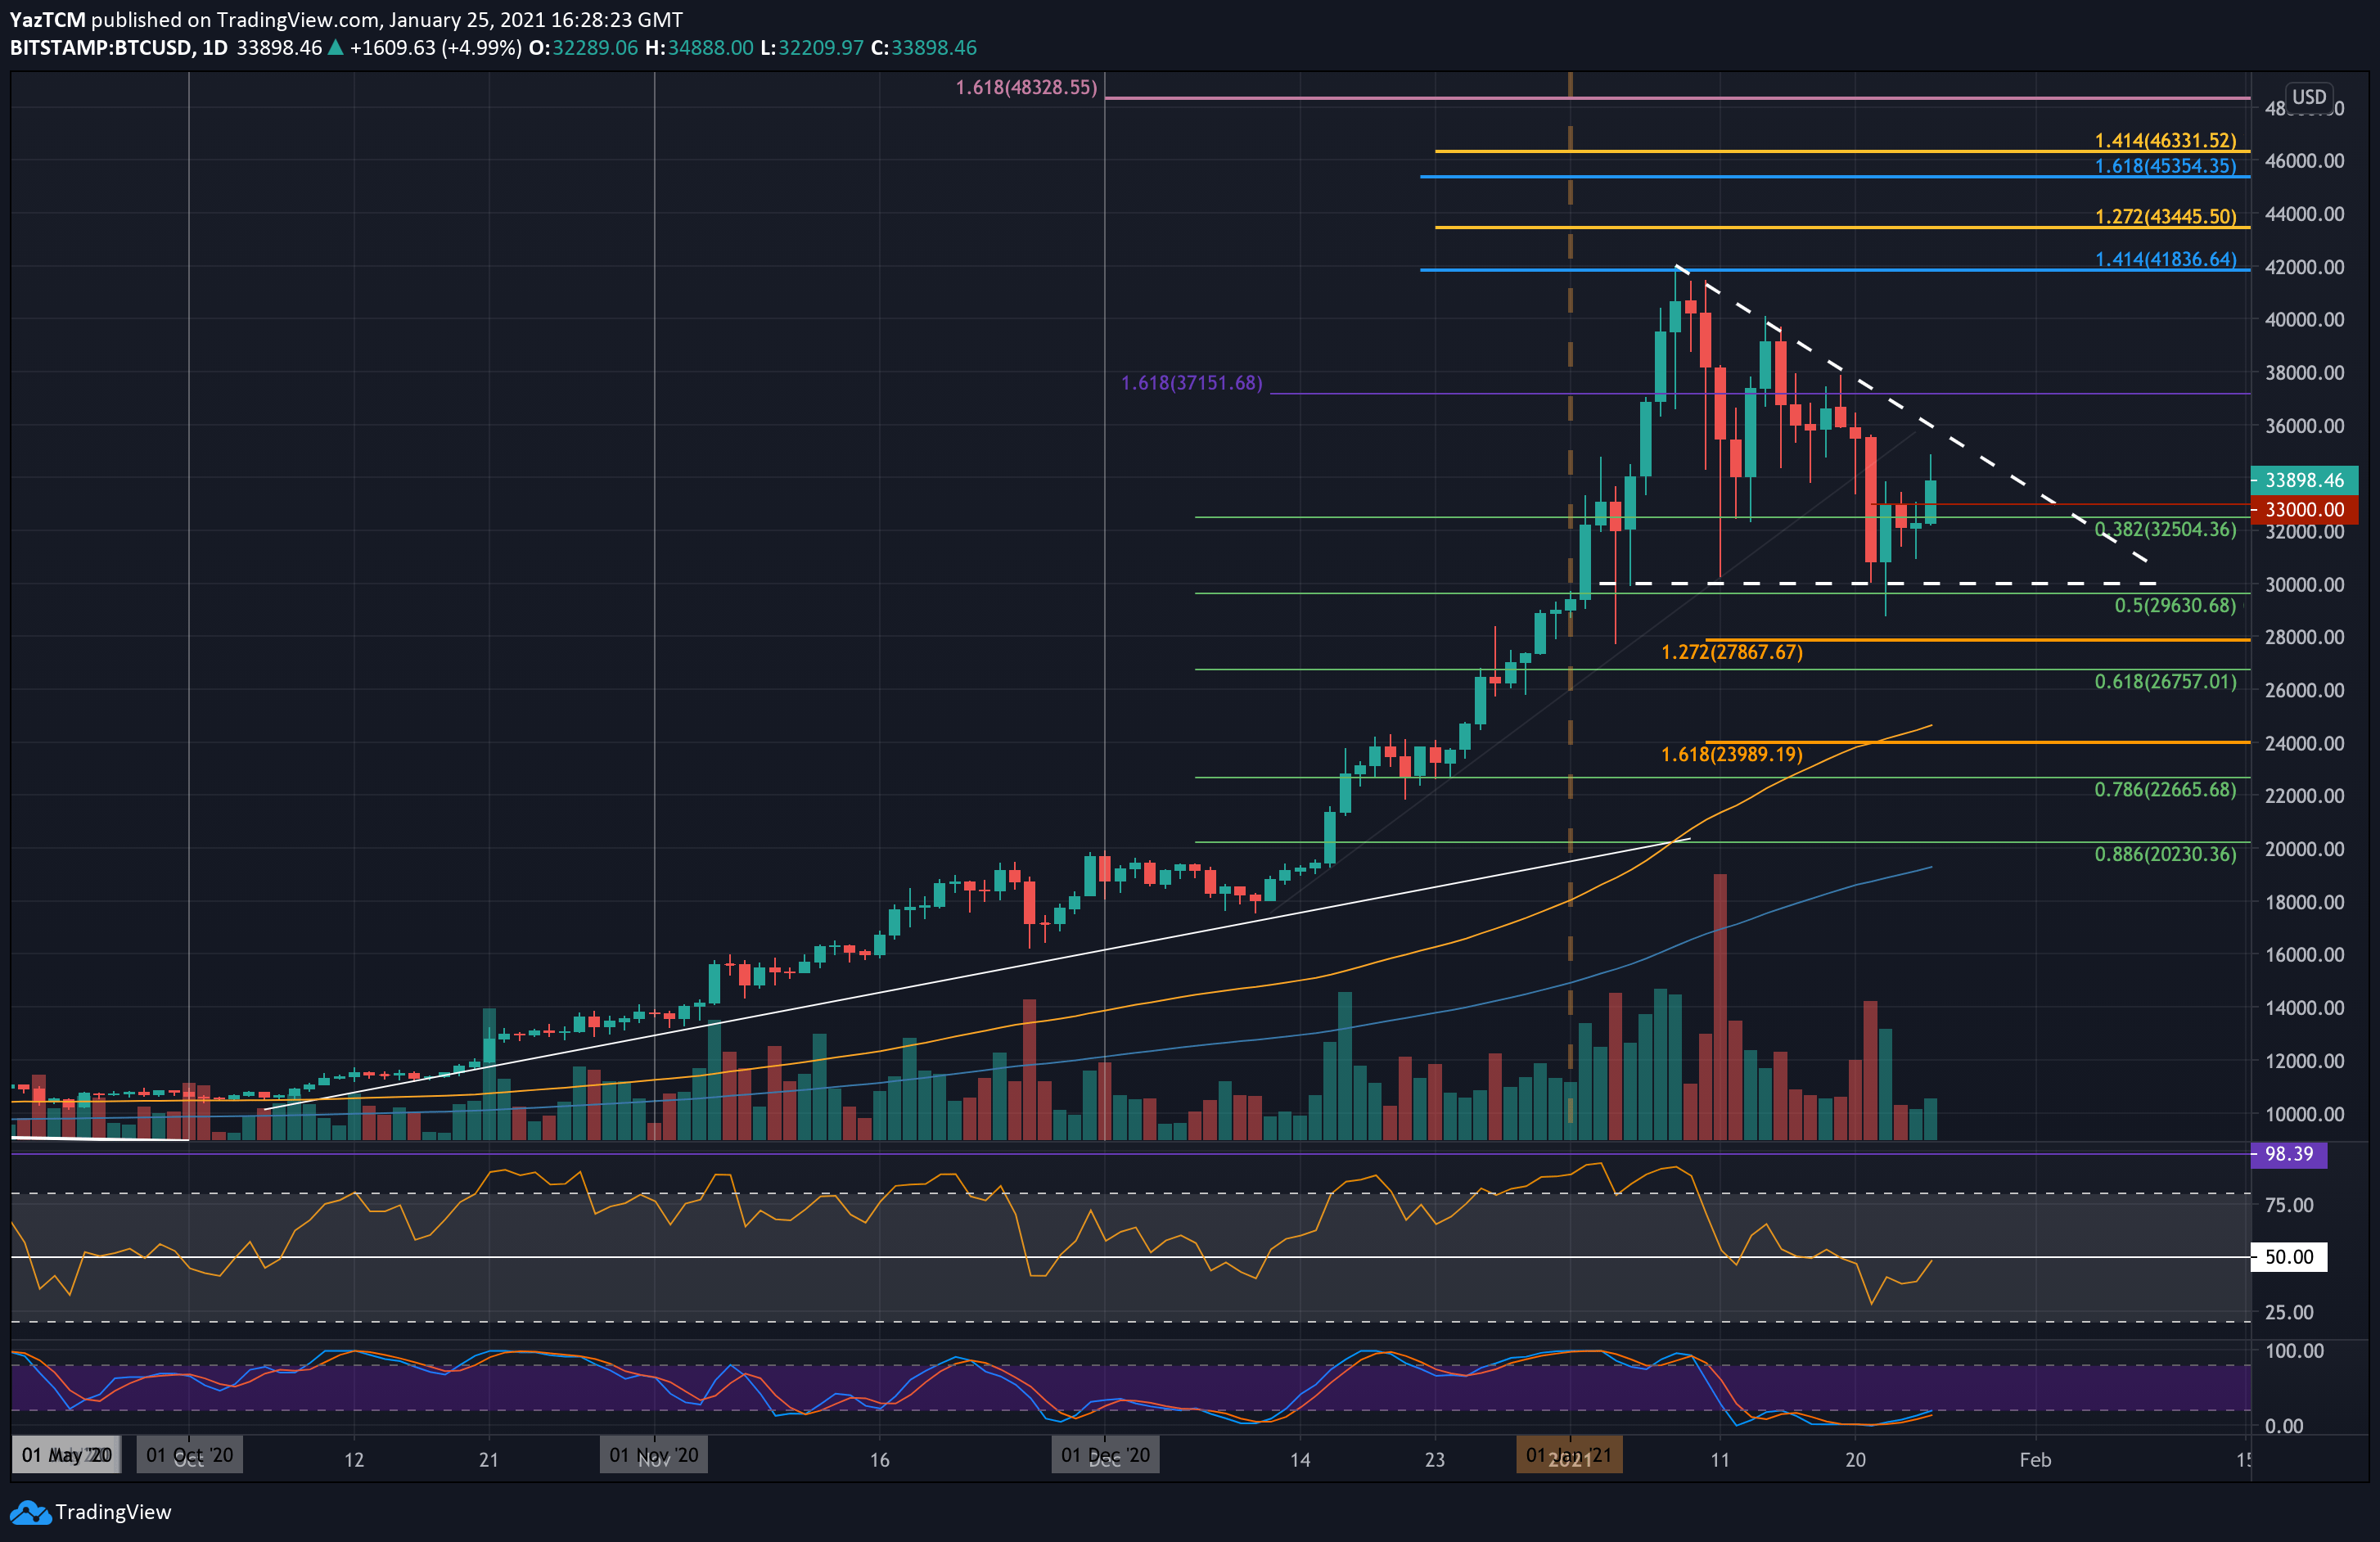
Looking at the bigger picture, Bitcoin recovered nicely over the past 24 hours, after another retest of the $30K – $31K support area. As mentioned here yesterday, the latter is the lower angle of a bearish triangle. On the longer scale, if Bitcoin losses the crucial support around the $30K range, then we can expect a retest of lower price areas – $26K and even $24K.
From the bullish side, Bitcoin would need to break $34,450 in order to aim for the major resistance at the upper angle of the bearish triangle, as can be seen on the Daily chart below.
BTC Price Support and Resistance Levels to Watch
Key Support Levels: $33,100, $32,500, $32,000, $31,000, $30,760.
Key Resistance Levels: $34,000, $34,450, $35,00, $35,500 – $35,800, $37,900.
Looking ahead, the first level of resistance lies at $34,000, followed by $34,450 (bearish .5 Fib). Further above lies $35,000, $35,500 (the upper angle of the triangle), and $35,800 (bearish .618 Fib).
On the other side, the first level of support lies at $33,100 (yesterday’s low). This is followed by $32,500 (long term .5 Fib), $32,000, $31,000, and $30,760 (short term .786 Fib, and yesterday’s low). Further down lies support at $30,000 (base of descending triangle), $29,630 (.5 Fib), and $29,000.
The daily RSI returned to the midline, indicating indecision within the BTC market.
Bitstamp BTC/USD Daily Chart
Bitstamp BTC/USD 4-Hour Chart