Bitcoin is up by a whopping 25% during the week as the primary cryptocurrency reached over K yesterday – the highest point since June 15, 2021. As shown on the charts below, BTC price broke above a falling wedge formation toward the end of last week and eventually managed to climb above the key resistance level provided 20-day MA on Friday. Then, the price continued over the weekend to finally have a daily close (Sunday) above the 50-day MA, for the first time since May 9. Yesterday, BTC surged by an impressive 15% from the low of ,280 to the high at ,500. Unfortunately, it met resistance there at a bearish .382 Fib, along with the 100-day moving average line, and ended up dropping lower to close the daily candle at ,300. Today, after finding support amid an
Topics:
Yaz Sheikh considers the following as important: Bitcoin (BTC) Price, BTC Analysis, BTCEUR, BTCGBP, btcusd, btcusdt
This could be interesting, too:
Chayanika Deka writes XRP, SOL, and ADA Inclusion in US Crypto Reserve Pushes Traders on Edge
Chayanika Deka writes Why Arthur Hayes Is Bullish on Bitcoin Under Trump’s Economic Strategy
Mandy Williams writes Why the Bitcoin Market Is Stuck—and the Key Metric That Could Change It: CryptoQuant CEO
Wayne Jones writes Metaplanet Acquires 156 BTC, Bringing Total Holdings to 2,391
Bitcoin is up by a whopping 25% during the week as the primary cryptocurrency reached over $40K yesterday – the highest point since June 15, 2021.
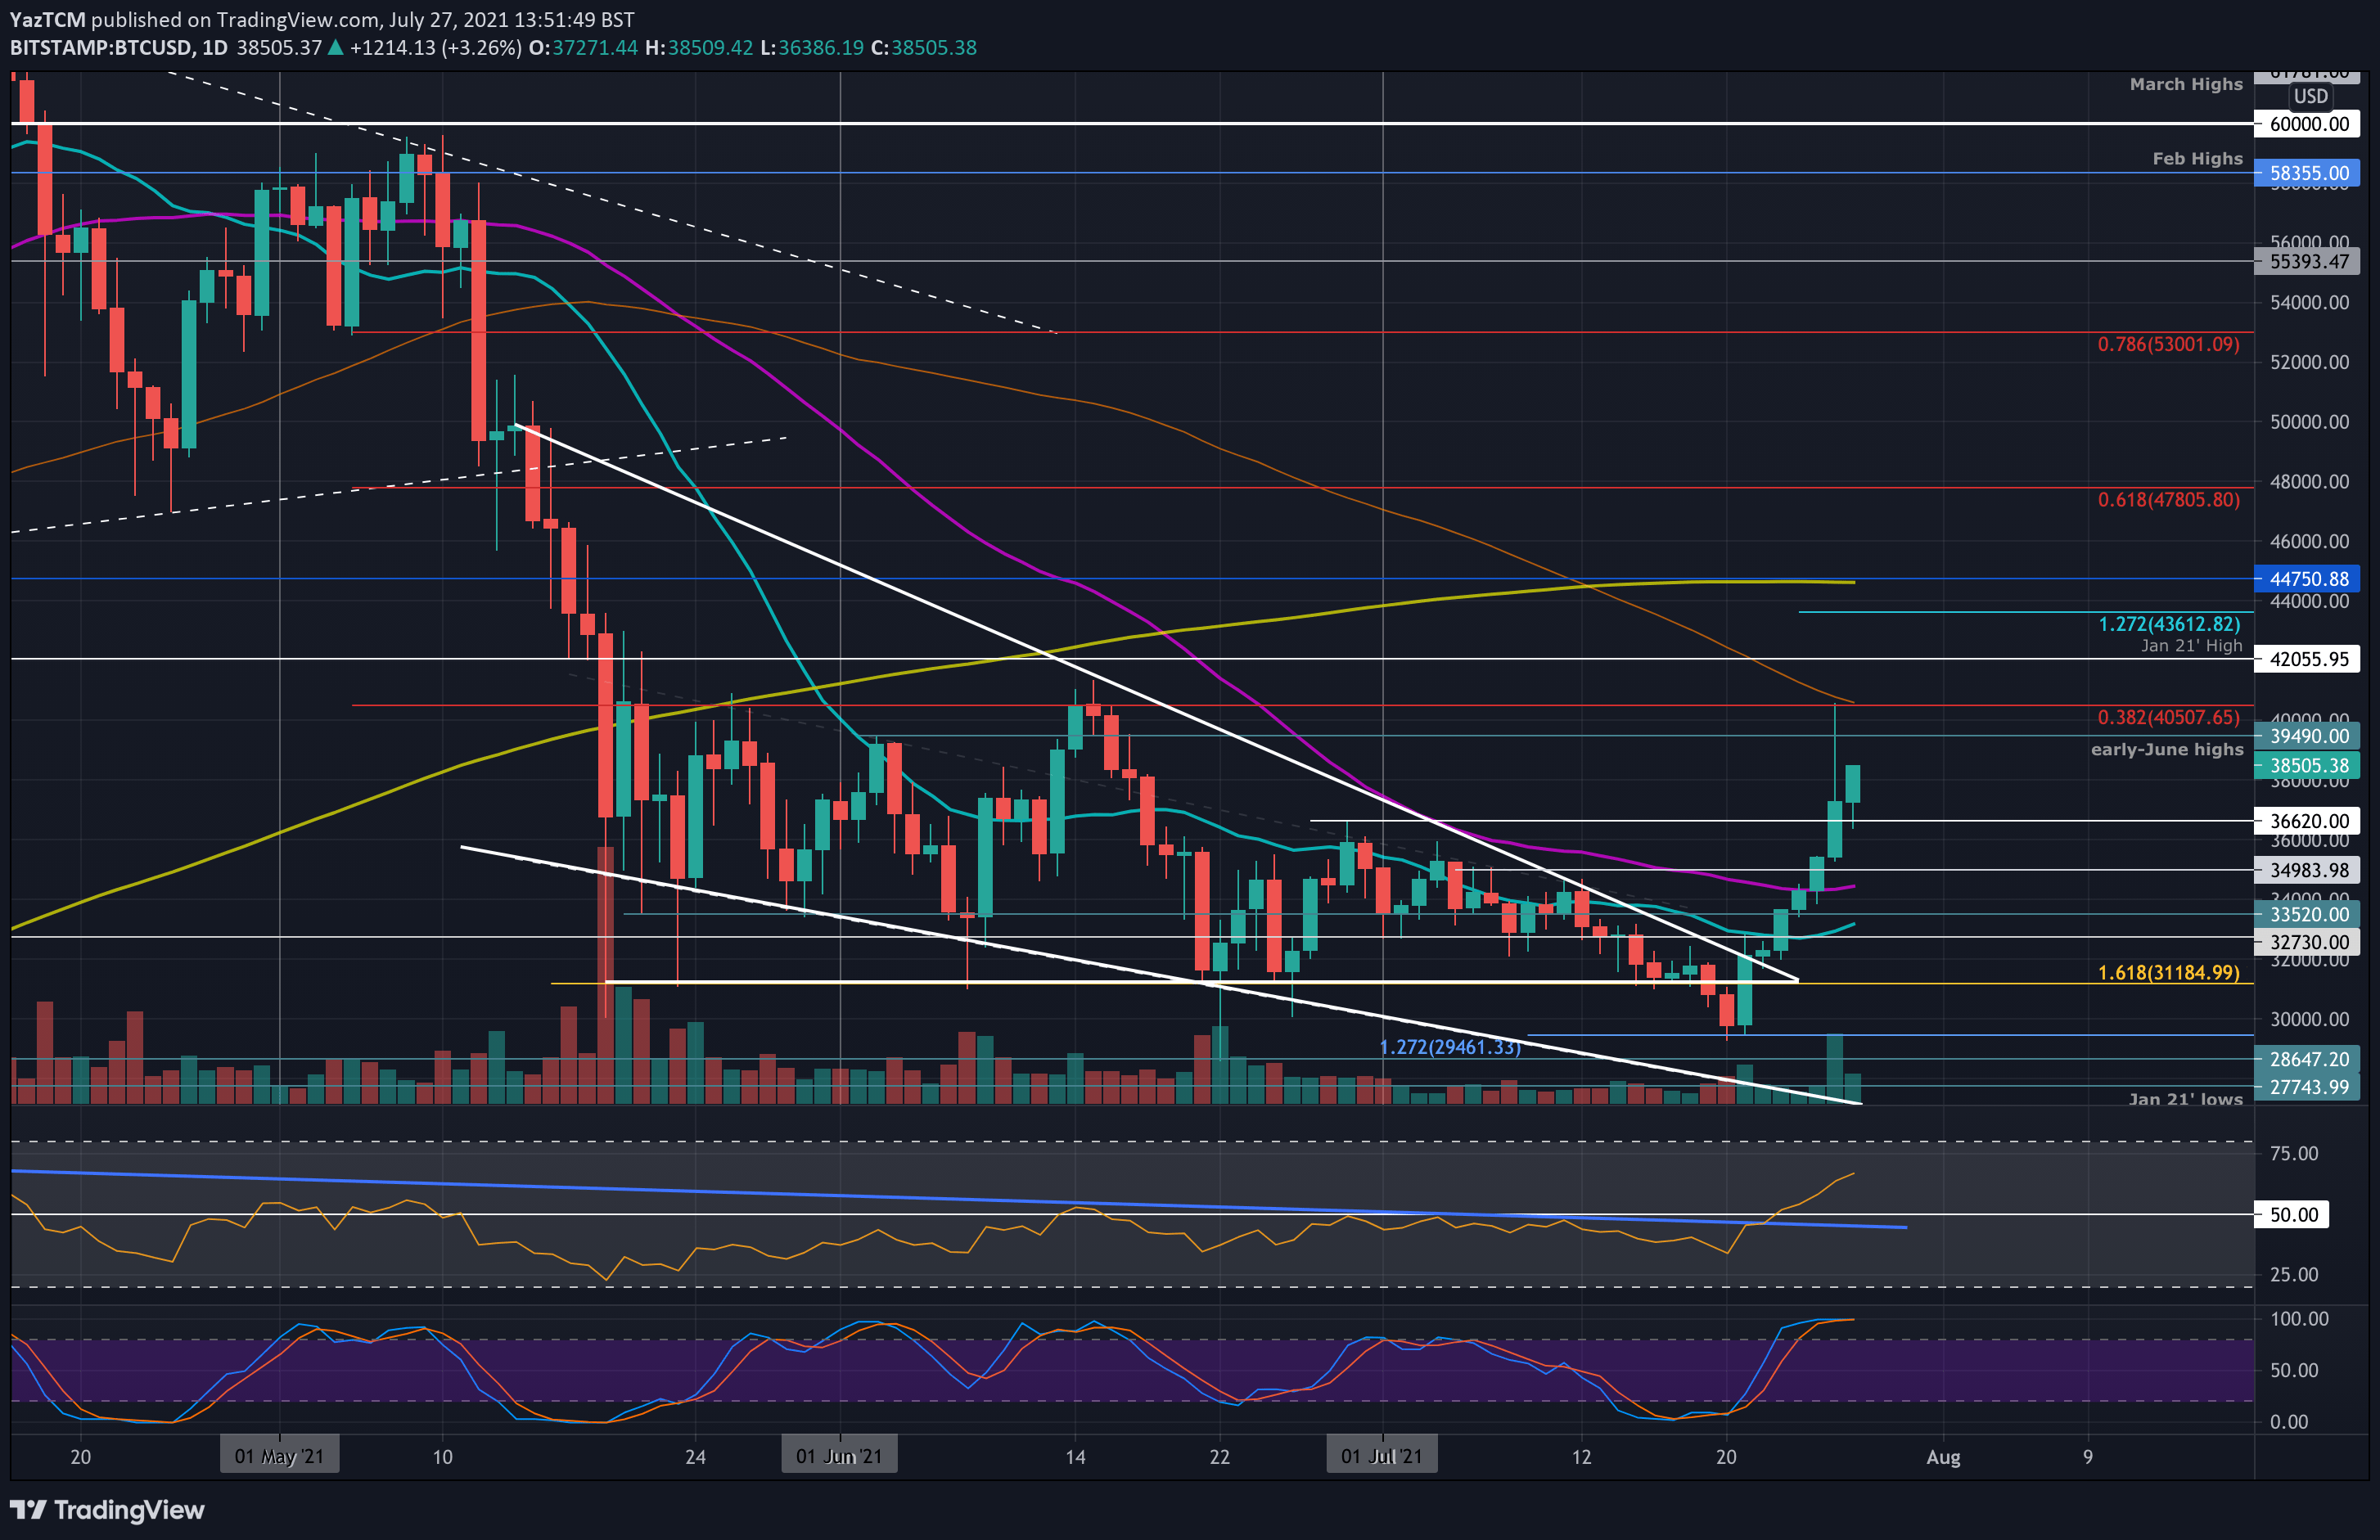
As shown on the charts below, BTC price broke above a falling wedge formation toward the end of last week and eventually managed to climb above the key resistance level provided 20-day MA on Friday.
Then, the price continued over the weekend to finally have a daily close (Sunday) above the 50-day MA, for the first time since May 9. Yesterday, BTC surged by an impressive 15% from the low of $35,280 to the high at $40,500. Unfortunately, it met resistance there at a bearish .382 Fib, along with the 100-day moving average line, and ended up dropping lower to close the daily candle at $37,300.
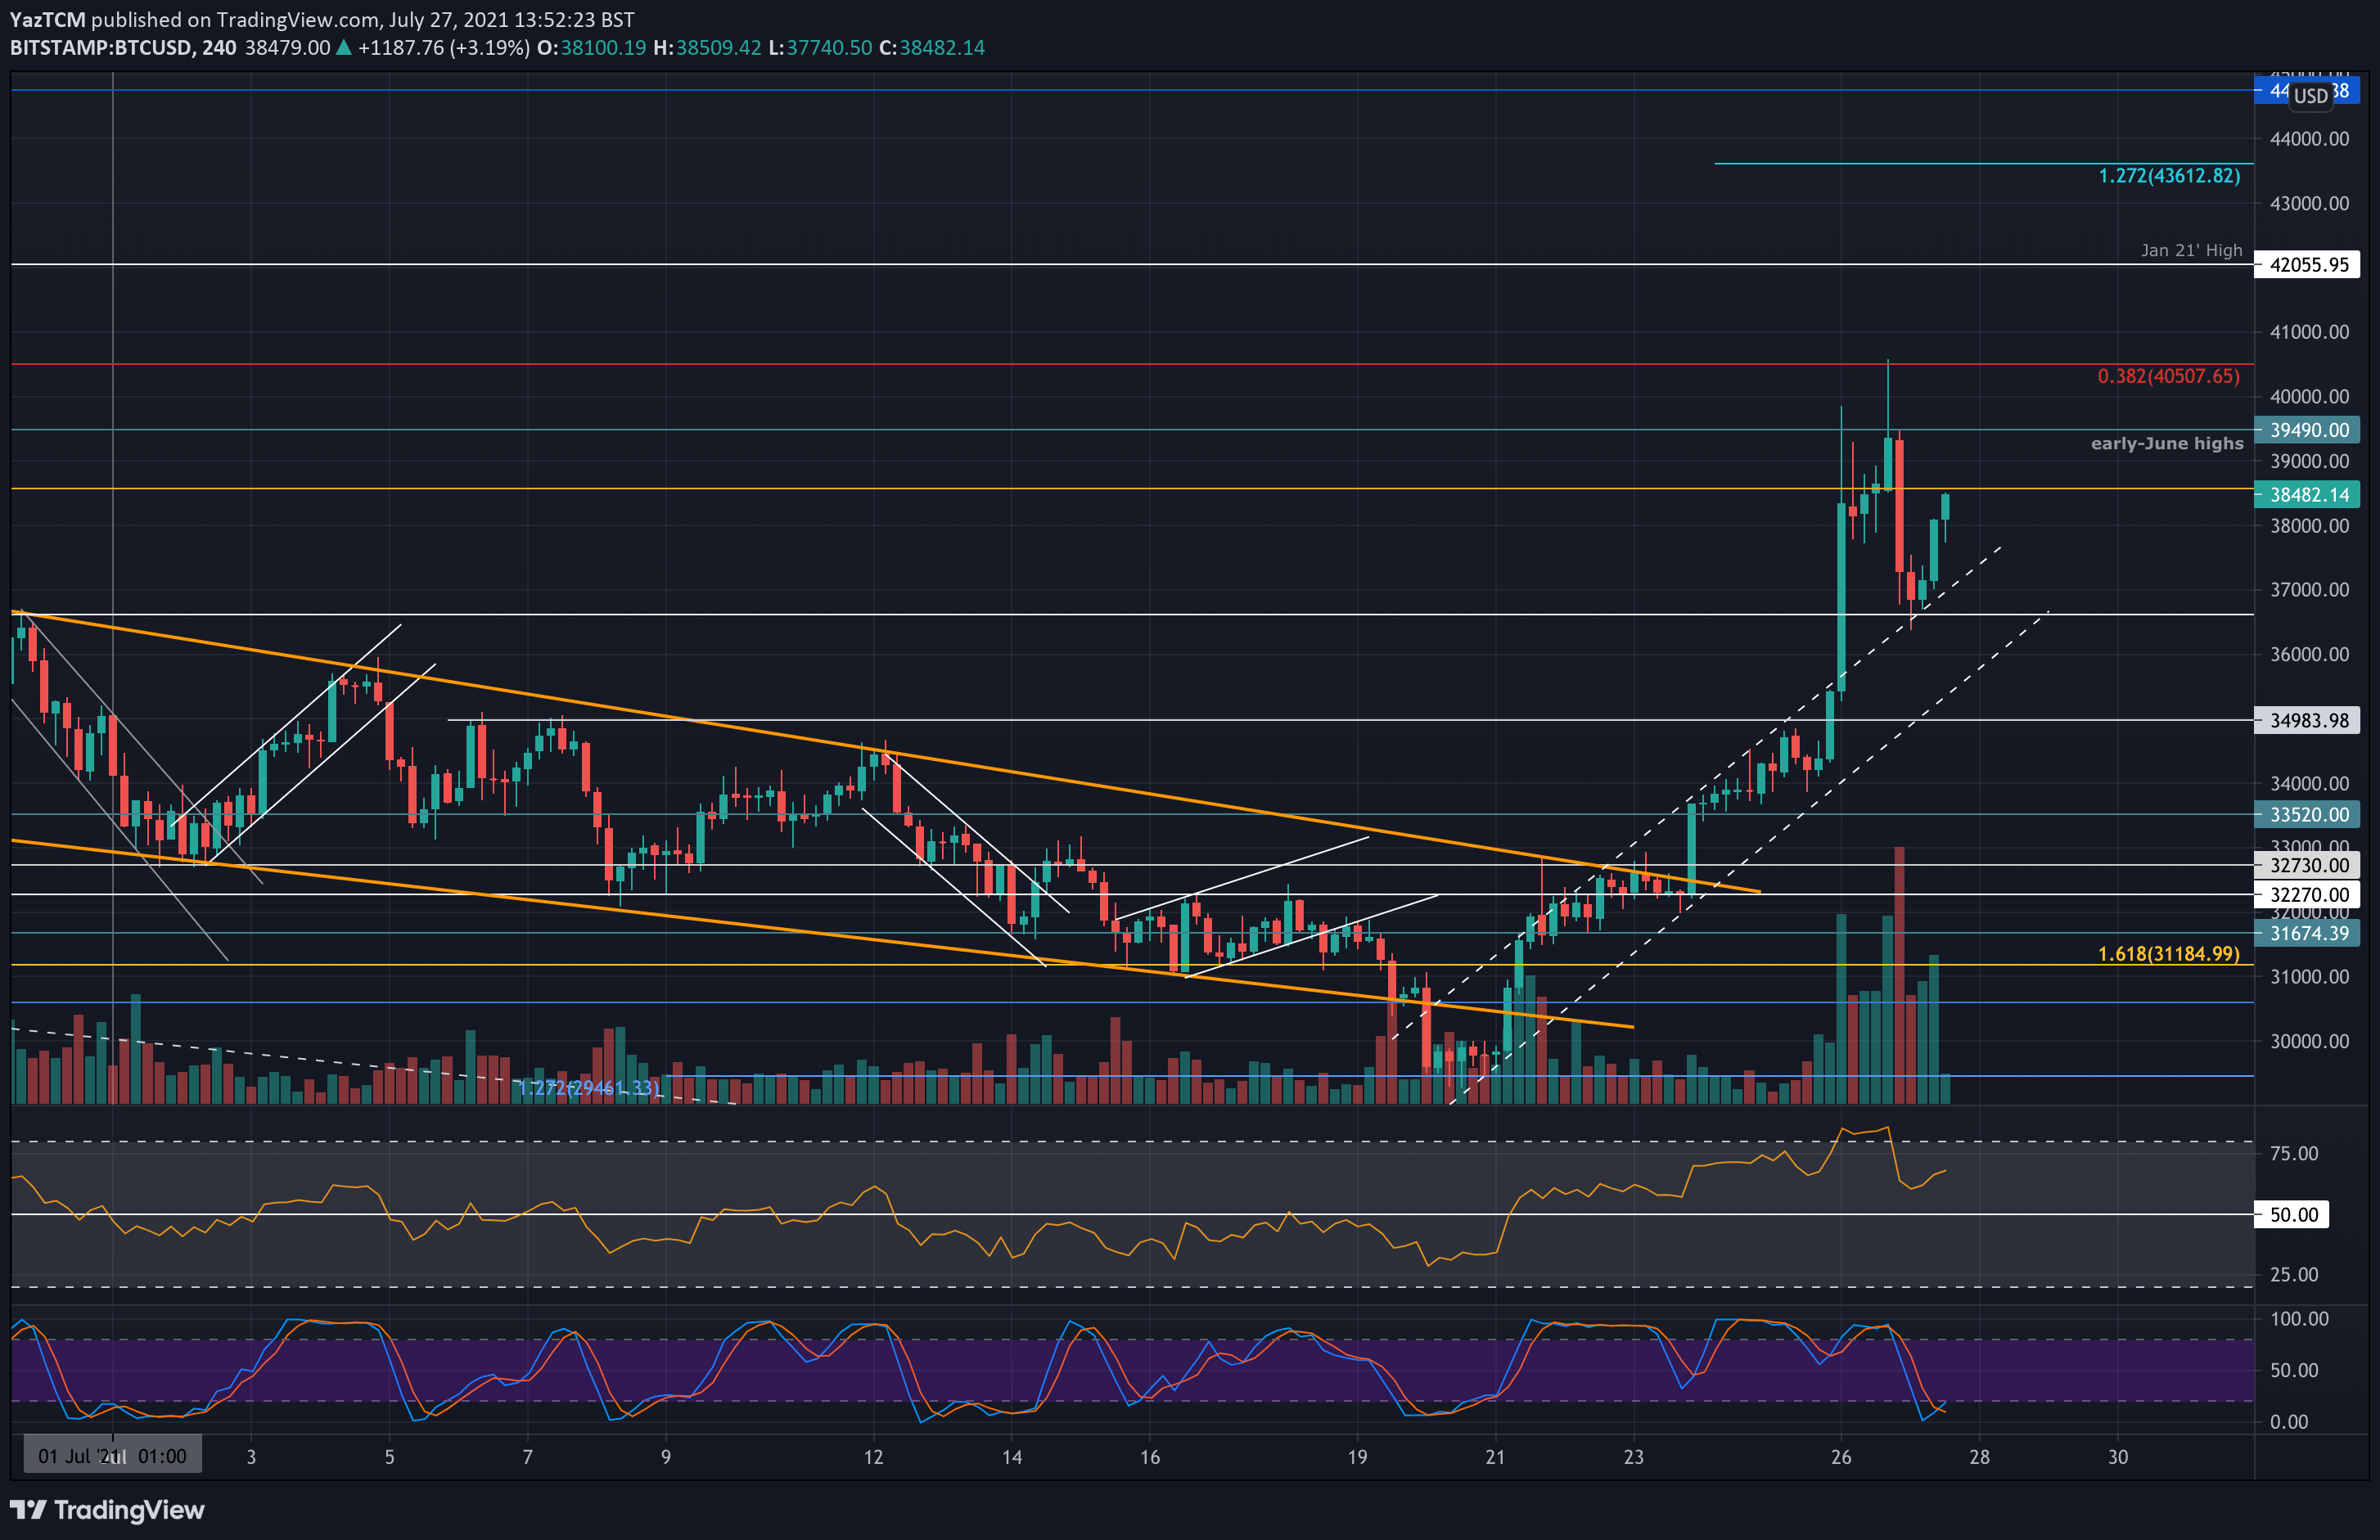
Today, after finding support amid an ascending trend-line (as shown on the 4-hour chart below), BTC is currently trading slightly above the $38K mark.
On the short-term’s 4-hour chart below, BTC was trading inside an ascending price channel. Yesterday’s 15% price hike caused it to break above the upper angle and turn parabolic on the way up to $40,500. On the retracement, BTC found support at the upper angle of the previous ascending price channel and rebounded.
As mentioned here previously, Bitcoin had been trading inside a range between ~$30K and $40-42K since the liquidation event on May 19. Bitcoin was unable to break above or below the range, and for the first time since mid-June, the upper range had been tested as resistance.
Hence, it was reasonable that Bitcoin had failed to penetrate above the range on its first attempt in 6 weeks.
BTC Price Support and Resistance Levels to Watch
Key Support Levels: $37,000, $36,620, $35,000, $34.5K.
Key Resistance Levels: $38,400, $39,500, $40,500, $42,000, $43,610, $44,750.
Moving forward, the first resistance lies at current levels amid $38.4K. This is followed by $39,500 (early-June highs). This is followed by $40,500 (bearish .382 Fib & 100-day MA – yesterday’s high), $42,000 (Jan 2021 high), $43,610 (1.272 FIb Extension), and $44,750 (200-day MA).
On the other side, the first support lies at $37,000 (upper angle of the short-term ascending price channel). This is followed by support at $36,620, $35,000, $34,460 (50-day MA), and $33,500.
The daily RSI has finally penetrated above the long-term descending trend line that prevented the momentum from creating a higher. This line was started forming at the beginning of 2021. On the daily timeframe, the momentum is now in the bullish favor and is rising as the RSI climbs higher above the midline.
Bitstamp BTC/USD Daily Chart
Bitstamp BTC/USD 4-Hour Chart