Over the past month, since the May-19 price collapse, BTC had been trading inside a range between K from below and K from above. Last Tuesday, Bitcoin broke below the range, and for the first time since January 2021, traded beneath K. This lasted only for two hours before bulls stepped in for a heavy bounce, which spiked the price over k in a matter of a few hours. So, in conclusion, Bitcoin went up a total of 18% since hitting the 5-month low of ,600 on Tuesday. While negative fundamental news is coming from China, the fact that Bitcoin bounced sharply after hitting K teaches us that there is still a strong bullish demand, and the bull run of 2021 might not be over yet. Despite that BTC had struggled to close a 4-hour candle above K since breaking the
Topics:
Yaz Sheikh considers the following as important: Bitcoin (BTC) Price, BTC Analysis, BTCEUR, BTCGBP, btcusd, btcusdt
This could be interesting, too:
Chayanika Deka writes XRP, SOL, and ADA Inclusion in US Crypto Reserve Pushes Traders on Edge
Chayanika Deka writes Why Arthur Hayes Is Bullish on Bitcoin Under Trump’s Economic Strategy
Mandy Williams writes Why the Bitcoin Market Is Stuck—and the Key Metric That Could Change It: CryptoQuant CEO
Wayne Jones writes Metaplanet Acquires 156 BTC, Bringing Total Holdings to 2,391
Over the past month, since the May-19 price collapse, BTC had been trading inside a range between $30K from below and $42K from above.
Last Tuesday, Bitcoin broke below the range, and for the first time since January 2021, traded beneath $30K. This lasted only for two hours before bulls stepped in for a heavy bounce, which spiked the price over $5k in a matter of a few hours. So, in conclusion, Bitcoin went up a total of 18% since hitting the 5-month low of $28,600 on Tuesday.
While negative fundamental news is coming from China, the fact that Bitcoin bounced sharply after hitting $30K teaches us that there is still a strong bullish demand, and the bull run of 2021 might not be over yet.
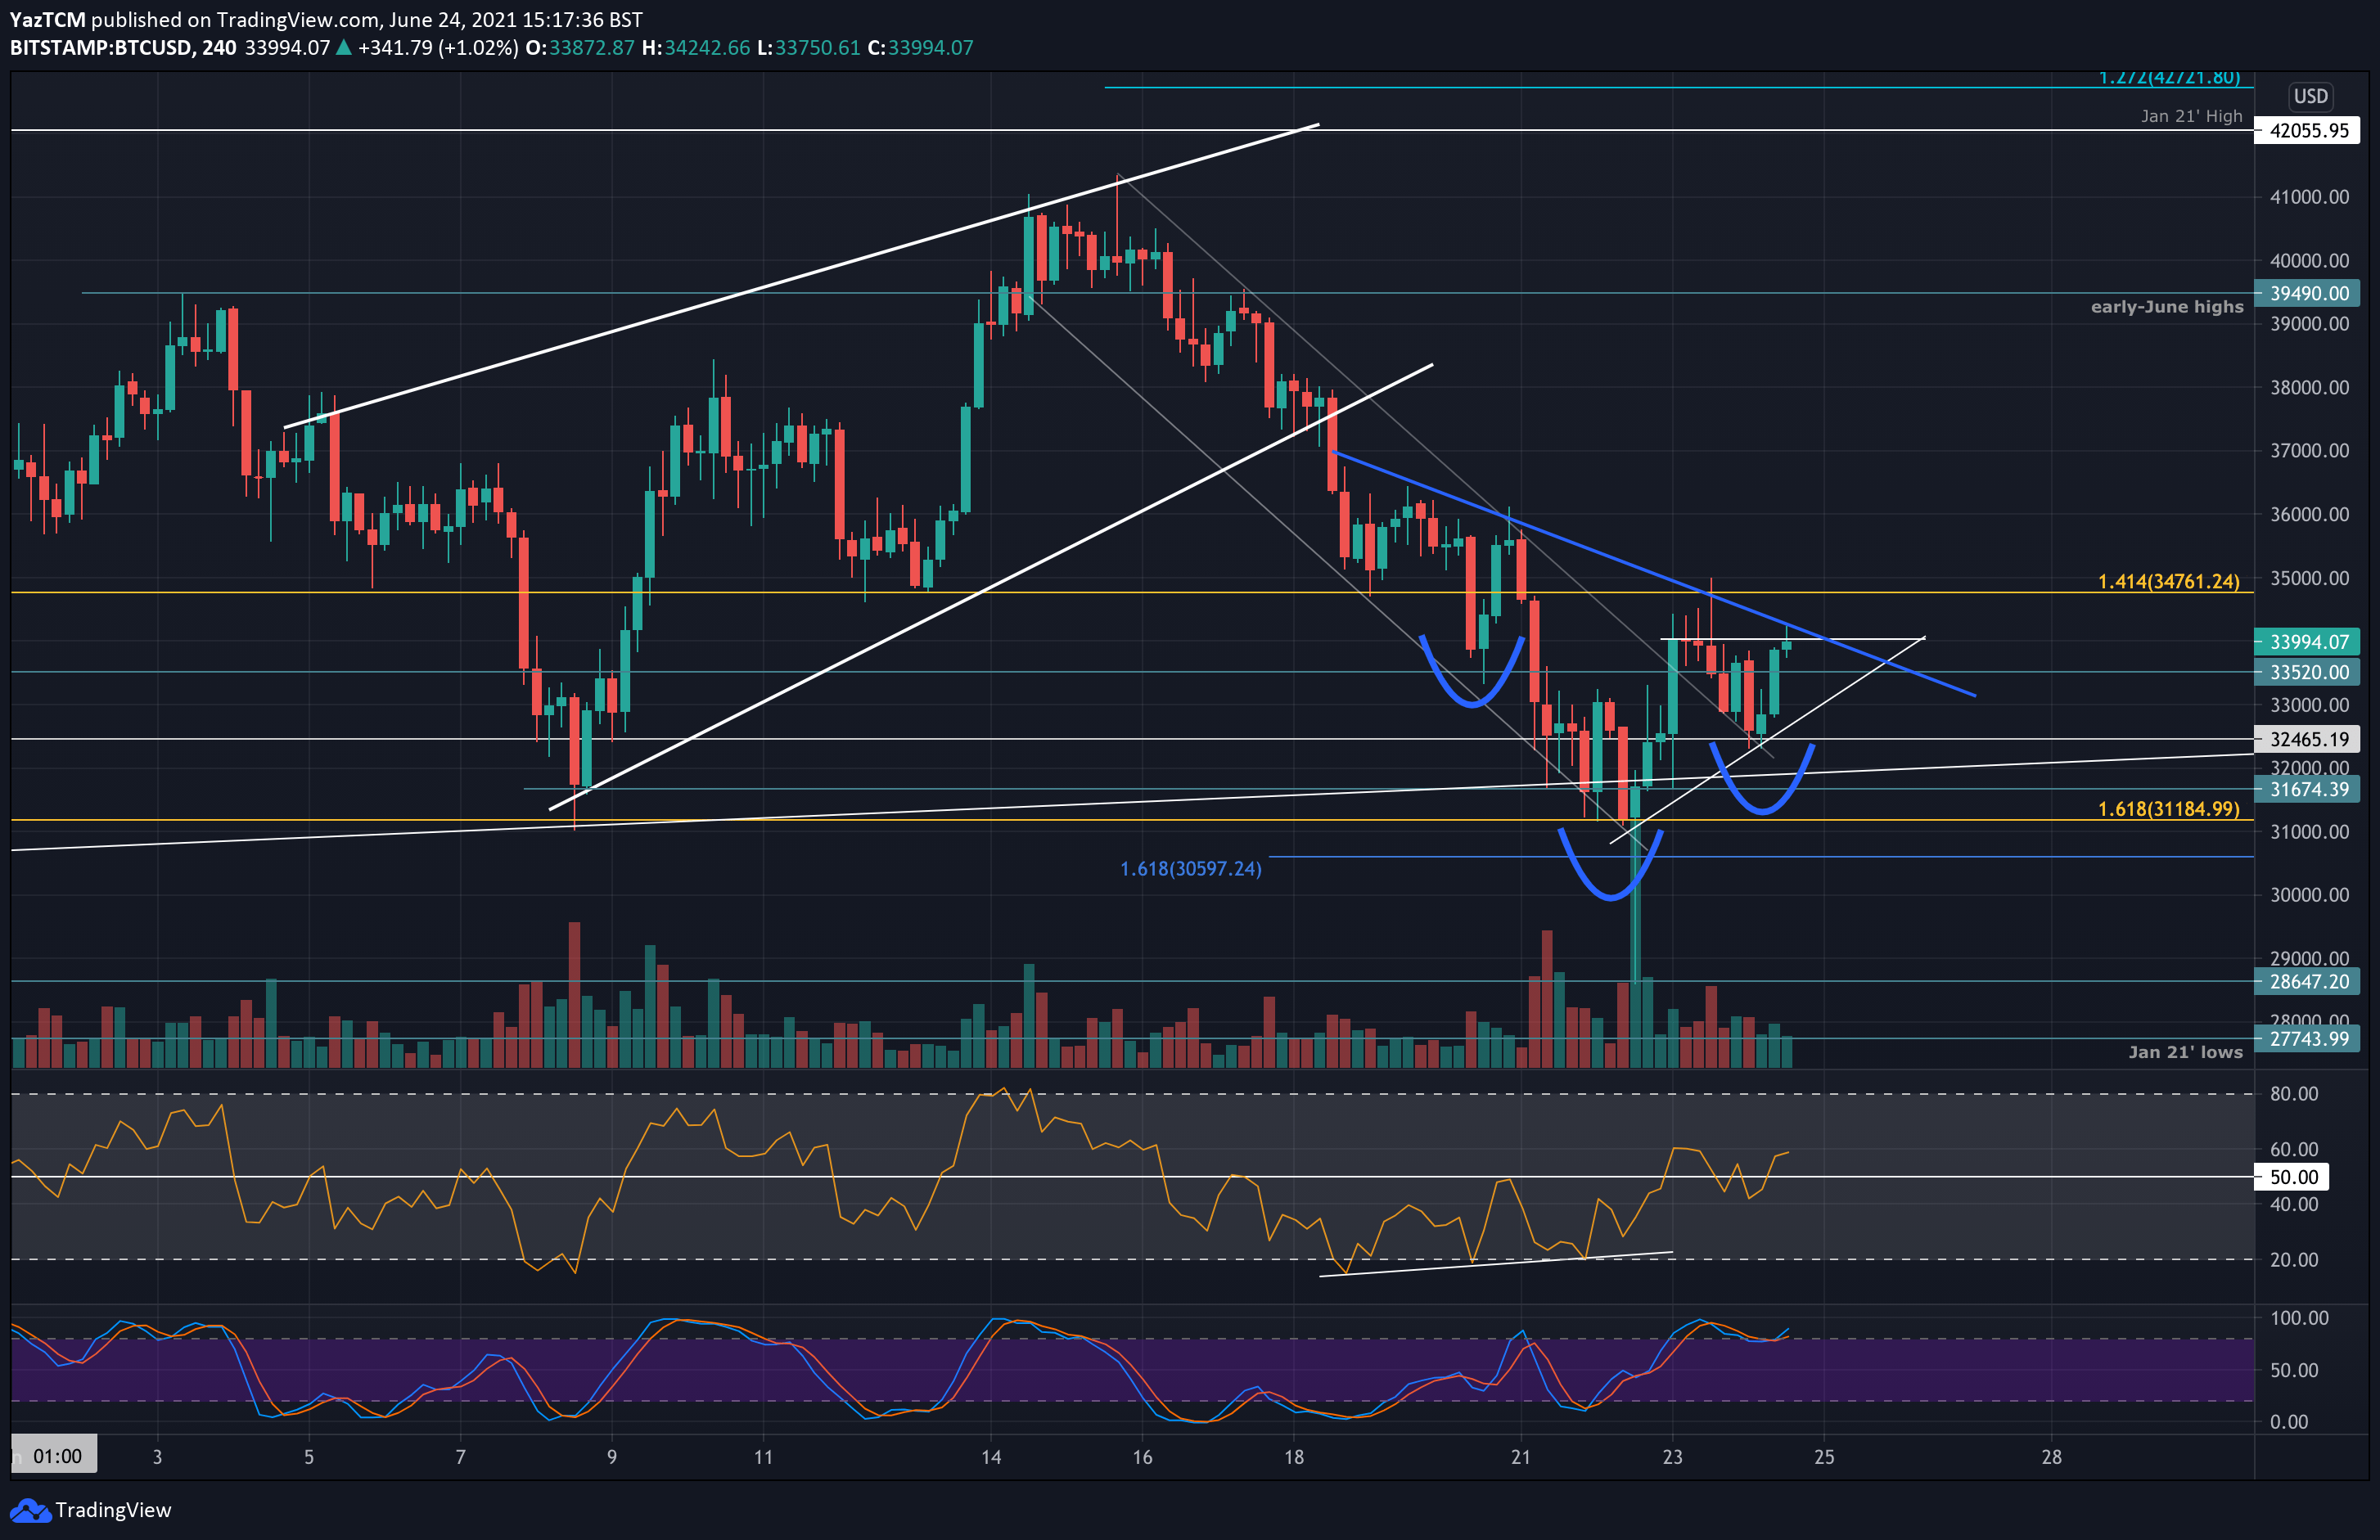
Despite that BTC had struggled to close a 4-hour candle above $34K since breaking the marked descending price channel (as shown below), Bitcoin is forming a short-term ascending triangle pattern. A breakout of this pattern should see BTC reaching as high as $37,000.
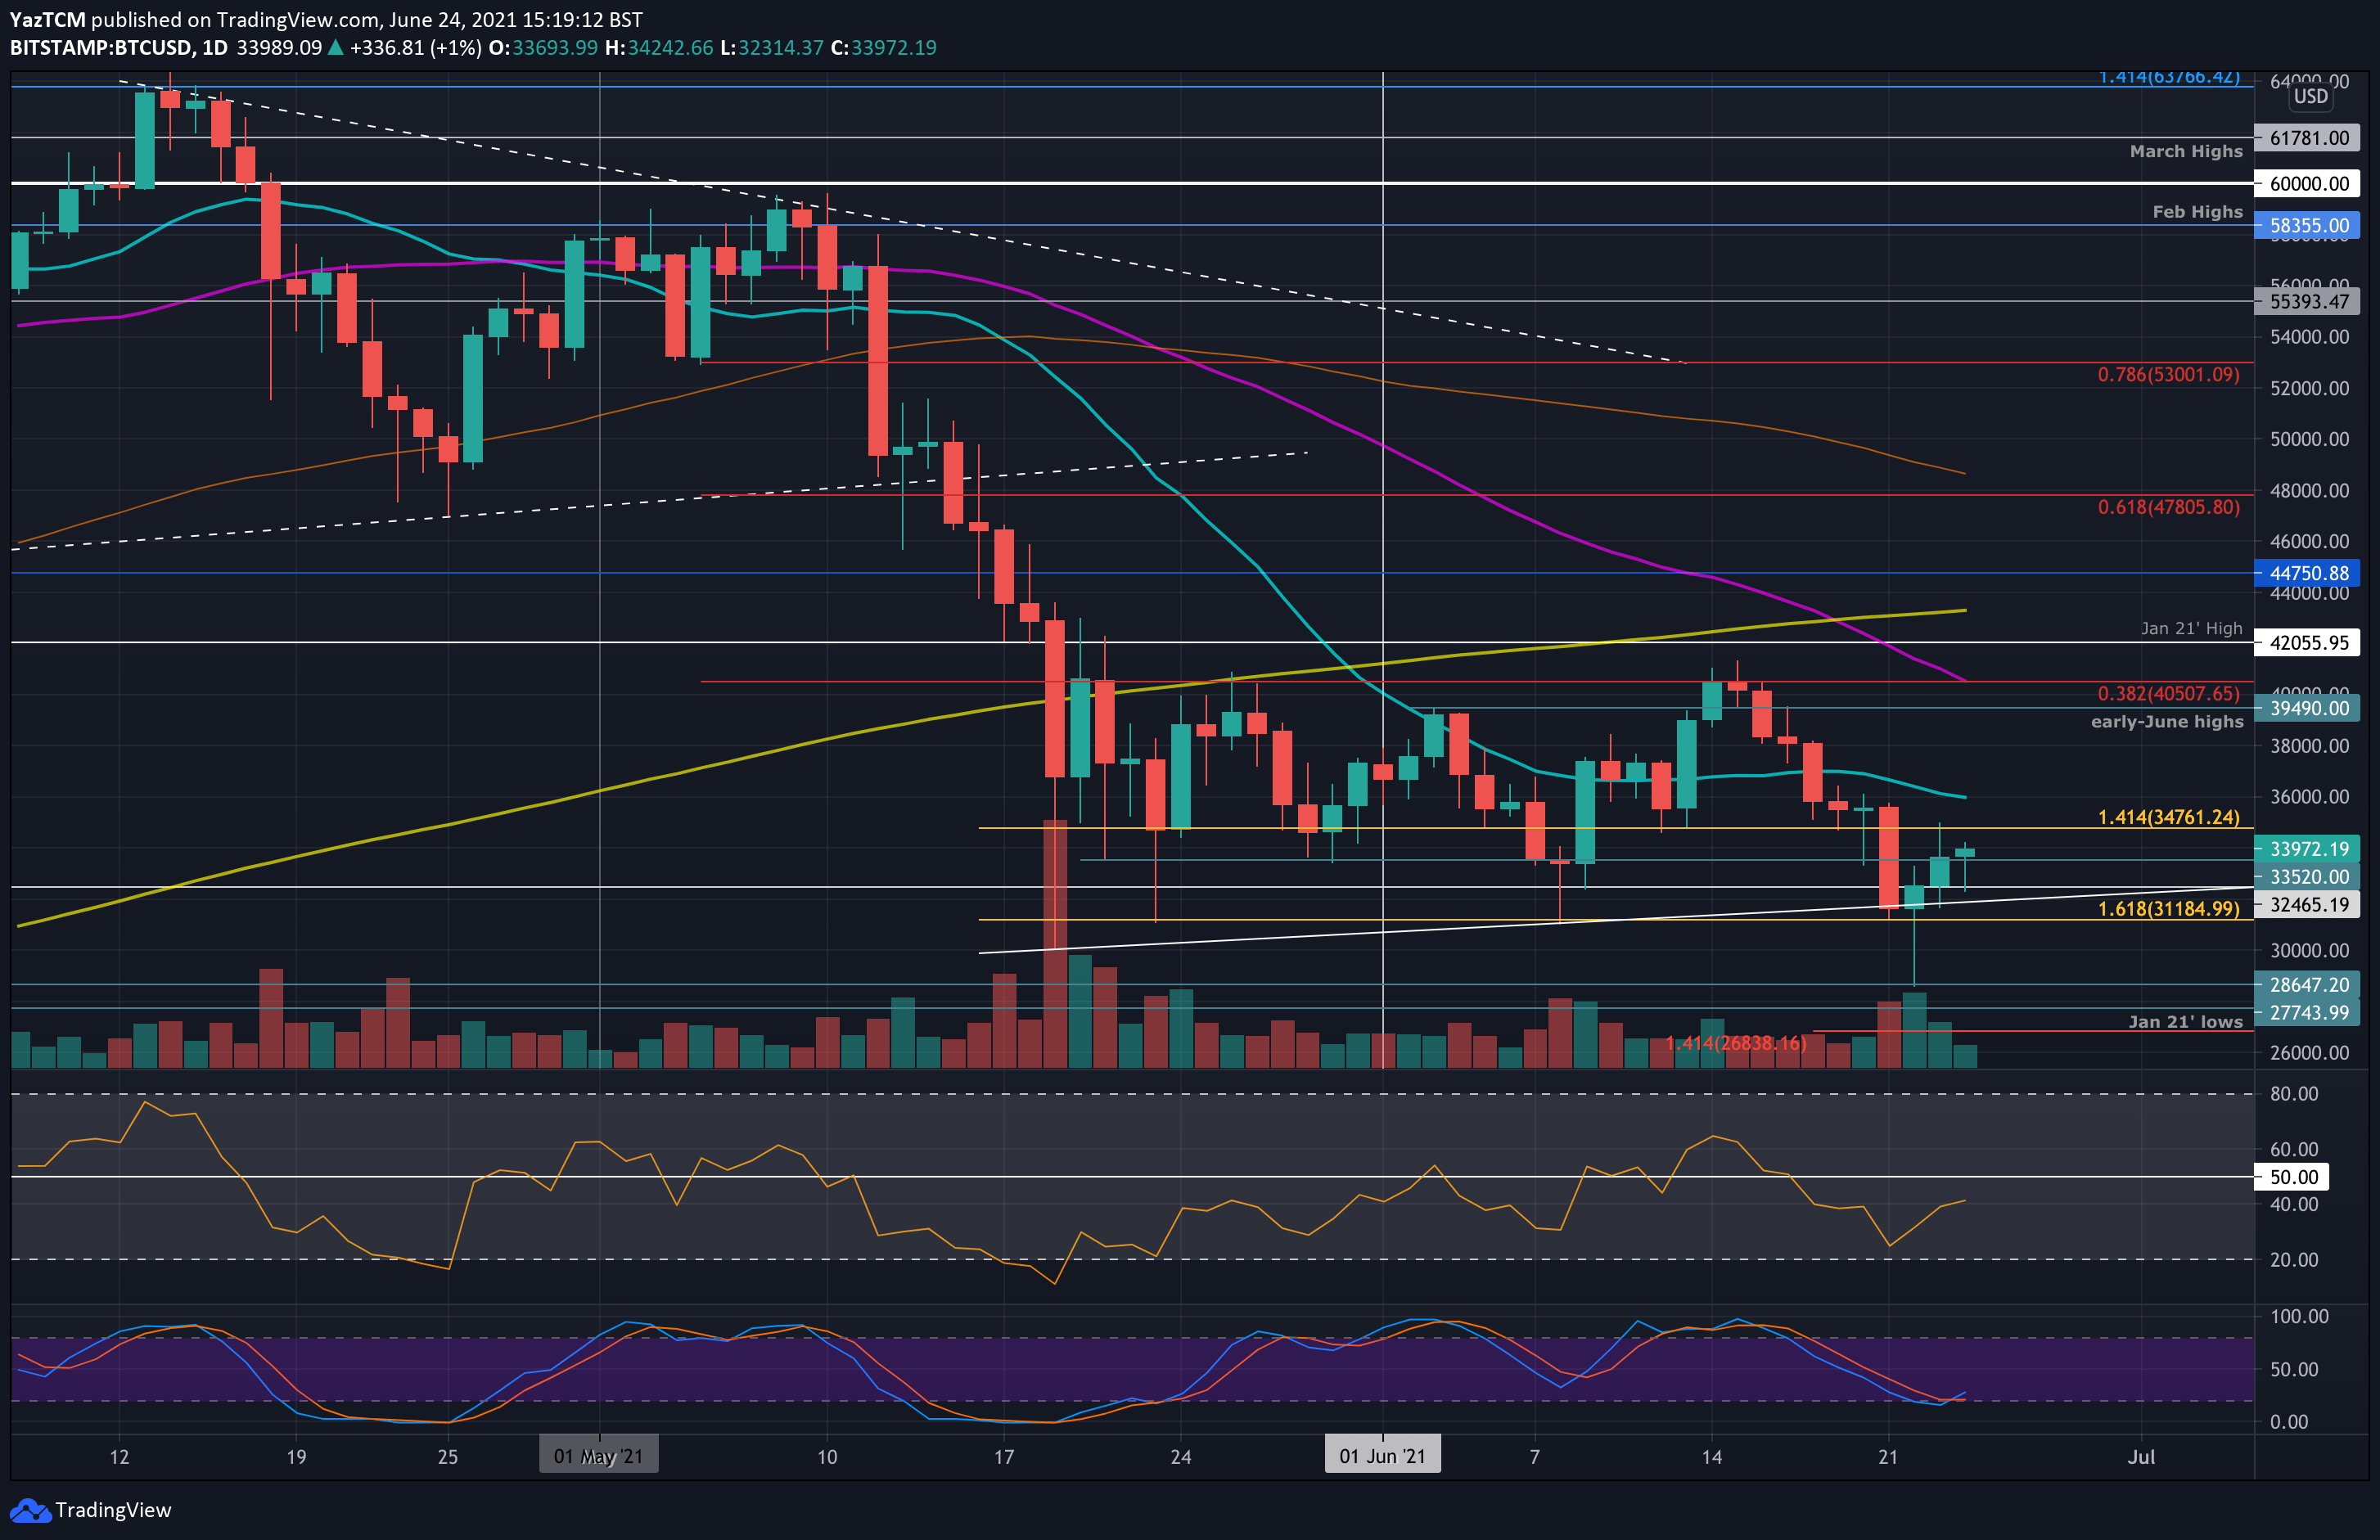
Overall, the daily chart is still indecisive inside the choppy zone, while BTC did not close a daily candle beneath $30K. After successfully confirming $32K as support, the latter becomes the first critical support zone to watch.
BTC Price Support and Resistance Levels to Watch
Key Support Levels: $33,520, $33,000, $32K, $31,185, $30K.
Key Resistance Levels: $34,700, $36,000, $37,000, $39,500, $40,500.
Looking ahead, the first resistance lies at current levels of $34,000. This is followed by $34,700, $36,000 (20-day MA), $37,000 (ascending triangle target), and $39,500. Added resistance lies at $40,500 (bearish .382 Fib & 50-day MA).
On the other side, the first strong support lies at $33,520. This is followed by $33,000 (triangle’s lower boundary), $32K, and $31,185 (Tuesday 4-Hour support). Further support lies at $30K.
RSI, short term: The 4-hour chart’s bullish divergence played out nicely and resulted in BTC breaking the descending price channel, as of yesterday. RSI is now trading above the midline in bullish territory, indicating the bulls are in charge of the short-term momentum.
The daily RSI is rising, indicating fading bearish momentum, but it is still yet to enter the bullish territory.
Bitstamp BTC/USD Daily Chart
Bitstamp BTC/USD 4-Hour Chart