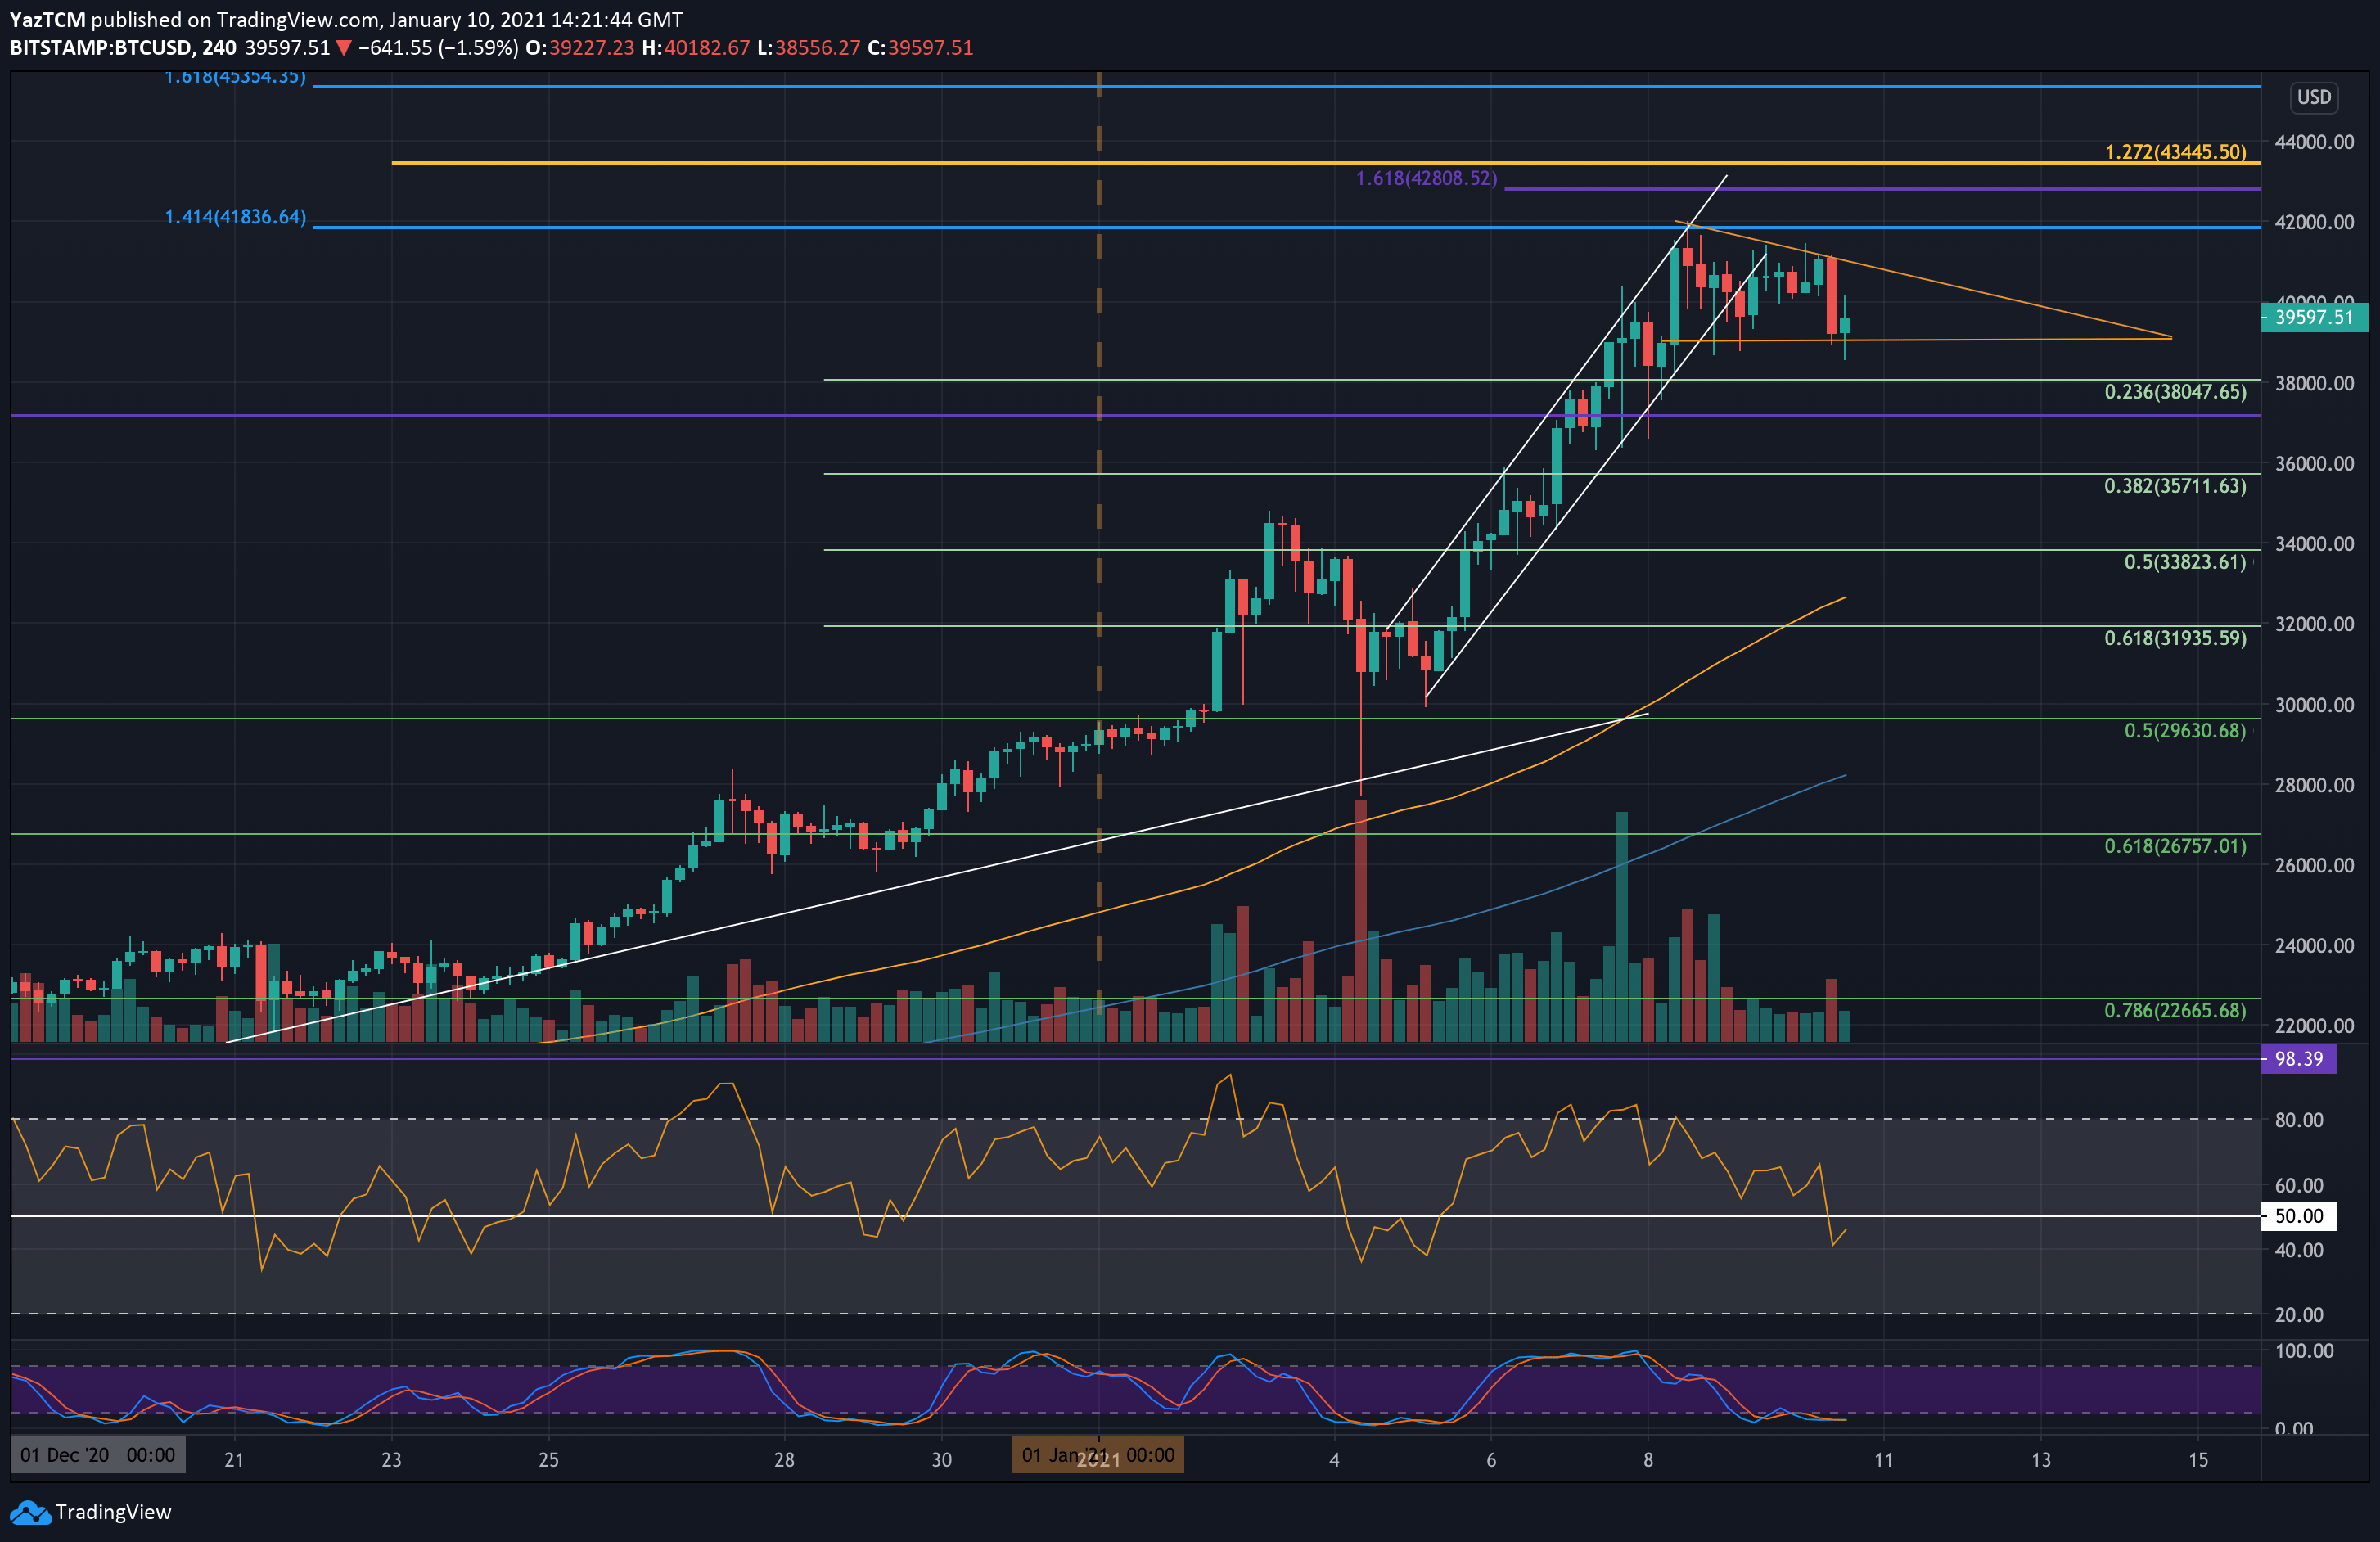
After setting the current all-time high level at ,000, according to Bitstamp, Bitcoin price saw a retracement to the K – K area followed by a quick recovery back above K over the weekend.However, despite reaching K earlier today, Bitcoin had plunged to a current low of ,555 (Bitstamp) before recovering slightly to where it is trading right now – ,500.Looking at the bigger picture and as shown on the following 4-hour chart, Bitcoin had broken below the rising channel and is currently forming a bearish triangle.We saw such triangle formation right before breaking above K. but Can Bitcoin repeat the same pattern now – at K – and break upside, or is Bitcoin set for a deeper correction toward K?The breakout direction of this descending triangle will determine where
Topics:
Yaz Sheikh considers the following as important: Bitcoin (BTC) Price, BTC Analysis, BTCEUR, BTCGBP, btcusd, btcusdt
This could be interesting, too:
Chayanika Deka writes XRP, SOL, and ADA Inclusion in US Crypto Reserve Pushes Traders on Edge
Chayanika Deka writes Why Arthur Hayes Is Bullish on Bitcoin Under Trump’s Economic Strategy
Mandy Williams writes Why the Bitcoin Market Is Stuck—and the Key Metric That Could Change It: CryptoQuant CEO
Wayne Jones writes Metaplanet Acquires 156 BTC, Bringing Total Holdings to 2,391
After setting the current all-time high level at $42,000, according to Bitstamp, Bitcoin price saw a retracement to the $38K – $39K area followed by a quick recovery back above $40K over the weekend.
However, despite reaching $41K earlier today, Bitcoin had plunged to a current low of $38,555 (Bitstamp) before recovering slightly to where it is trading right now – $39,500.
Looking at the bigger picture and as shown on the following 4-hour chart, Bitcoin had broken below the rising channel and is currently forming a bearish triangle.
We saw such triangle formation right before breaking above $32K. but Can Bitcoin repeat the same pattern now – at $42K – and break upside, or is Bitcoin set for a deeper correction toward $34K?
The breakout direction of this descending triangle will determine where BTC will be heading next over the coming days. A break beneath the lower boundary is likely to allow BTC to see a retracement from the massive price surge it witnessed over the past month, with a possible target of $34K.
On the other side, a break above is likely to allow BTC to set new all-time highs over $42,000 and go beyond, maybe for a similar move, similar to the one that took place when BTC broke above $32K.
BTC Price Support and Resistance Levels to Watch
Key Support Levels: $39,000 – $38,500 (today’s low and triangles bottom), $37,150, $36,000, $35,170, $34,000.
Key Resistance Levels: $40,000, $41,000, $42,000 (ATH), $42,800, $45,445, $45,000.
The first two resistance levels lie at $40,000 and the upper border of the triangle, which is the descending trend-line.
Above the triangle, resistance lies resistance at $42,000, which is the current ATH. This is followed by $42,800 (short term 1.618 Fib Extension), $43,445 (1.272 Fib Extension – yellow), $45,000, $45,350 (1.618 Fib Extension – blue), and $45,330 (1.414 Fib Extension – yellow).
On the other side, the first level of support lies at the base of the triangle ($38,500 – $39,000). This is followed by $38,000 (short term .236 Fib), $37,150, $36,000 (.236 Fib), $35,710 (short term .382 Fib), and $34K – $33,823 (bearish traingle target and short term .5 Fib).
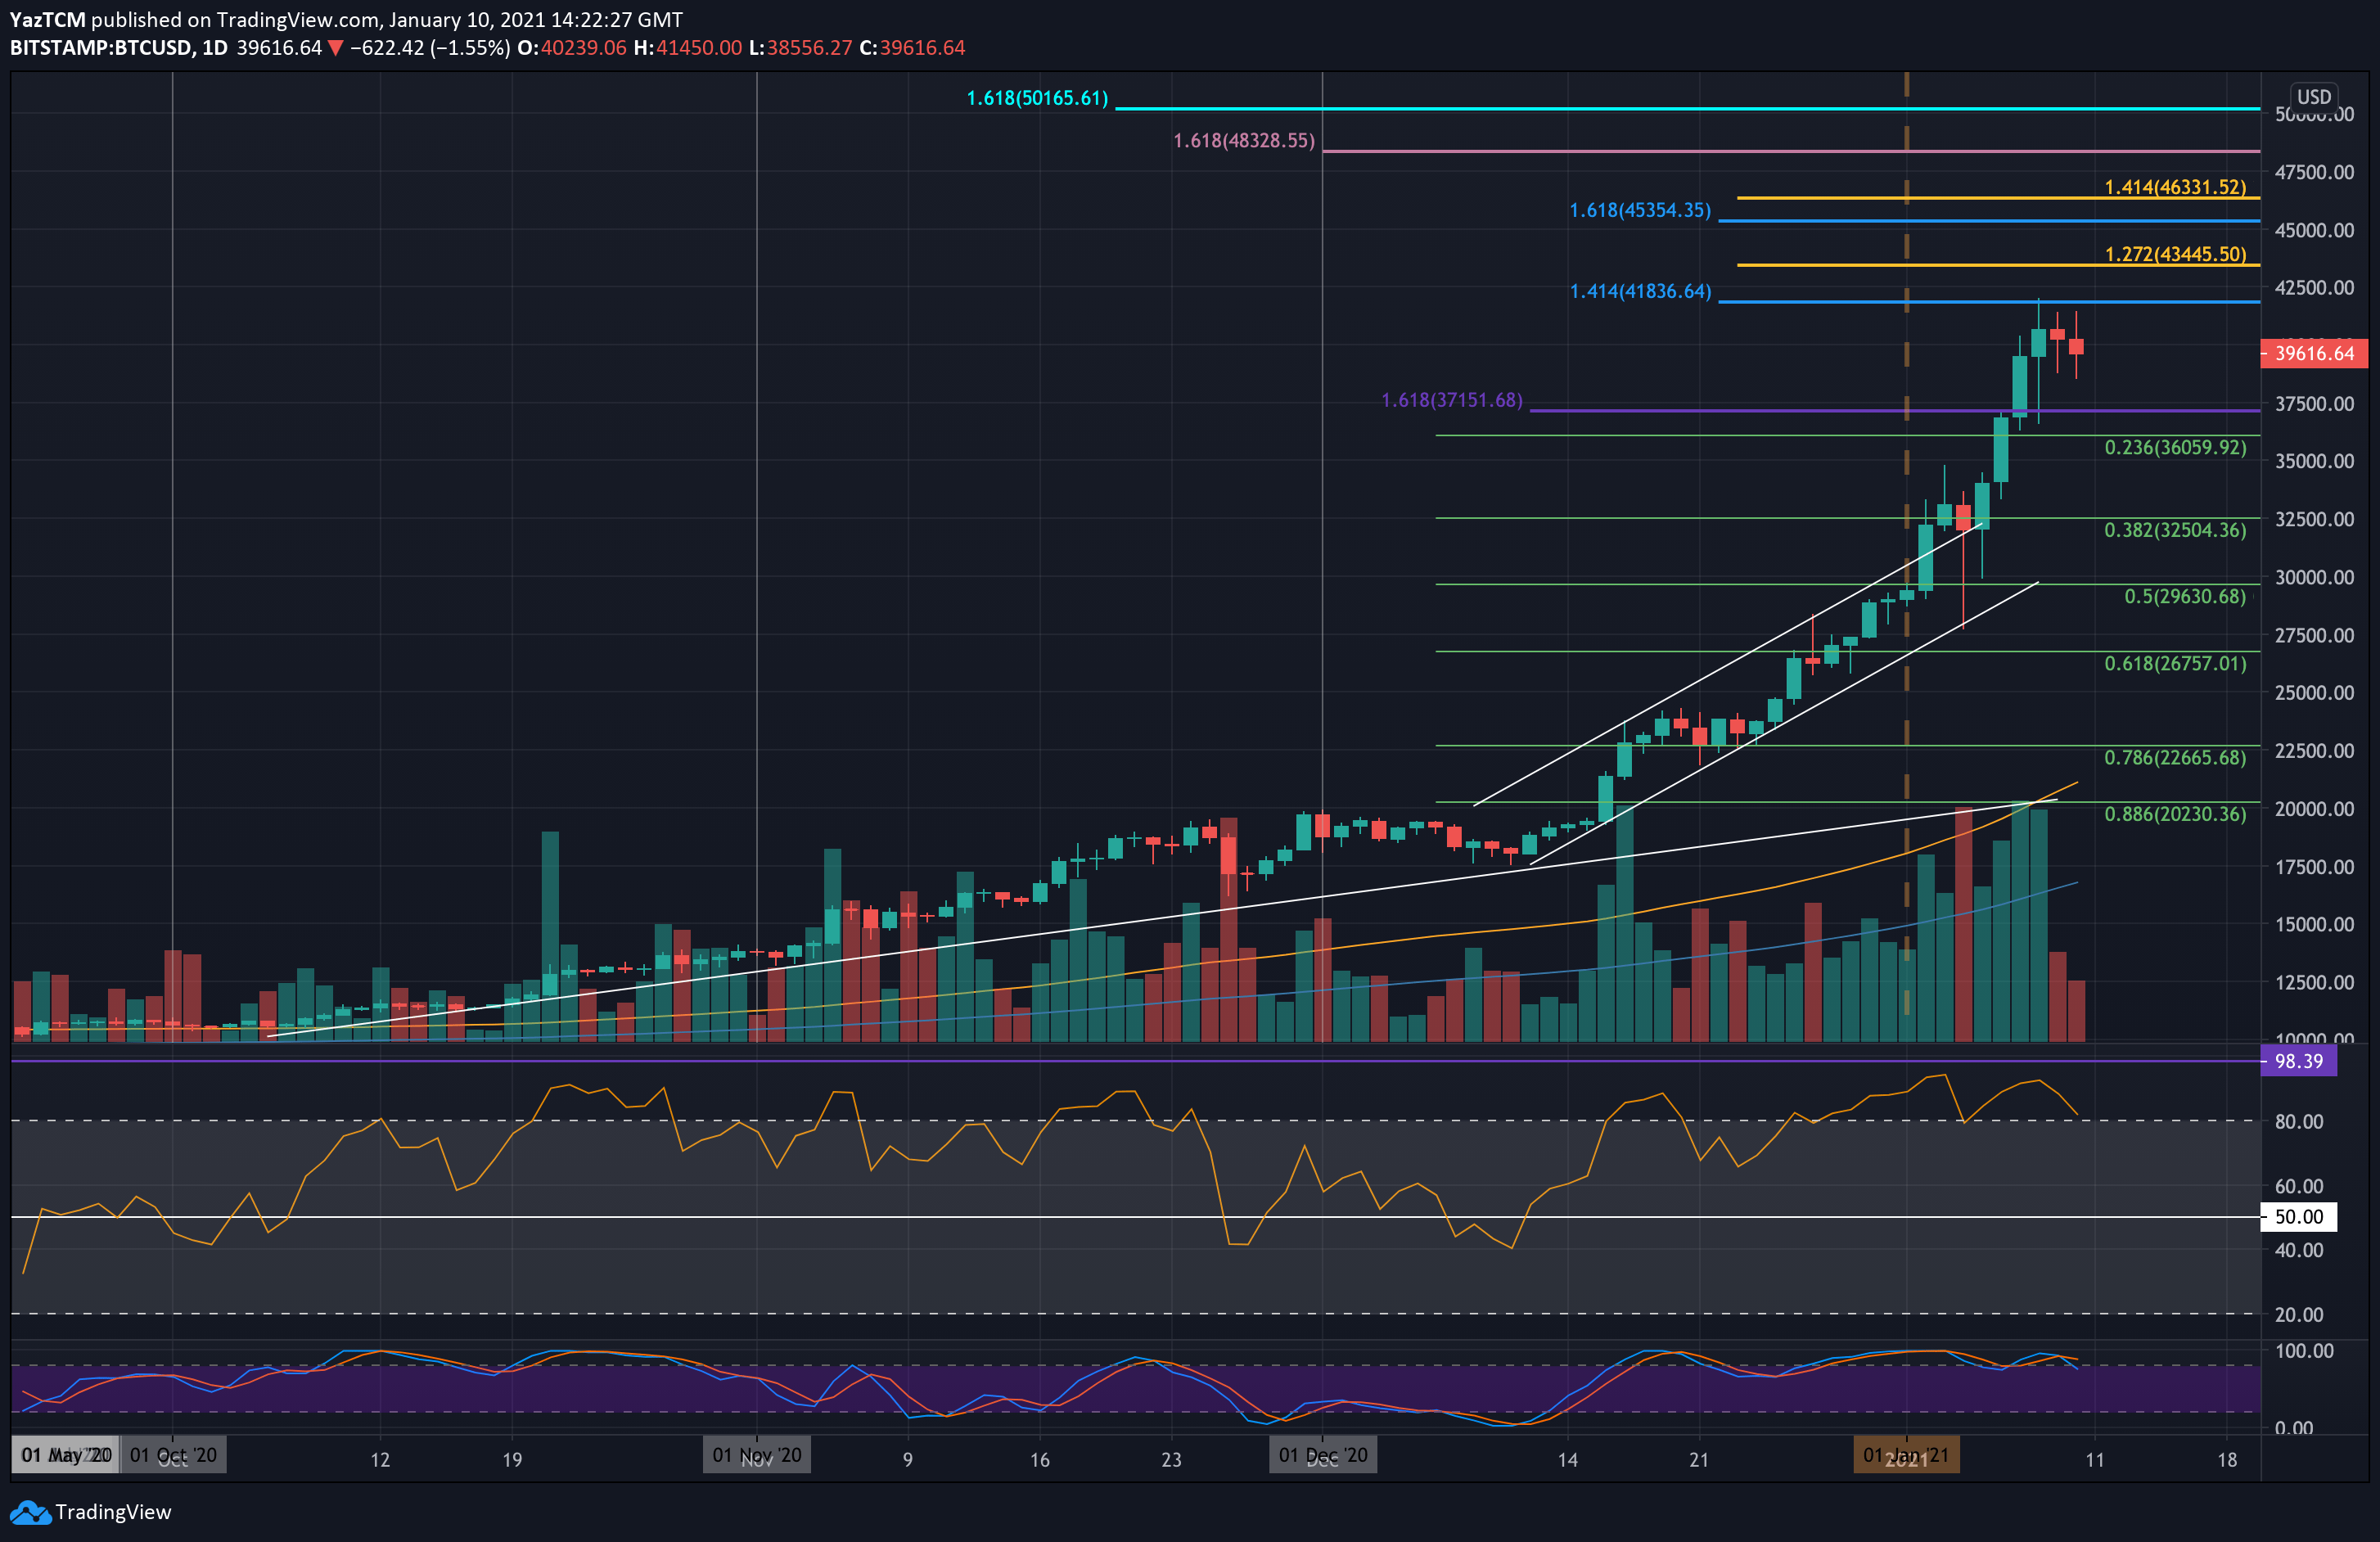
Moreover, in favor of the bears: The daily RSI is now showing signs of bearish divergence. As price made higher highs during this week, the RSI failed to make a higher high – leading to the divergence, as the bullish momentum weakens.
The RSI has dropped beneath the mid-line on the shorter timeframe, indicating short term bearish momentum is seeping into the market. However, the middle and long term are still very bullish, even when considering a further correction.
Bitstamp BTC/USD Daily Chart
Bitstamp BTC/USD 4-Hour Chart