Bitcoin is up by a solid 6% today as the primary cryptocurrency surged by over 00 over the past 24 hours.Quick recap: bitcoin is recovering after a heavy correction over the past week, in which the cryptocurrency dropped by around 25% as it broke beneath the February ascending price channel (as shown on the daily chart below) and tumbled into the support around K – K.It managed to rebound nicely from there, breaking above a falling wedge, as we mentioned on Monday. After touching K, yesterday Bitcoin corrected to K but managed to quickly recover (candle wicks on the short-term timeframes in favor of the bulls), and today, following the breakout of the critical daily EMA-20 line at around ,200, Bitcoin was able to spike back above K.As of now, Bitcoin is facing a huge
Topics:
Yaz Sheikh considers the following as important: Bitcoin (BTC) Price, BTC Analysis, BTCEUR, BTCGBP, btcusd, btcusdt
This could be interesting, too:
Chayanika Deka writes XRP, SOL, and ADA Inclusion in US Crypto Reserve Pushes Traders on Edge
Chayanika Deka writes Why Arthur Hayes Is Bullish on Bitcoin Under Trump’s Economic Strategy
Mandy Williams writes Why the Bitcoin Market Is Stuck—and the Key Metric That Could Change It: CryptoQuant CEO
Wayne Jones writes Metaplanet Acquires 156 BTC, Bringing Total Holdings to 2,391
Bitcoin is up by a solid 6% today as the primary cryptocurrency surged by over $3000 over the past 24 hours.
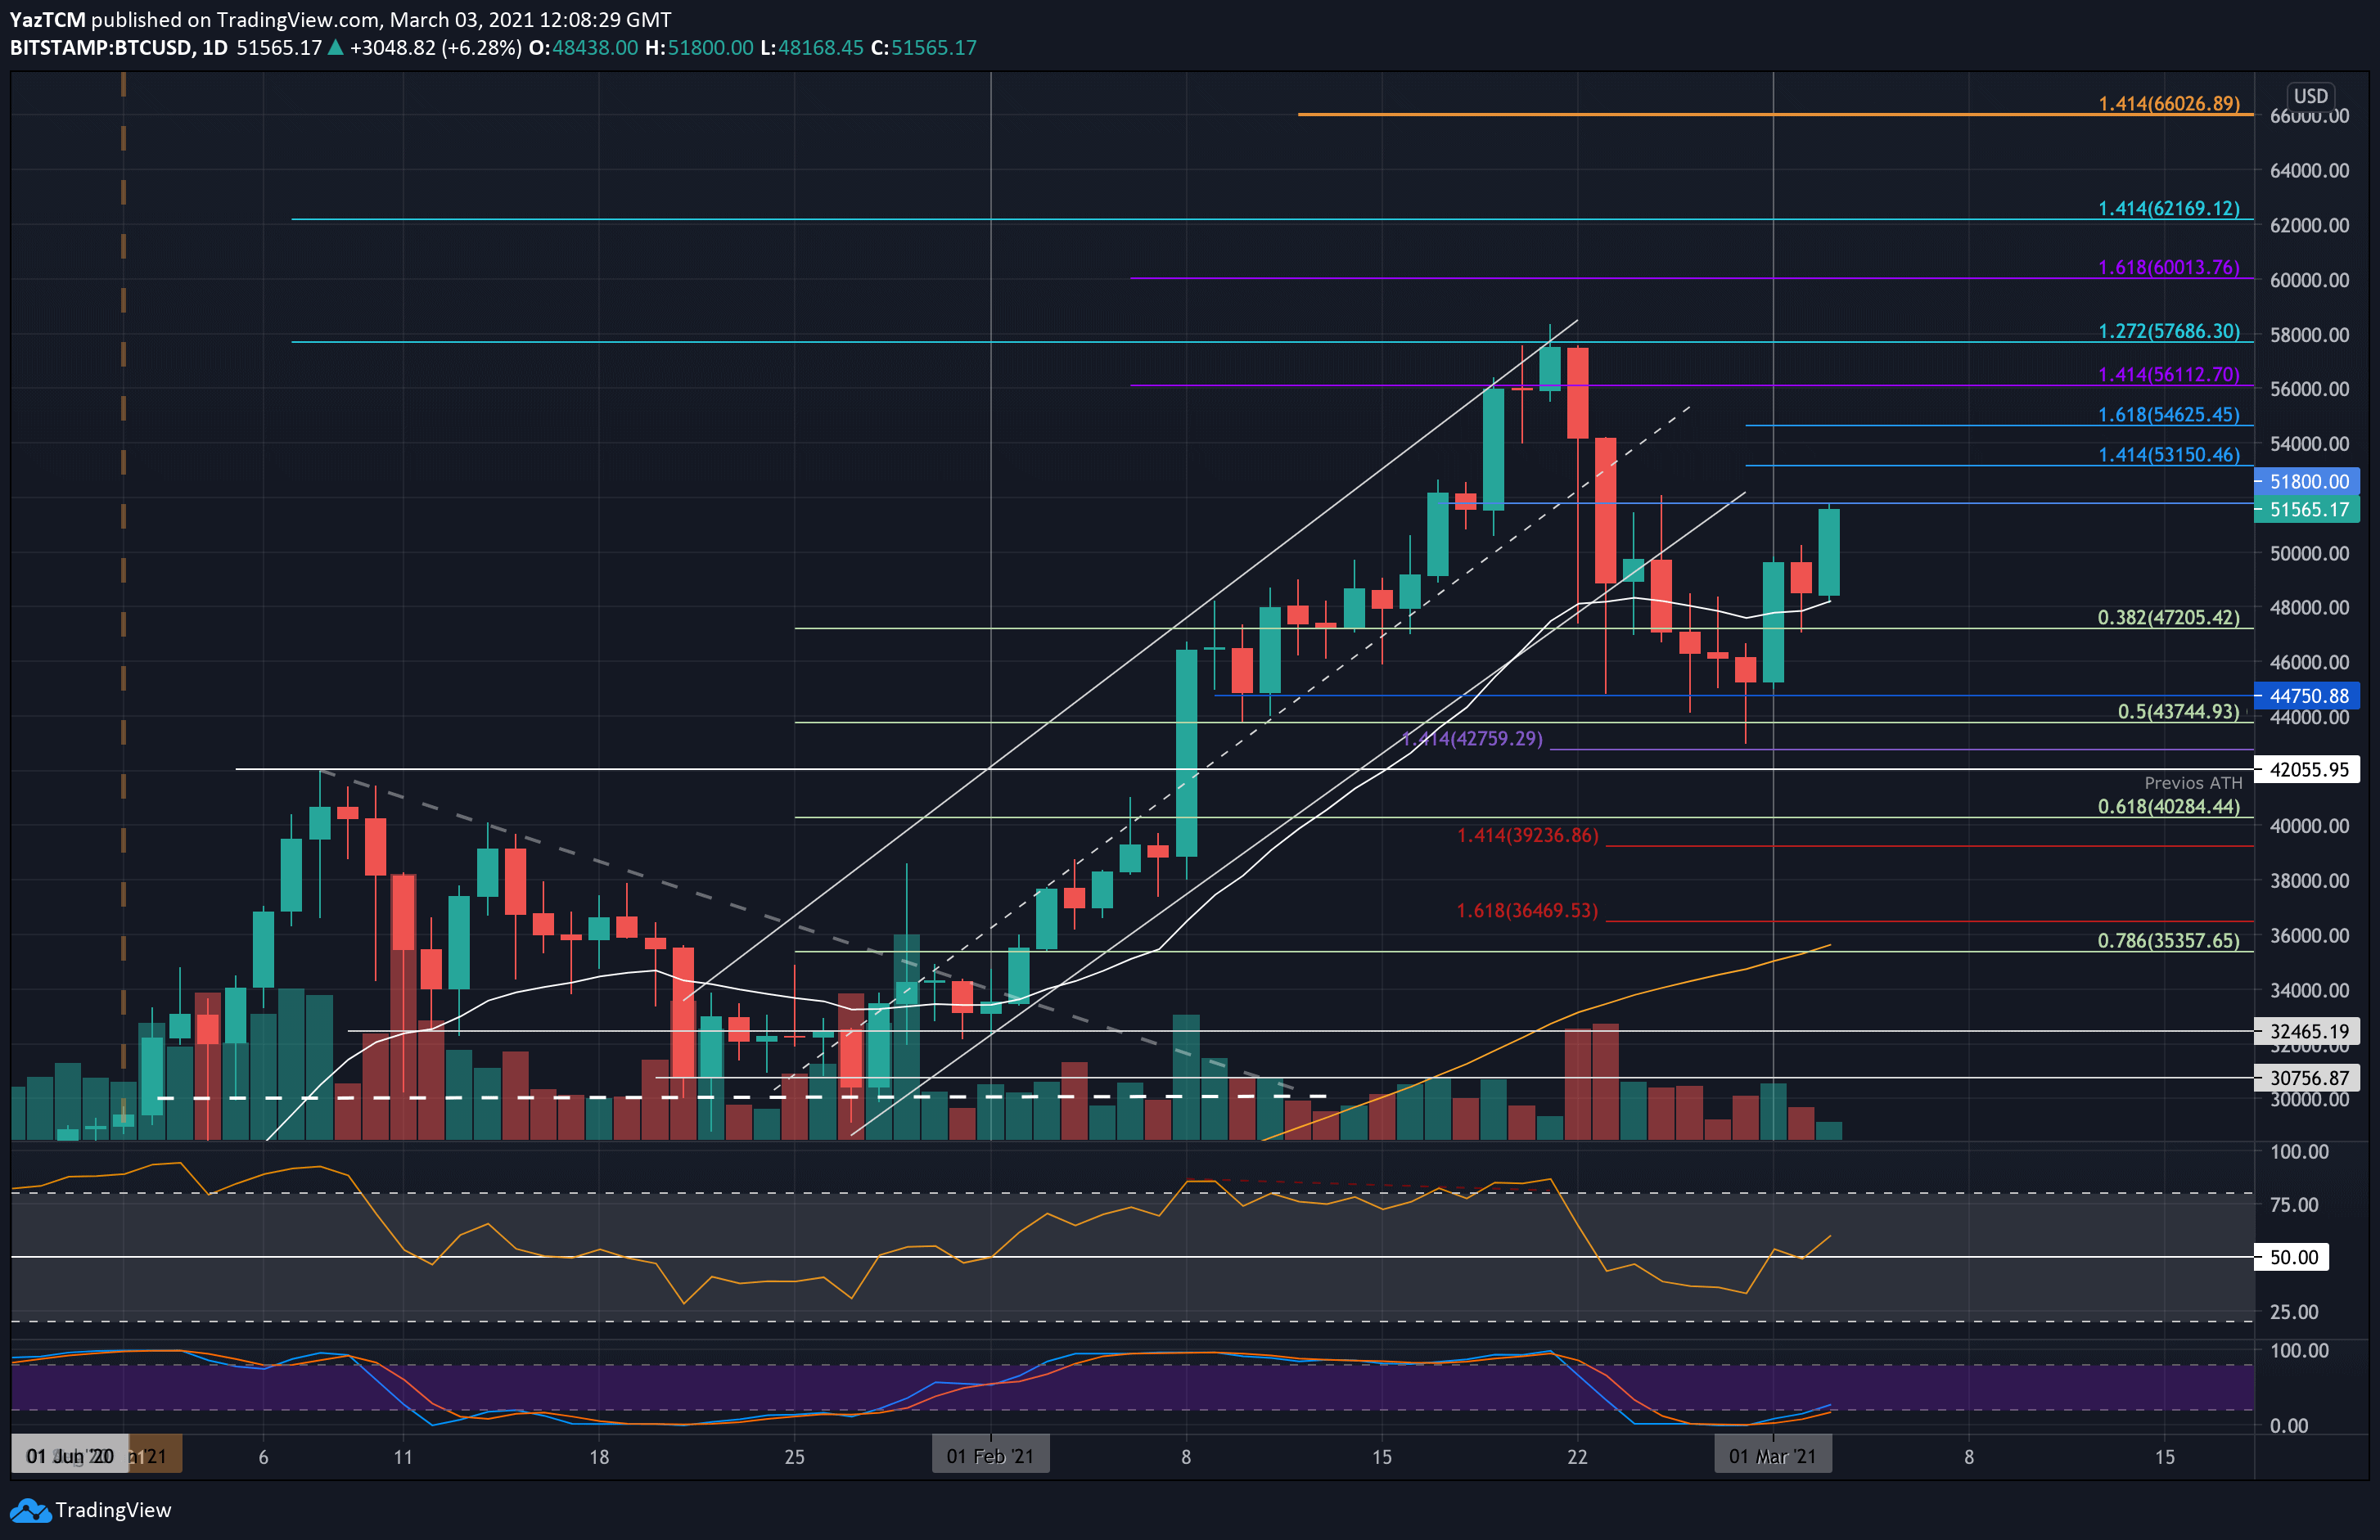
Quick recap: bitcoin is recovering after a heavy correction over the past week, in which the cryptocurrency dropped by around 25% as it broke beneath the February ascending price channel (as shown on the daily chart below) and tumbled into the support around $43K – $44K.
It managed to rebound nicely from there, breaking above a falling wedge, as we mentioned on Monday. After touching $50K, yesterday Bitcoin corrected to $47K but managed to quickly recover (candle wicks on the short-term timeframes in favor of the bulls), and today, following the breakout of the critical daily EMA-20 line at around $48,200, Bitcoin was able to spike back above $50K.
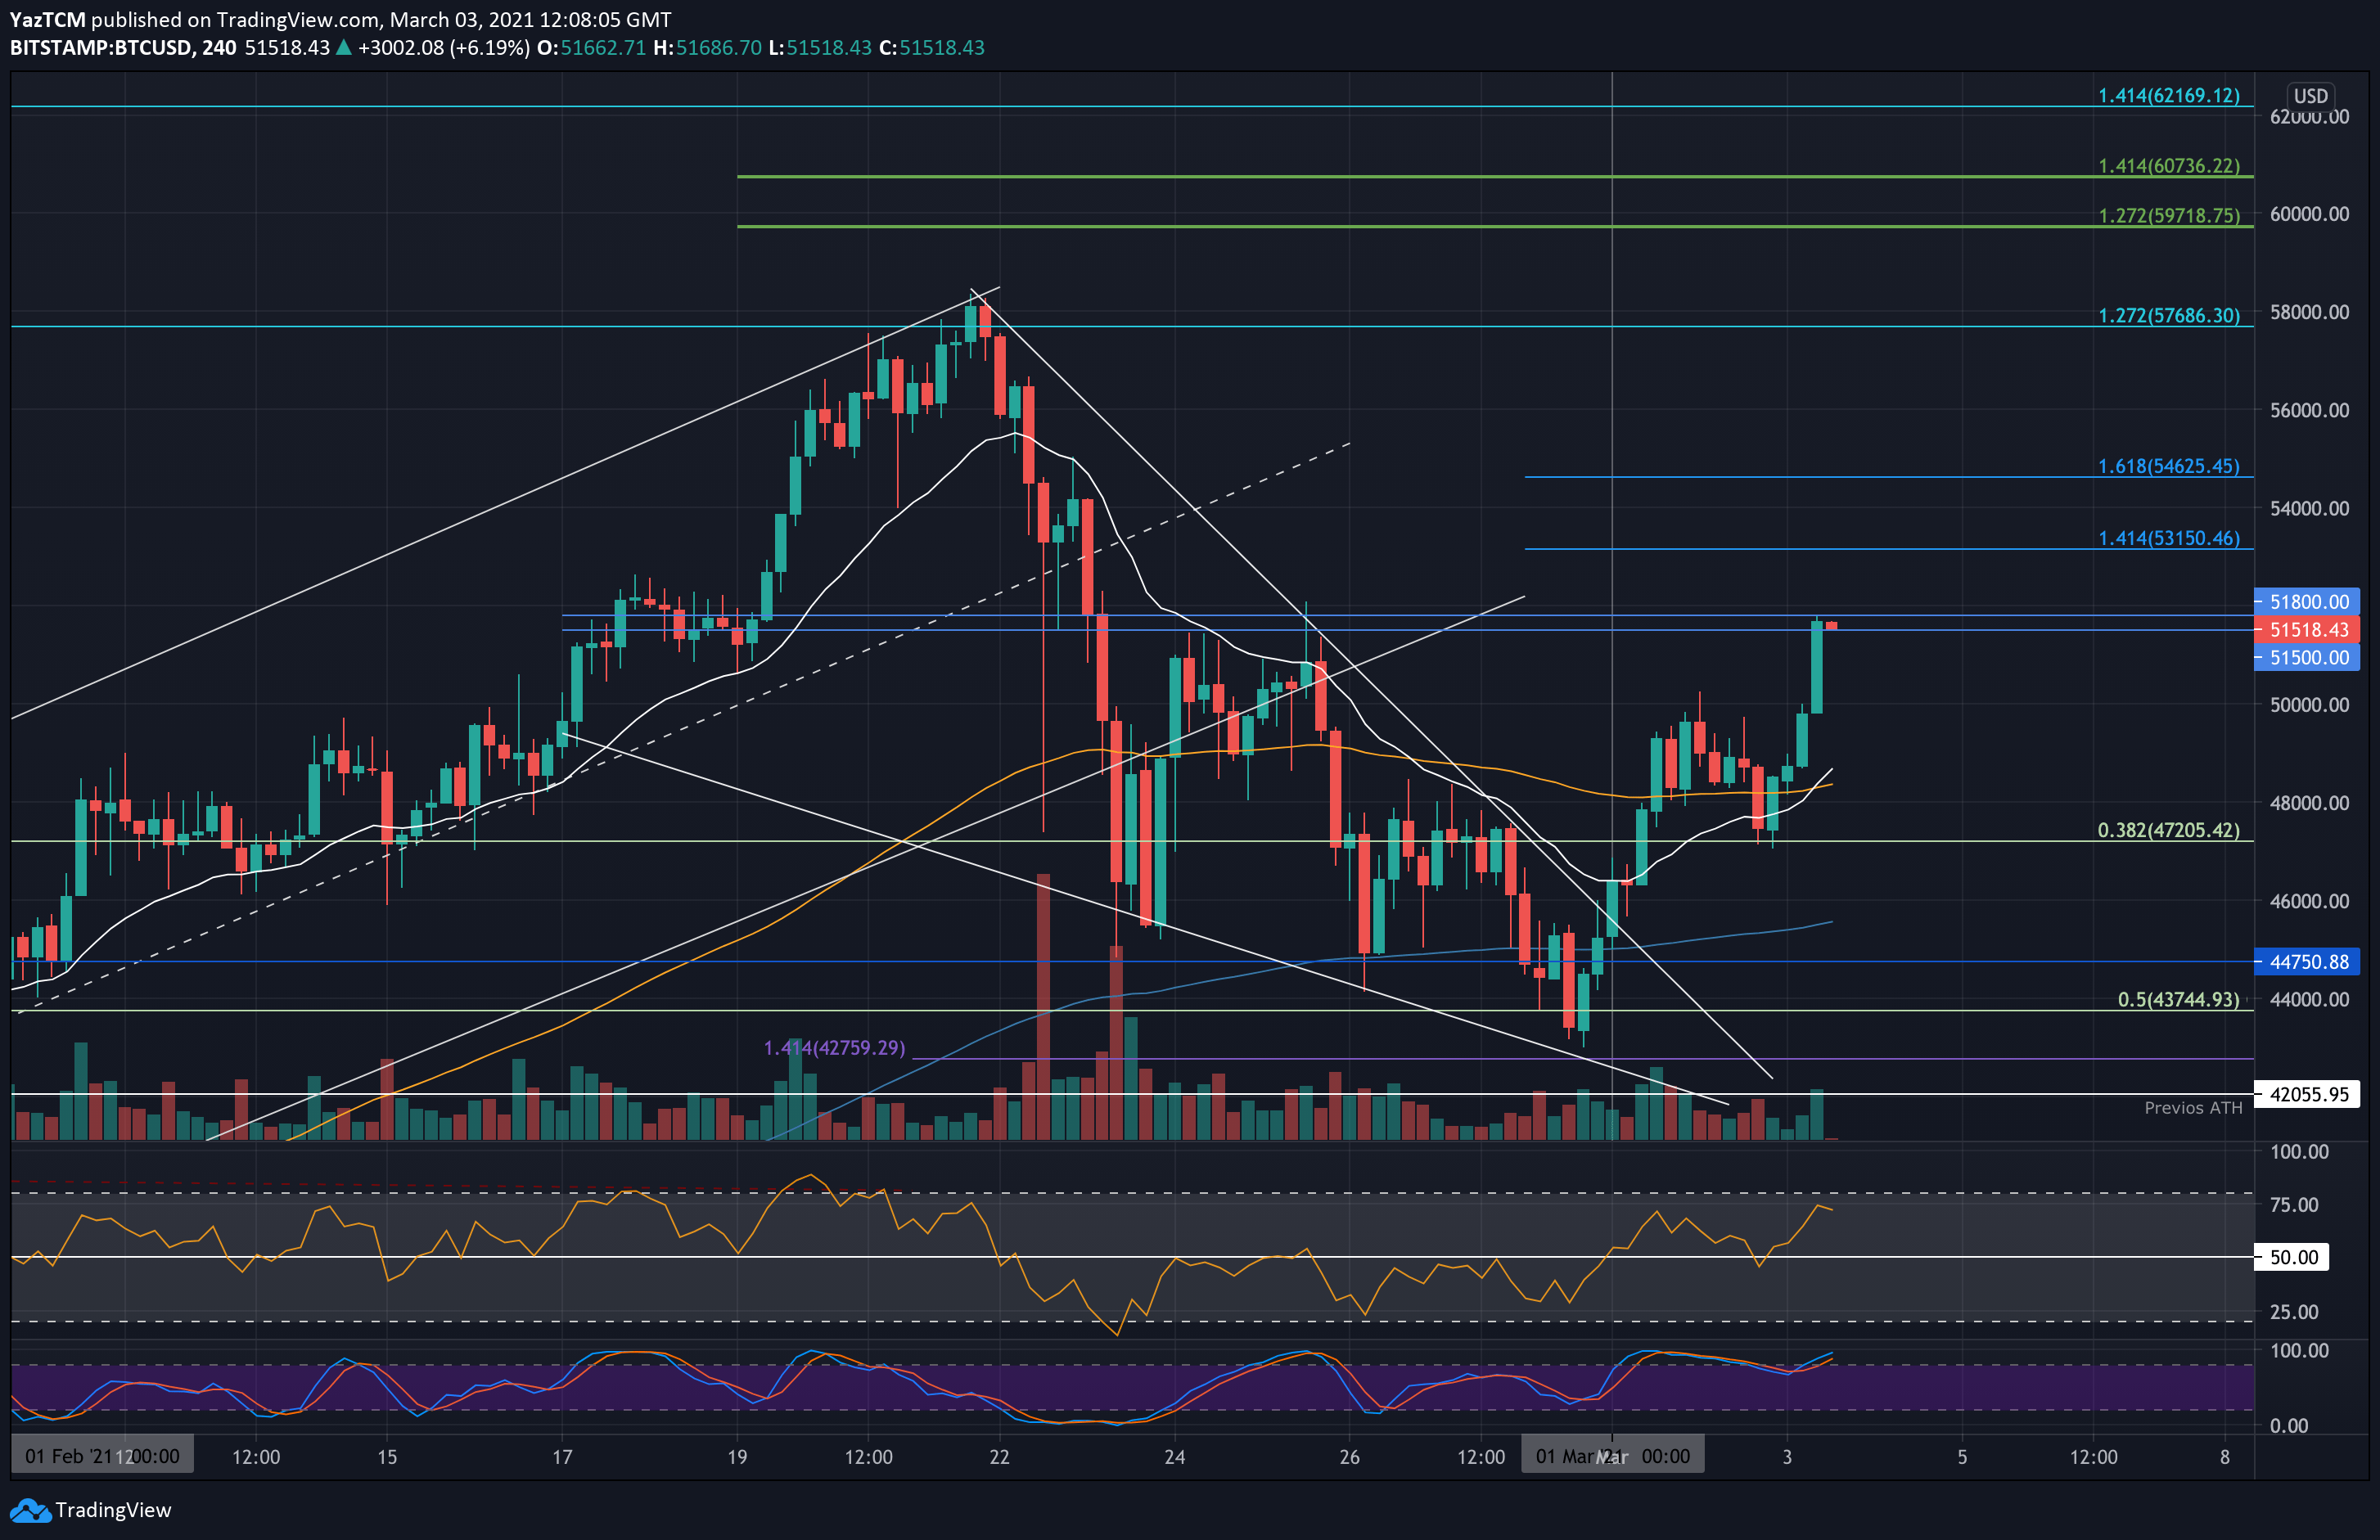
As of now, Bitcoin is facing a huge horizontal resistance area between $51,400 and $51,800.
BTC Price Support and Resistance Levels to Watch
Key Support Levels: $50,000, $48,000, $47,200, $46,000, $44,750.
Key Resistance Levels: $51,400, $51,800 – $52,000, $53,150, $54,000, $54,625, $56,000.
Moving forward, the first level of resistance lies at $51,800. This is closely followed by $52,000. Beyond this, additional resistance lies at $53,150 (short term 1.414 Fib Extension), $54,000, $54,625 (short term 1.618 Fib Extension), and $56,000.
On the other side, the first support lies at $50,000. This is followed by $48,000 (20-EMA line), $47,200 (.382 Fib and yesterday’s low), $46,000, and $44,750.
The daily RSI is now back above the midline as the buyers re-take control of the market momentum. If it continues to rise above 50, the bullish momentum will increase and push BTC back to the ATH levels again.
Bitstamp BTC/USD Daily Chart
Bitstamp BTC/USD 4-Hour Chart