Bitcoin dropped by a small 2.8% today after failing to breach resistance at ,000 yesterday. The cryptocurrency increased by 22.5% over the past week of trading as it surged higher to meet resistance at ,570 (1.414 Fib Extension green).Yesterday, Bitcoin was able to breach the significant resistance at ,570 but struggled to advance above the next major supply zone at ,500 – ,000. It then failed to close the daily candle above ,570, and drop further down to retest below ,000. However, the bulls quickly bought the dip, and just a few hours later Bitcoin is trading again above K, as of writing these lines.Bitcoin has been relying on the midline of the ascending price channel as solid support since the 8th of February, 2021, as can be seen on the following 4-hour chart.
Topics:
Yaz Sheikh considers the following as important: Bitcoin (BTC) Price, BTC Analysis, BTCEUR, BTCGBP, btcusd, btcusdt
This could be interesting, too:
Chayanika Deka writes XRP, SOL, and ADA Inclusion in US Crypto Reserve Pushes Traders on Edge
Chayanika Deka writes Why Arthur Hayes Is Bullish on Bitcoin Under Trump’s Economic Strategy
Mandy Williams writes Why the Bitcoin Market Is Stuck—and the Key Metric That Could Change It: CryptoQuant CEO
Wayne Jones writes Metaplanet Acquires 156 BTC, Bringing Total Holdings to 2,391
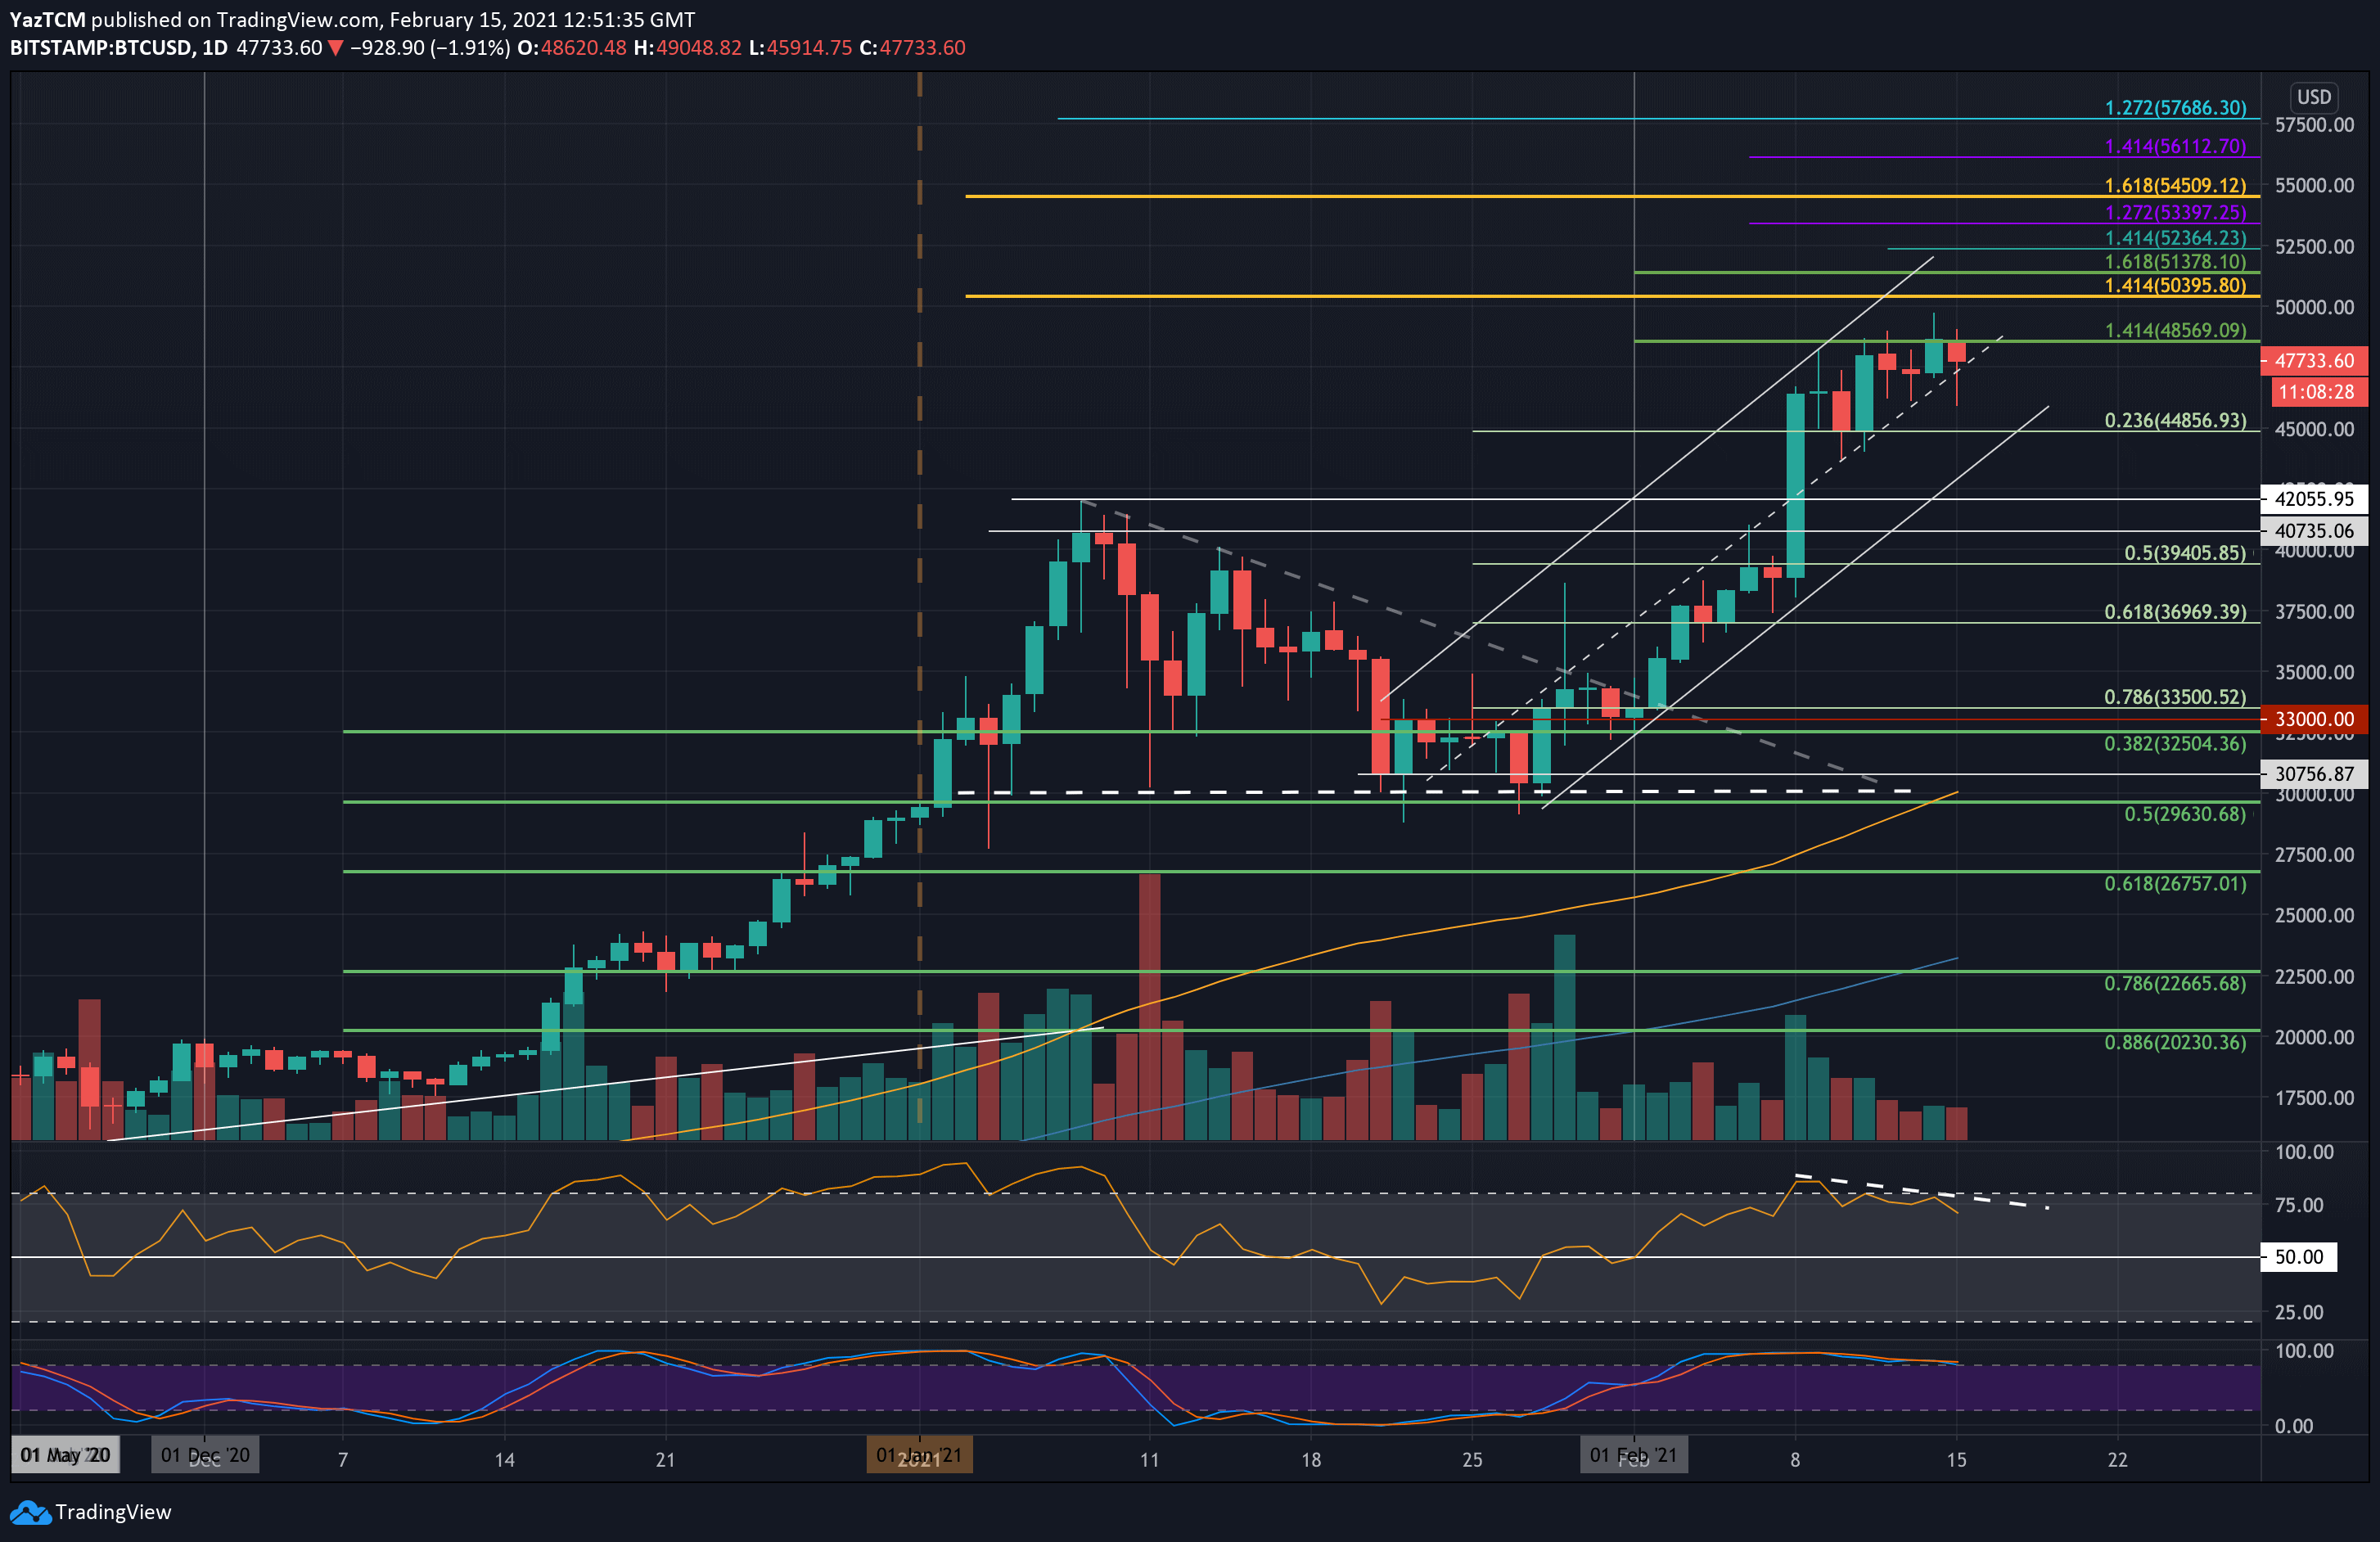
Bitcoin dropped by a small 2.8% today after failing to breach resistance at $50,000 yesterday. The cryptocurrency increased by 22.5% over the past week of trading as it surged higher to meet resistance at $48,570 (1.414 Fib Extension green).
Yesterday, Bitcoin was able to breach the significant resistance at $48,570 but struggled to advance above the next major supply zone at $49,500 – $50,000. It then failed to close the daily candle above $48,570, and drop further down to retest below $46,000. However, the bulls quickly bought the dip, and just a few hours later Bitcoin is trading again above $48K, as of writing these lines.
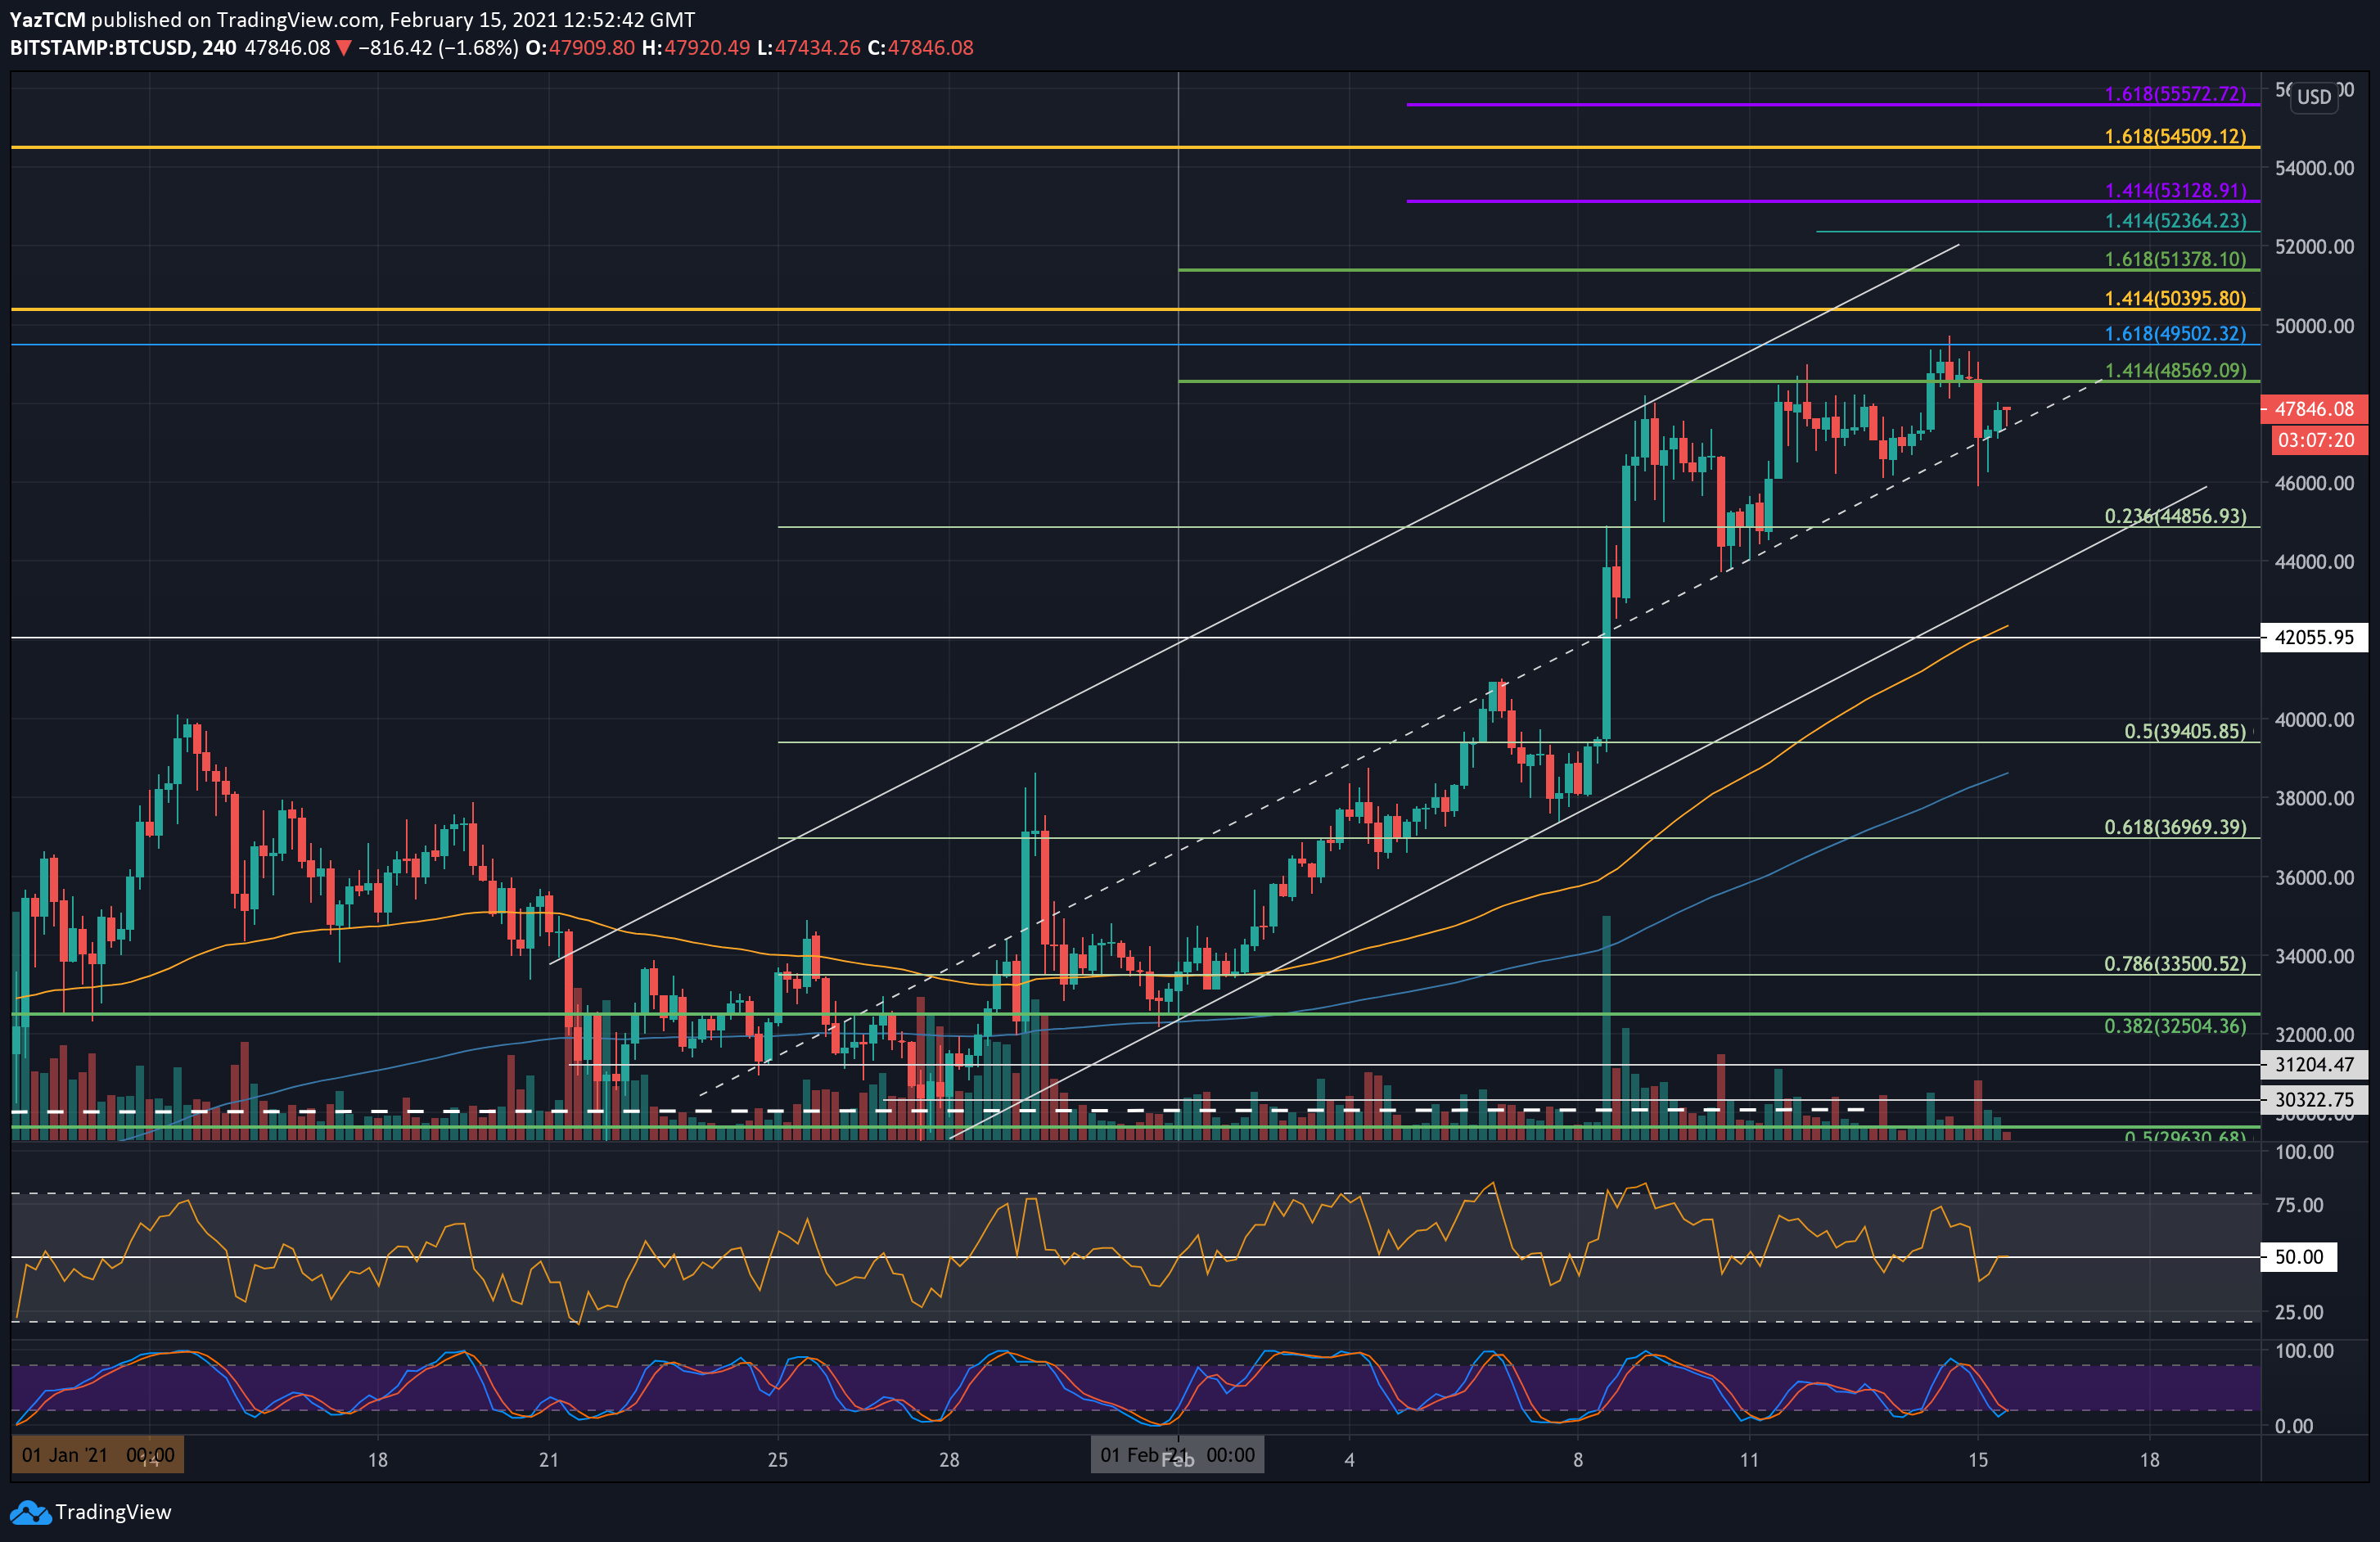
Bitcoin has been relying on the midline of the ascending price channel as solid support since the 8th of February, 2021, as can be seen on the following 4-hour chart. It has now also formed a short term ascending triangle pattern with the triangle’s top at $48,570.
A daily candle close above $48,570 will be required to allow Bitcoin to head above the psychological $50,000 barrier.
BTC Price Support and Resistance Levels to Watch
Key Support Levels: $47,500, $46,000, $44,855, $44,000, $42,000.
Key Resistance Levels: $48,570, $49,500, $50,000, $50,400, $41,380.
Looking ahead, the first level of resistance lies at $48,570 (1.414 Fib Extension – green). This is followed by $49,500 (short term 1.618 Fib Extension) and $50,000. Beyond $50,000, additional resistance lies at $50,400 (1.414 Fib Extension – yellow) and $51,380 (1.618 Fib Extension – green).
On the other side, the first support lies at the ascending price channel’s midline – around $47,500. Beneath this, support lies at $46,000 ($45,914 is today’s low according to Bitstamp), $44,855 (.236 Fib), $44,000 (lower boundary of the price channel), and $42,000.
Despite the bullishness, the RSI on both timeframes is starting to show hints of a bearish divergence as the price makes higher highs while the RSI fails to do the same. This might suggest that a brief pullback may be occurring for Bitcoin while the divergence plays out.
Bitstamp BTC/USD Daily Chart
Bitstamp BTC/USD 4-Hour Chart