Bitcoin’s price dropped by 3% today, as the cryptocurrency falls to a daily low of .5K, which is the 0.382 Fib level. After the quick drop, BTC was able to bounce nicely.Just yesterday, Bitcoin had seen another failed attempt to break the k milestone, which brings it to a total of three failed attempts to break the level over the past 3 days.Despite the decrease, the primary cryptocurrency is still trading above a short-term ascending trend line that has been in play since the beginning of March.Today, the rebound from ,465 has allowed Bitcoin to establish a range between ,000 and K, with a strong S/R level of around .5K. The coin would now need to break one of the boundaries of this range to dictate the market’s next direction.There are two bullish signs – first, Bitcoin
Topics:
Yaz Sheikh considers the following as important: Bitcoin (BTC) Price, BTC Analysis, BTCEUR, BTCGBP, btcusd, btcusdt
This could be interesting, too:
Chayanika Deka writes XRP, SOL, and ADA Inclusion in US Crypto Reserve Pushes Traders on Edge
Chayanika Deka writes Why Arthur Hayes Is Bullish on Bitcoin Under Trump’s Economic Strategy
Mandy Williams writes Why the Bitcoin Market Is Stuck—and the Key Metric That Could Change It: CryptoQuant CEO
Wayne Jones writes Metaplanet Acquires 156 BTC, Bringing Total Holdings to 2,391
Bitcoin’s price dropped by 3% today, as the cryptocurrency falls to a daily low of $55.5K, which is the 0.382 Fib level. After the quick drop, BTC was able to bounce nicely.
Just yesterday, Bitcoin had seen another failed attempt to break the $60k milestone, which brings it to a total of three failed attempts to break the level over the past 3 days.
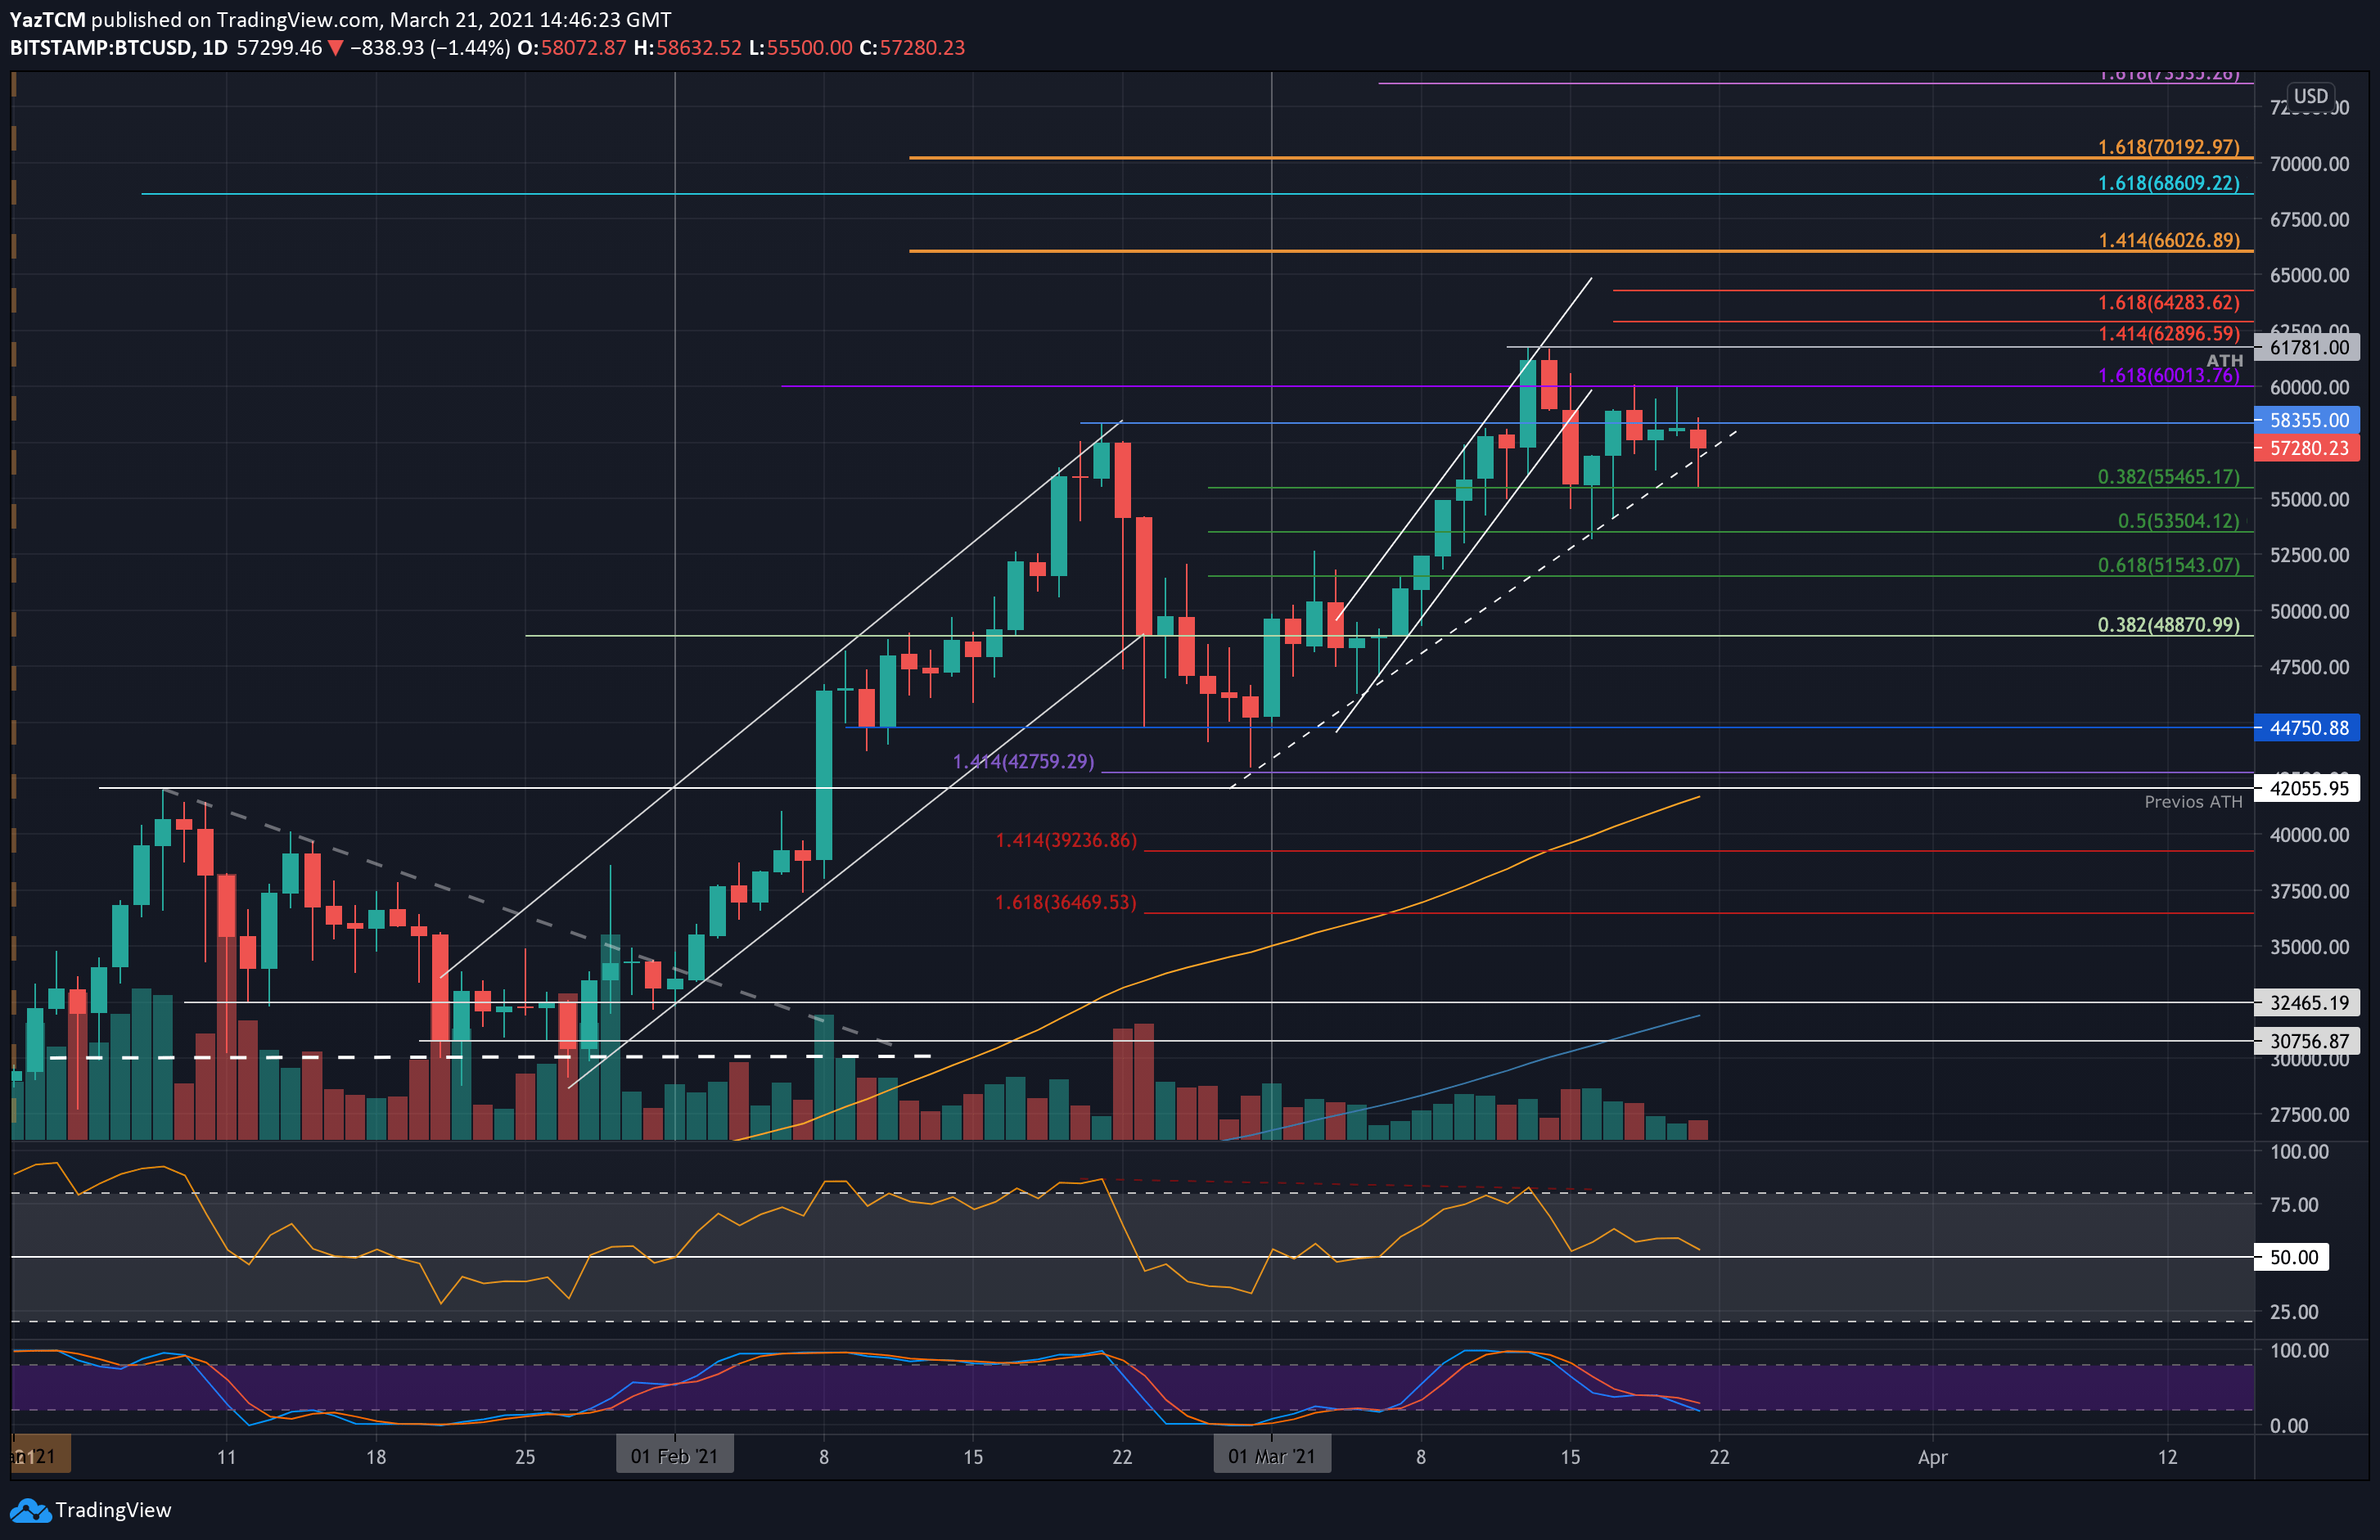
Despite the decrease, the primary cryptocurrency is still trading above a short-term ascending trend line that has been in play since the beginning of March.
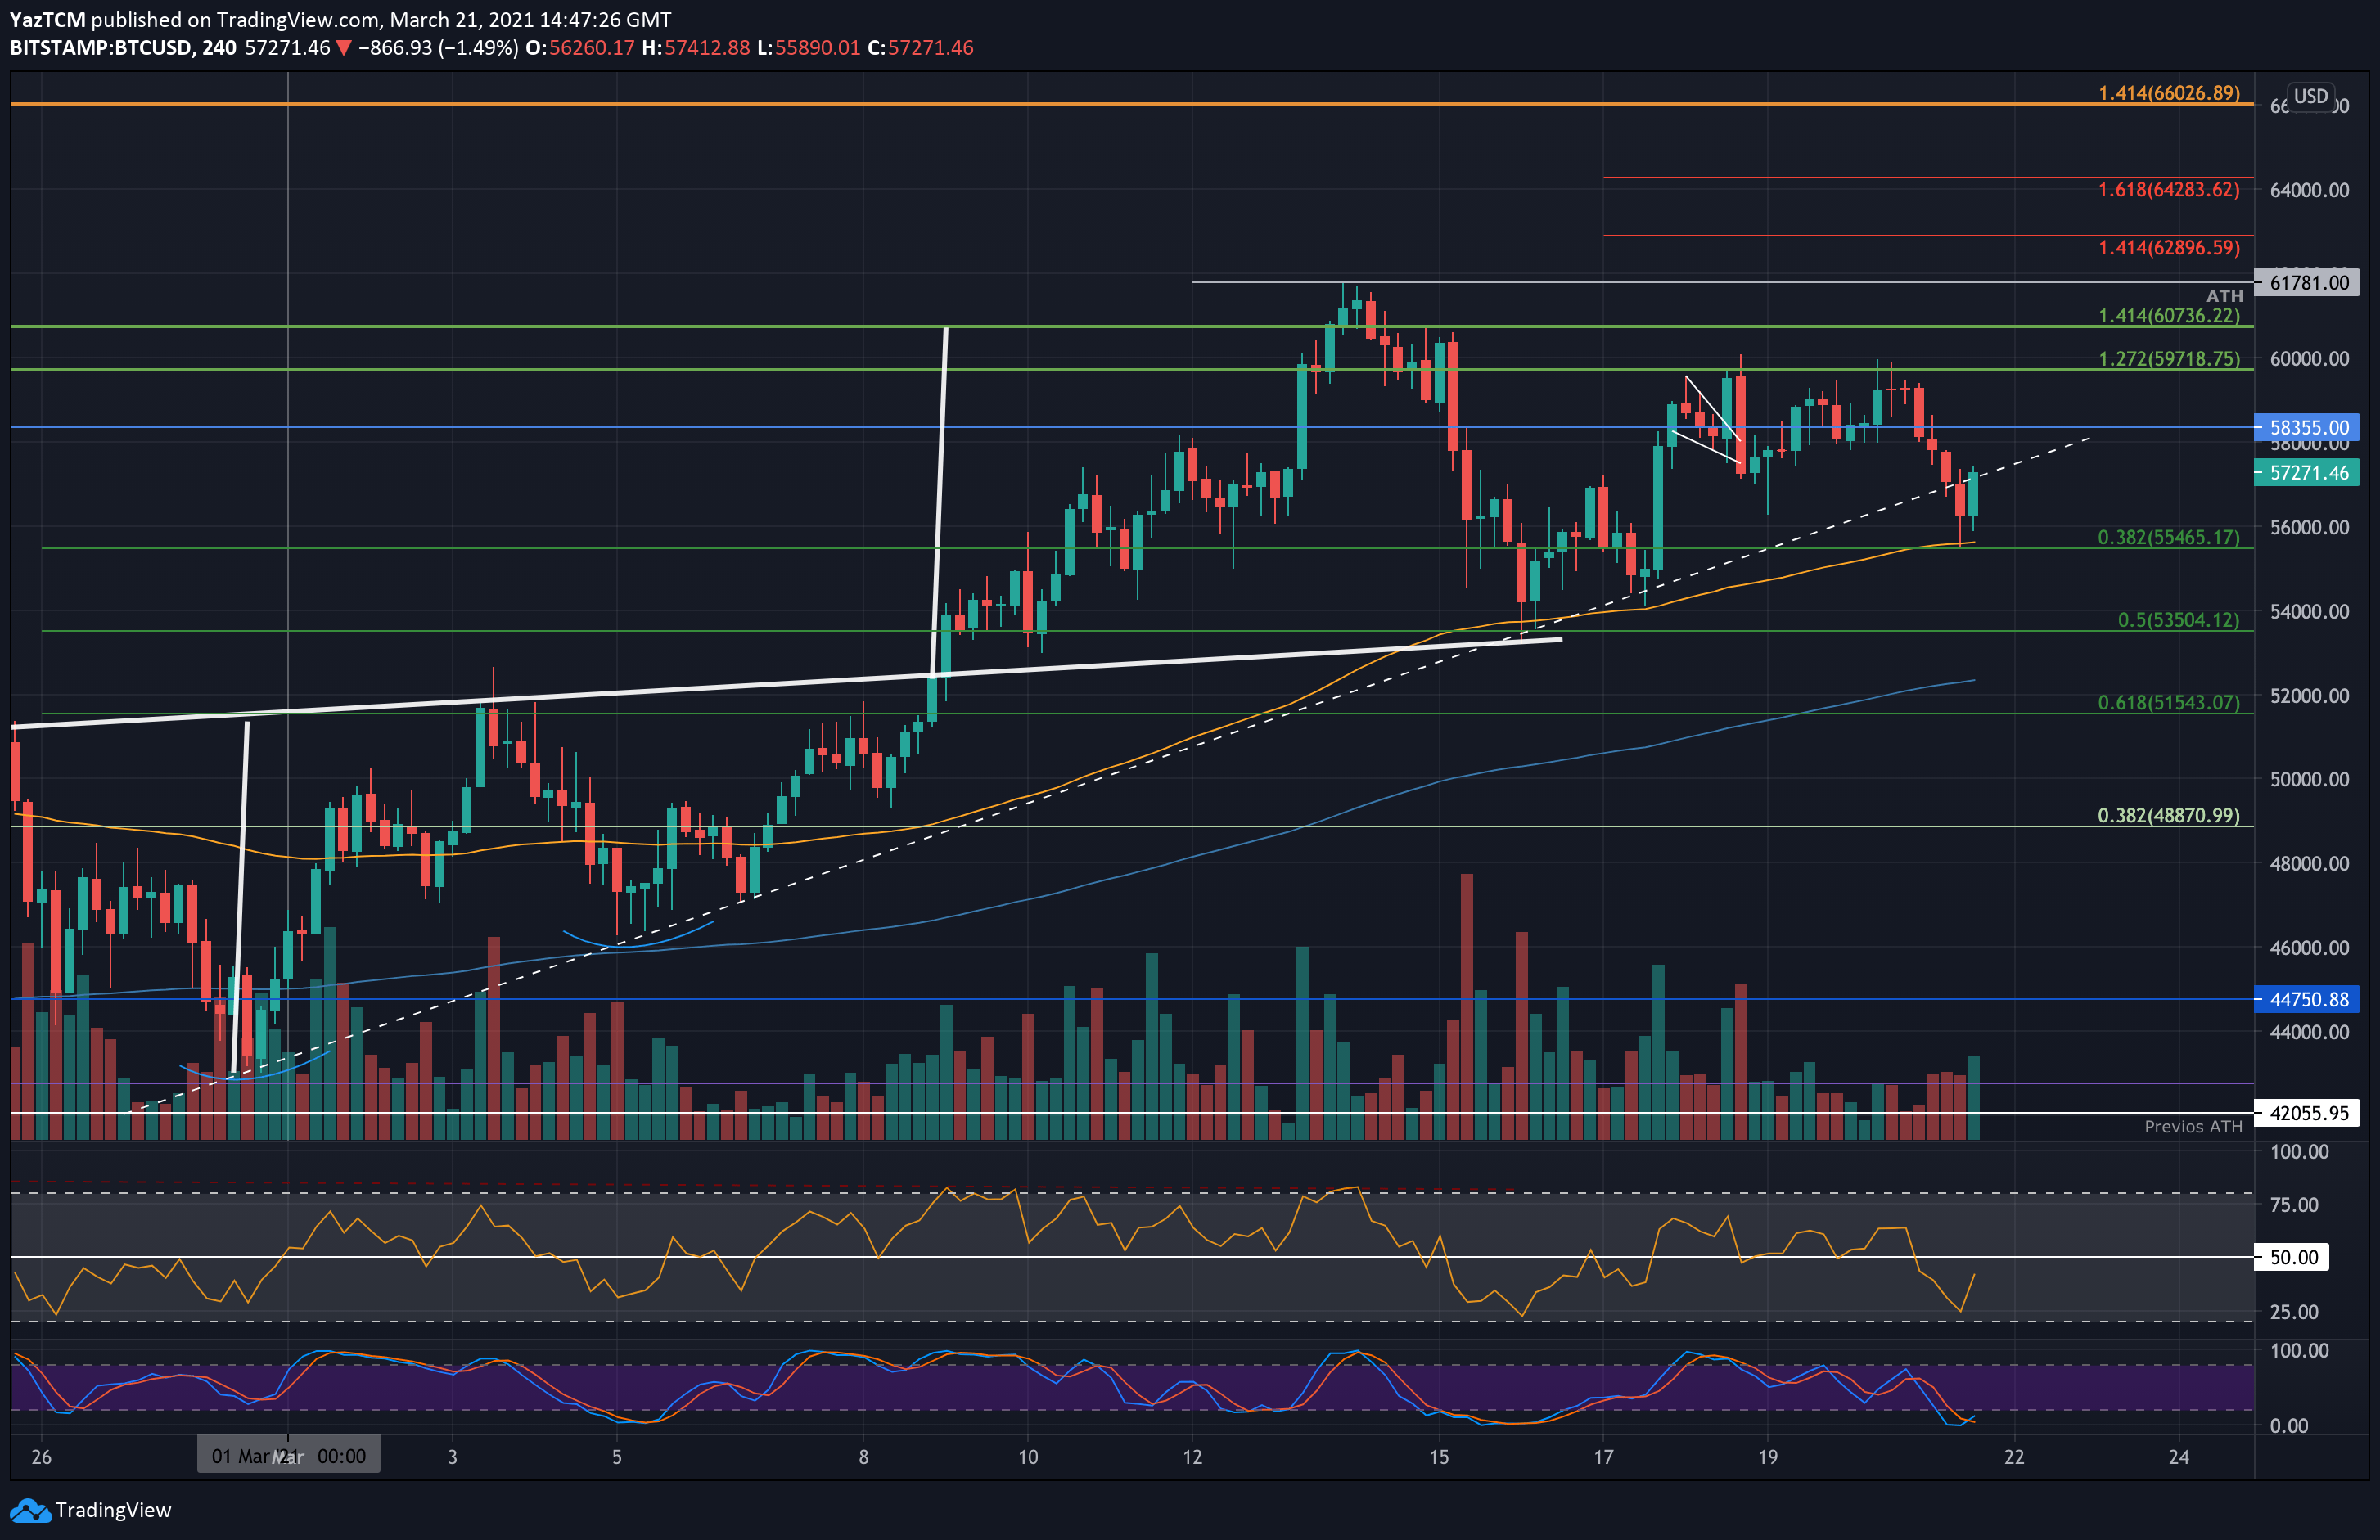
Today, the rebound from $55,465 has allowed Bitcoin to establish a range between $60,000 and $55K, with a strong S/R level of around $57.5K. The coin would now need to break one of the boundaries of this range to dictate the market’s next direction.
There are two bullish signs – first, Bitcoin didn’t break the higher-lows positive trajectory on the hourly chart. Second, today’s drop was followed by a minimal amount of trading volume. On the other hand, the fact that the $60k saw another third failed attempt and a quick rejection after it, might signal a red flag for the bulls.
BTC Price Support and Resistance Levels to Watch
Key Support Levels: $55,465, $53,500, $52,500, $51,540, $50,000.
Key Resistance Levels: $58,355, $60,000, $61,780, $62,900, $62,280.
Looking ahead, the first level of support lies at the short term ascending trend line.This is followed by $55,465 (.382 Fib, today’s low), $53,500 (.5 Fib), $52,500, and $51,540 (.618 Fib). Added support is then expected at $50,000 and $48,870 (.382 Fib).
On the other side, the first level of resistance lies at current level of $57.5K, followed by $58,355 (February highs). This is followed by $60,000, $61,780 (ATH Price), $62,900 (1.414 Fib Extension), $65,280 (1.618 Fib extension), and $65,000.
The Daily RSI is now reapproaching the midline, indicating that the bullish momentum is fading and indecision looms within the market. The current trading range characterizes this indecision, and a break beneath the 50 level on the RSI is likely to lead to Bitcoin falling beneath the current range.
Bitstamp BTC/USD Daily Chart
Bitstamp BTC/USD 4-Hour Chart