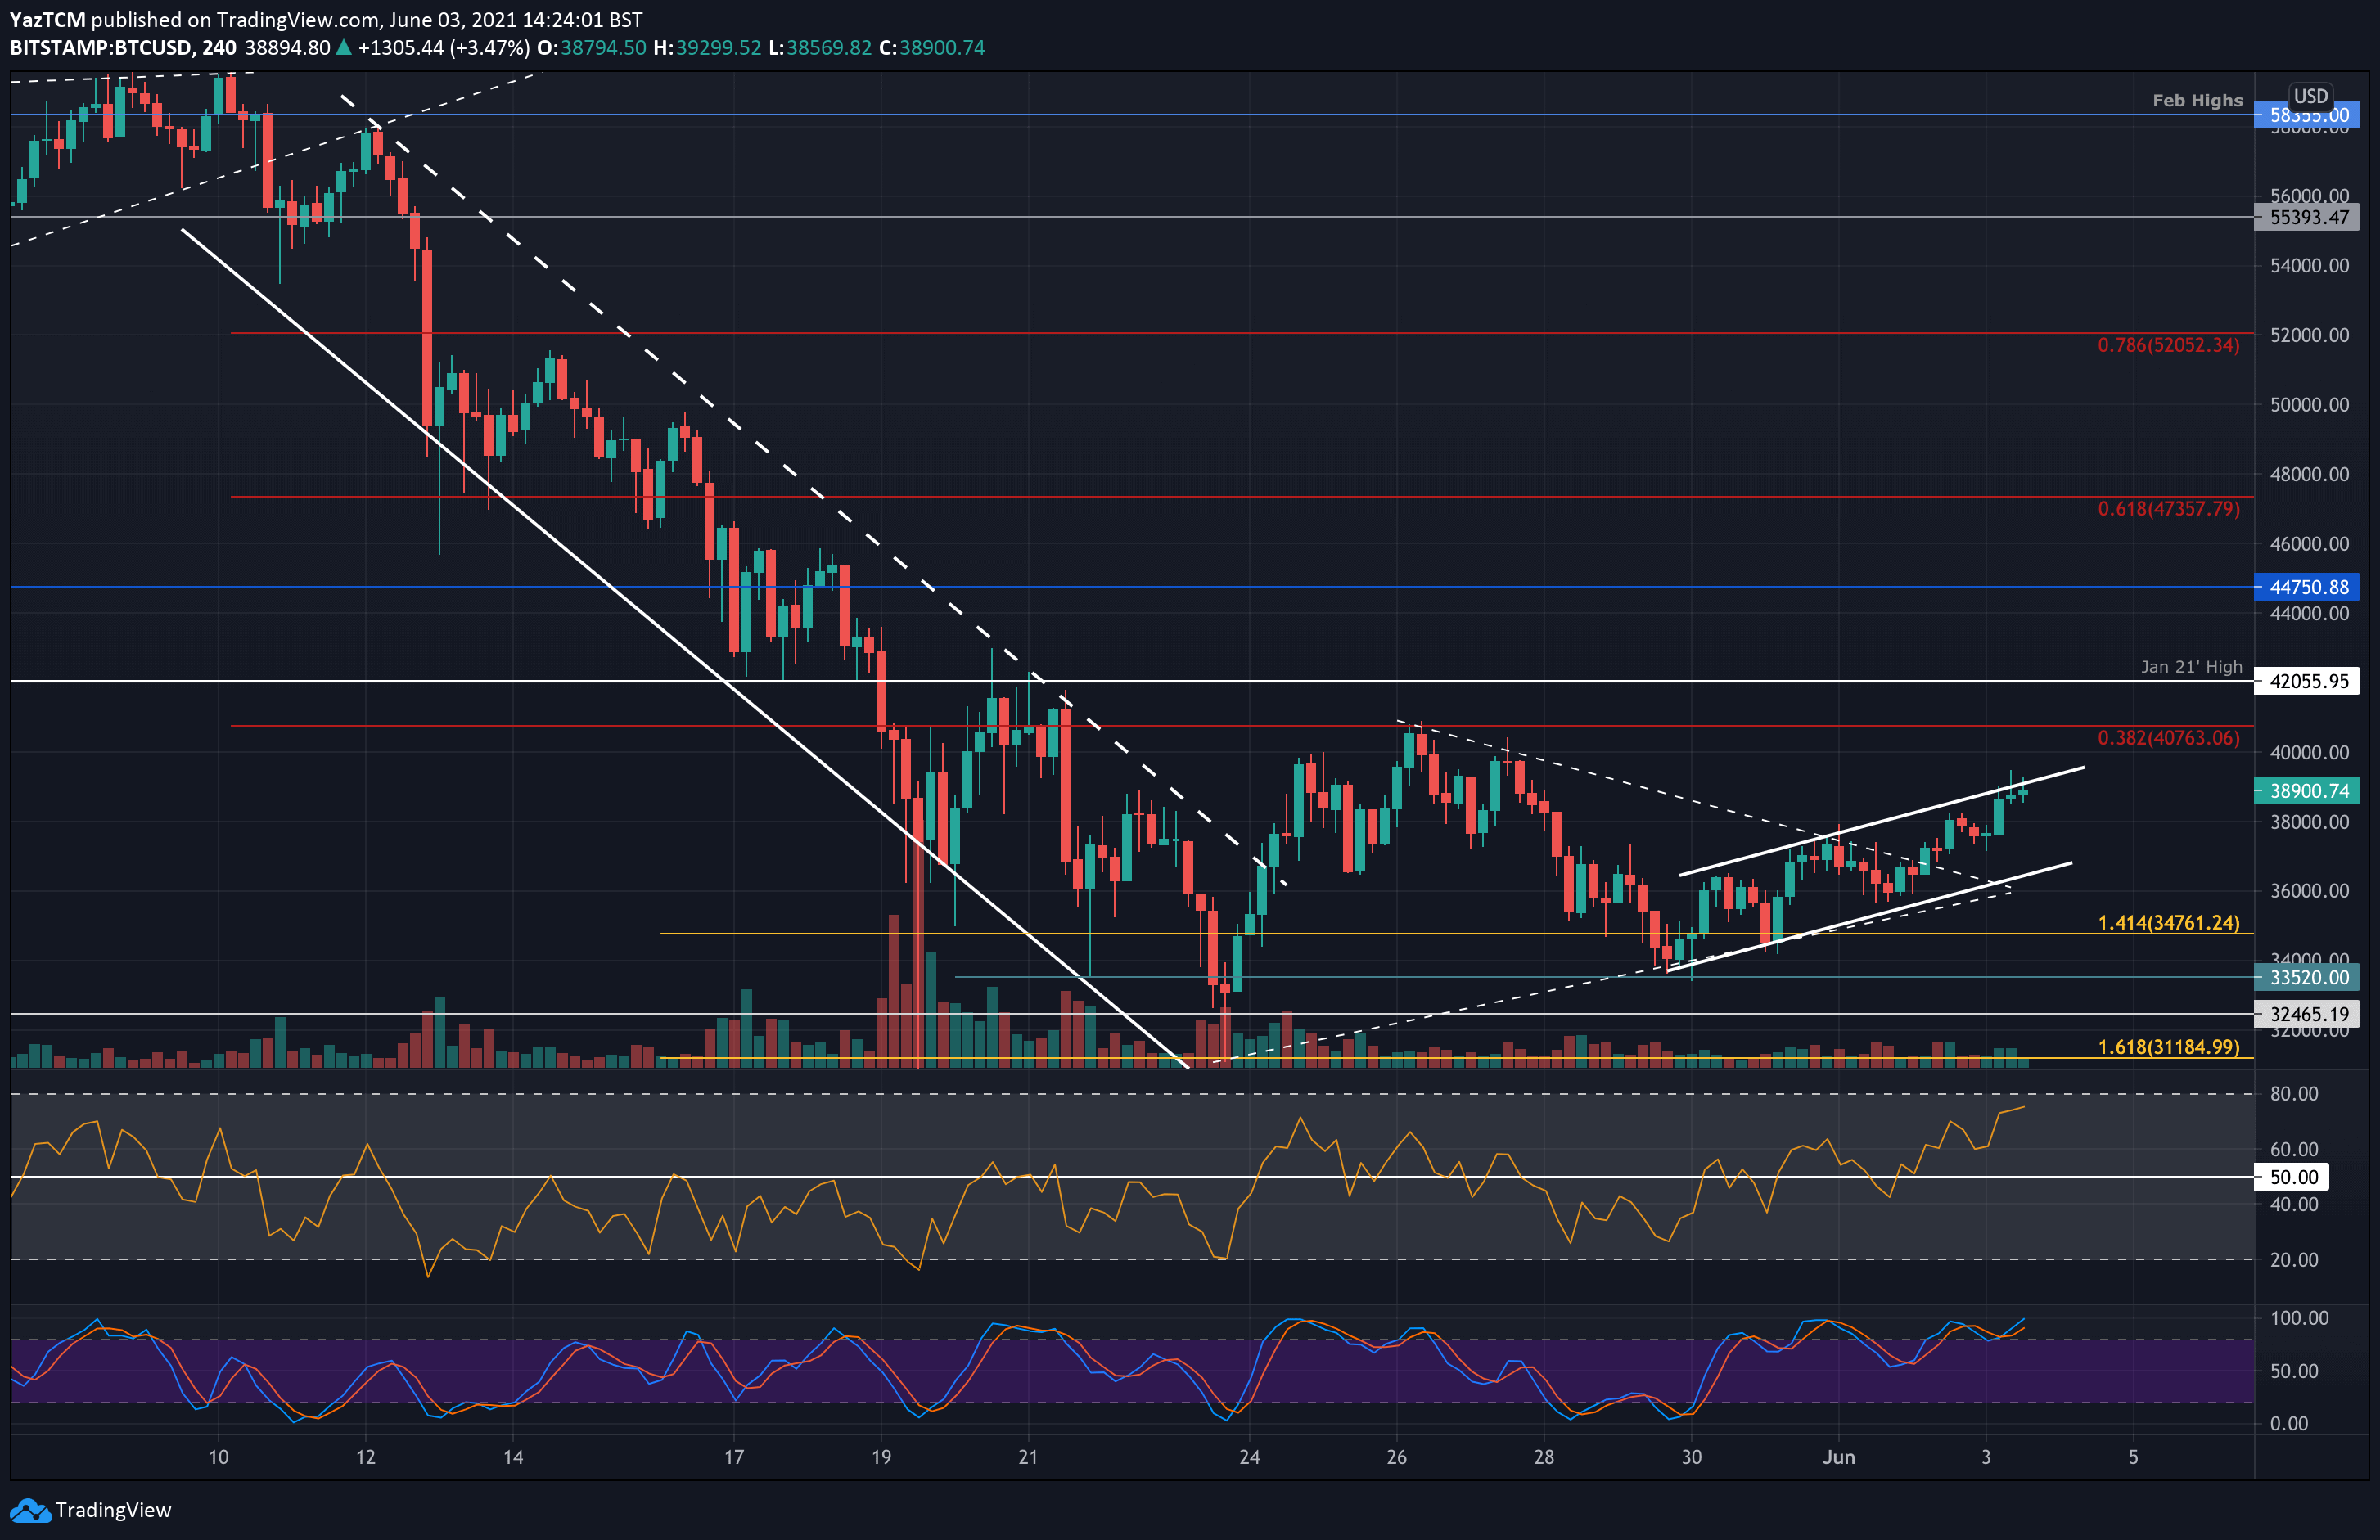
Bitcoin is up by a solid 5% today as it spiked as high as ,500 and reached the 20-day moving average line, before getting rejected shortly after. Despite this, bitcoin had made another bullish step towards a retest and a possible breakout of the critical -42k demand zone. In addition, the cryptocurrency had been trading inside a symmetrical triangle pattern over the past week since rejecting sharply from the resistance at ,760 (bearish .382 Fib & 200-day MA) last week. From there, it went on to drop lower but found support around ,000 over the weekend, where it rebounded. The breakout of the symmetrical triangle pattern occurred yesterday as BTC surged to ,000. Today, the 5% price spike allowed BTC to break ,000 and reach as high as ,500 (daily high as
Topics:
Yaz Sheikh considers the following as important: Bitcoin (BTC) Price, BTC Analysis, BTCEUR, BTCGBP, btcusd, btcusdt
This could be interesting, too:
Chayanika Deka writes XRP, SOL, and ADA Inclusion in US Crypto Reserve Pushes Traders on Edge
Chayanika Deka writes Why Arthur Hayes Is Bullish on Bitcoin Under Trump’s Economic Strategy
Mandy Williams writes Why the Bitcoin Market Is Stuck—and the Key Metric That Could Change It: CryptoQuant CEO
Wayne Jones writes Metaplanet Acquires 156 BTC, Bringing Total Holdings to 2,391
Bitcoin is up by a solid 5% today as it spiked as high as $39,500 and reached the 20-day moving average line, before getting rejected shortly after. Despite this, bitcoin had made another bullish step towards a retest and a possible breakout of the critical $40-42k demand zone.
In addition, the cryptocurrency had been trading inside a symmetrical triangle pattern over the past week since rejecting sharply from the resistance at $40,760 (bearish .382 Fib & 200-day MA) last week. From there, it went on to drop lower but found support around $34,000 over the weekend, where it rebounded.
The breakout of the symmetrical triangle pattern occurred yesterday as BTC surged to $38,000. Today, the 5% price spike allowed BTC to break $38,000 and reach as high as $39,500 (daily high as of now).
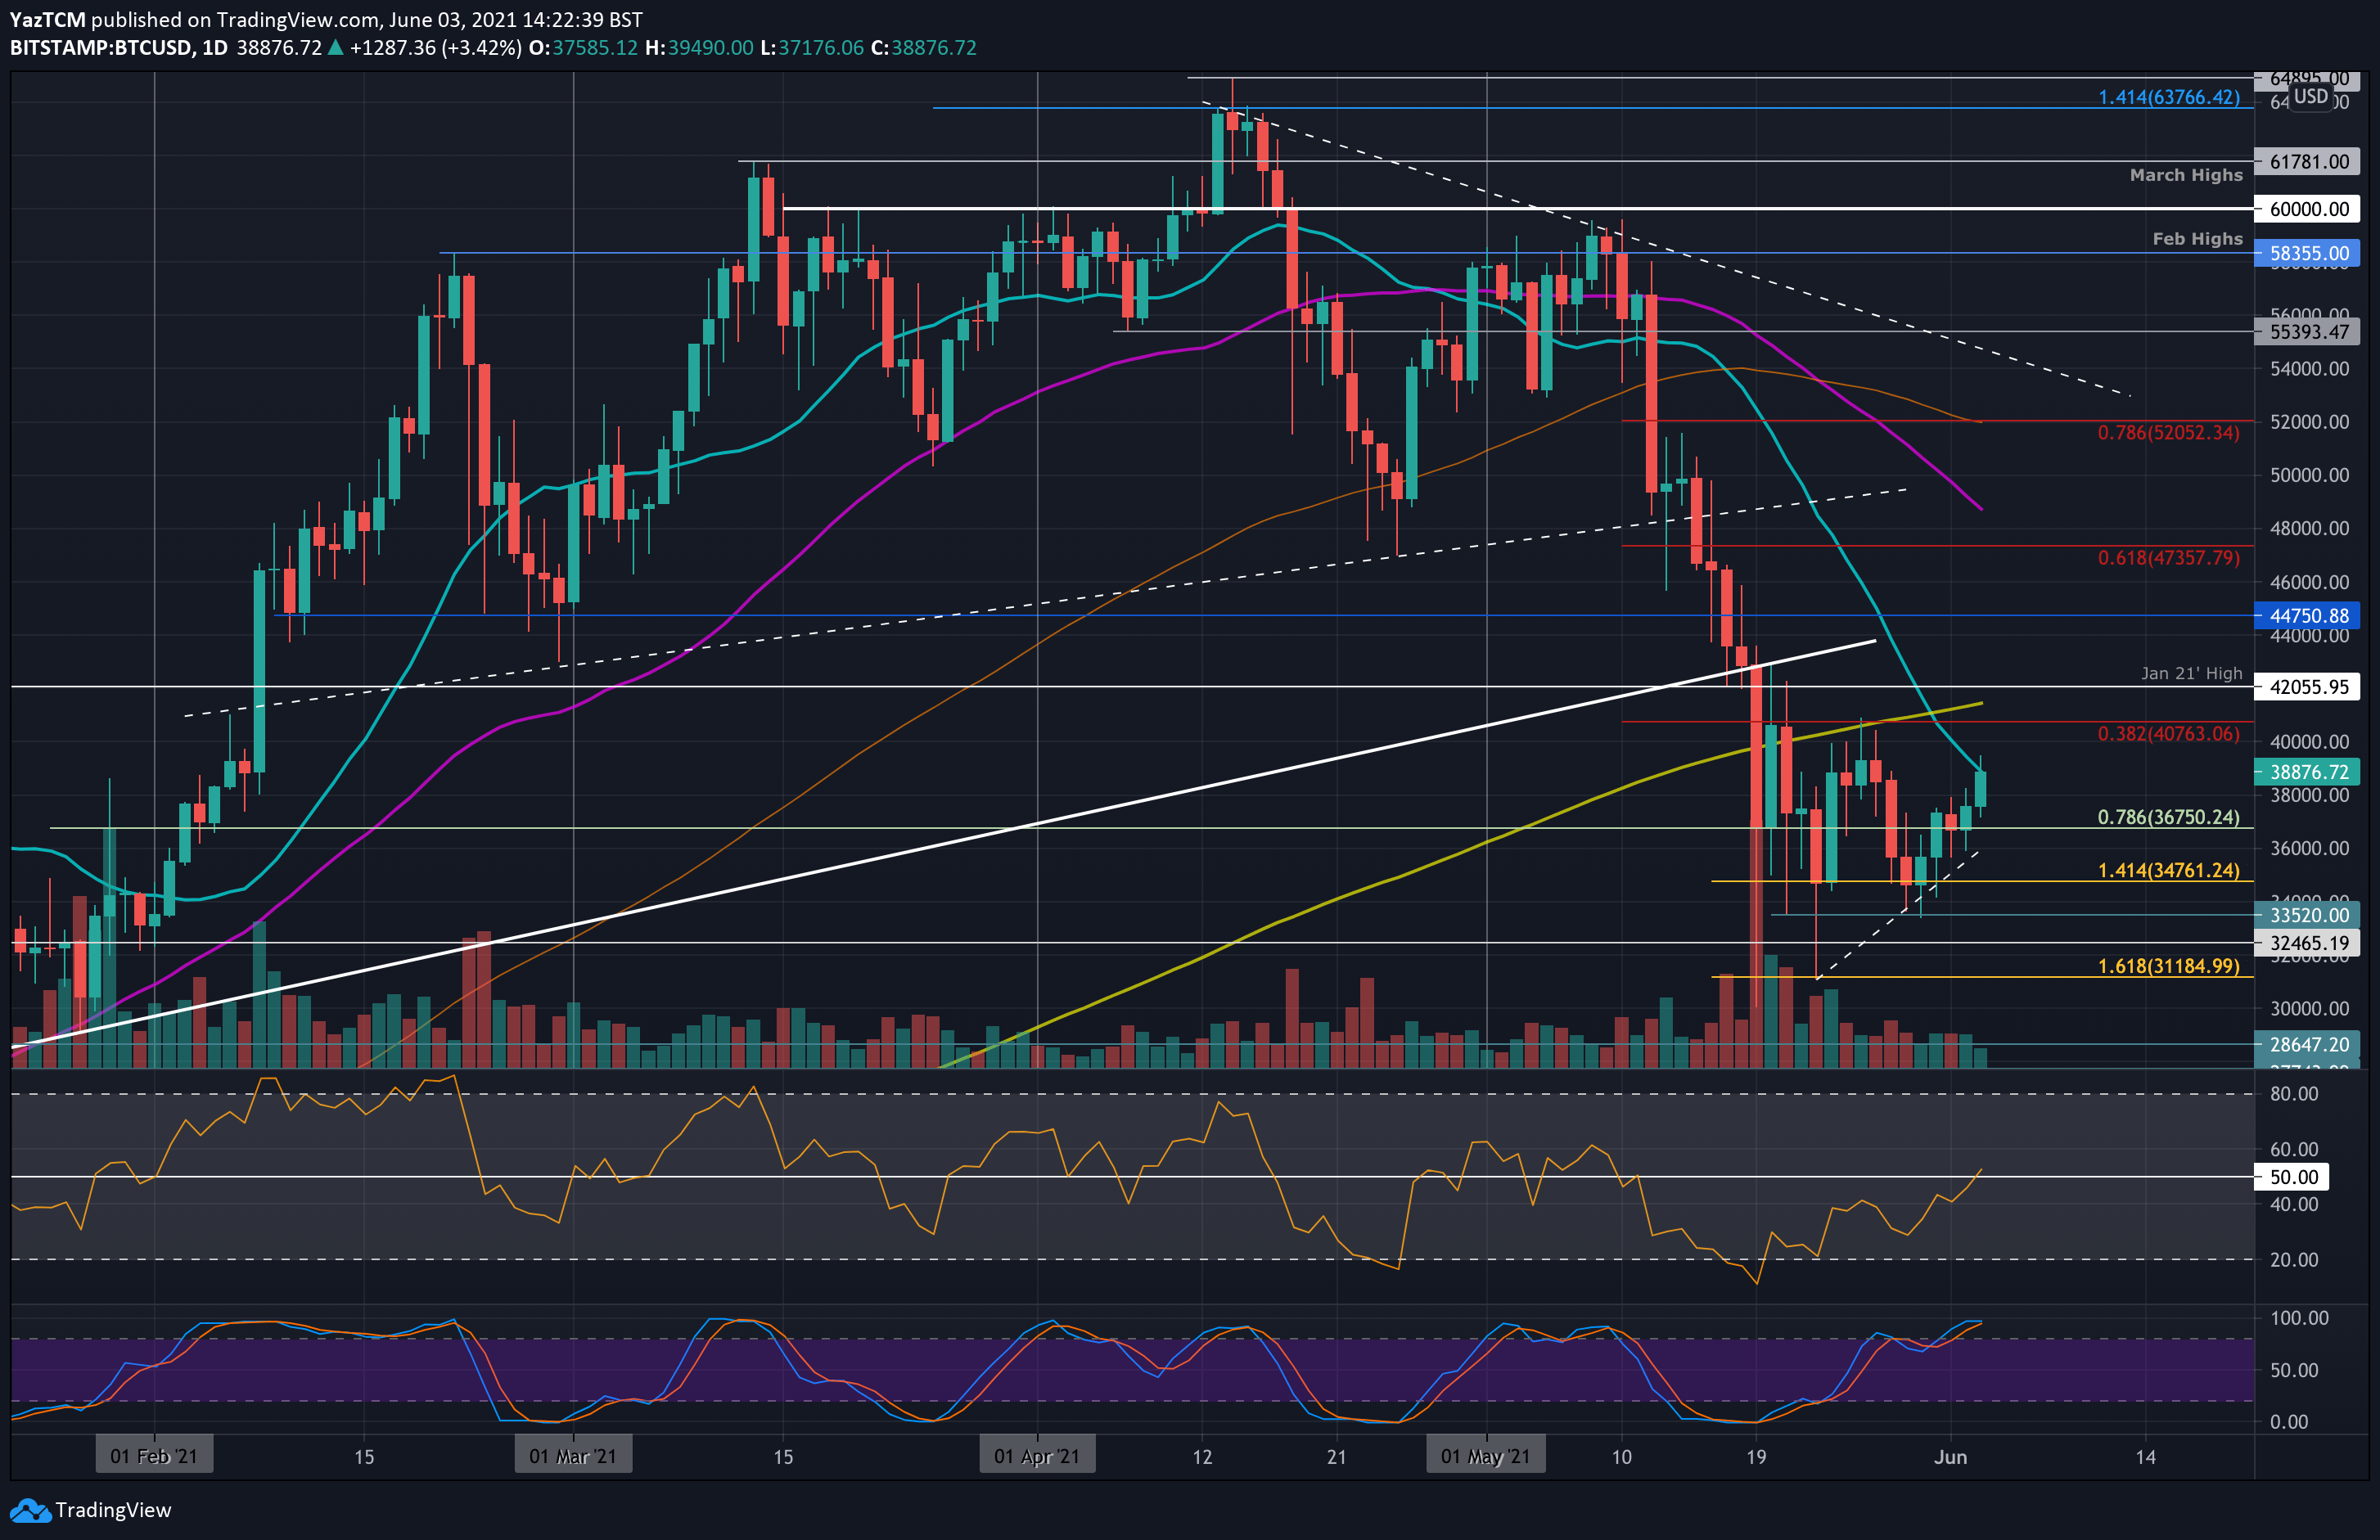
Since breaking the upper boundary of the triangle, BTC has now established a short-term ascending price channel and is testing the upper line of the channel. A breakout would allow BTC to break $40,000 and test last week’s resistance at $40,000. However, as mentioned above, Bitcoin marked $40-42k as the most critical zone on its way up and is still trading over 40% beneath its all-time high level of nearly $65k which was recorded on April 14, 2021.
BTC Price Support and Resistance Levels to Watch
Key Support Levels: $38,000, $36,700, $36,000, $34,760, $34,000.
Key Resistance Levels: $38,900, $40,000, $40,760, $41,475,$42,055.
Looking ahead, the first resistance lies at $38,900 (20-day MA & upper boundary of short-term price channel). This is followed by $40,000, $40,763 (bearish .382 Fib Retracement), $41,475 (200-day MA), $42,055 (Jan 2021 highs), and $44,750.
On the other side, the first support lies at $38,000. This is followed by $36,700 (lower boundary of the price channel), $36,000, $34,760 (downside 1.414 Fib Extension), $34,000, and $33,520.
The daily RSI has poked back above the midline to indicate bullish momentum is starting to creep back into the market. This is the first time the RSI has been bullish since May 9th, before the massive market capitulation occurred.
Bitstamp BTC/USD Daily Chart
Bitstamp BTC/USD 4-Hour Chart