In the middle of another volatile weekend for Bitcoin, the primary cryptocurrency is up by 11% from the K low that was recorded yesterday, and is now facing resistance above K. On Friday, bitcoin saw a sharp drop from the k price area until finding support at k on Saturday. Looking at the following short-term 4-hour’s chart, this was the fifth time the K price range ‘saved’ bitcoin since May-19. The Daily Chart: Bullish Double Bottom? As mentioned in our most recent BTC analysis, the coin was trading inside a short-term ascending triangle pattern. It did manage to break above but struggled to overcome resistance at ,000 on Friday, and the breakout quickly turned into a fake-out (false breakout). From there, the bears popped, and BTC’s price dropped
Topics:
Yaz Sheikh considers the following as important: Bitcoin (BTC) Price, BTC Analysis, BTCEUR, BTCGBP, btcusd, btcusdt
This could be interesting, too:
Chayanika Deka writes XRP, SOL, and ADA Inclusion in US Crypto Reserve Pushes Traders on Edge
Chayanika Deka writes Why Arthur Hayes Is Bullish on Bitcoin Under Trump’s Economic Strategy
Mandy Williams writes Why the Bitcoin Market Is Stuck—and the Key Metric That Could Change It: CryptoQuant CEO
Wayne Jones writes Metaplanet Acquires 156 BTC, Bringing Total Holdings to 2,391
In the middle of another volatile weekend for Bitcoin, the primary cryptocurrency is up by 11% from the $30K low that was recorded yesterday, and is now facing resistance above $33K. On Friday, bitcoin saw a sharp drop from the $35k price area until finding support at $30k on Saturday.
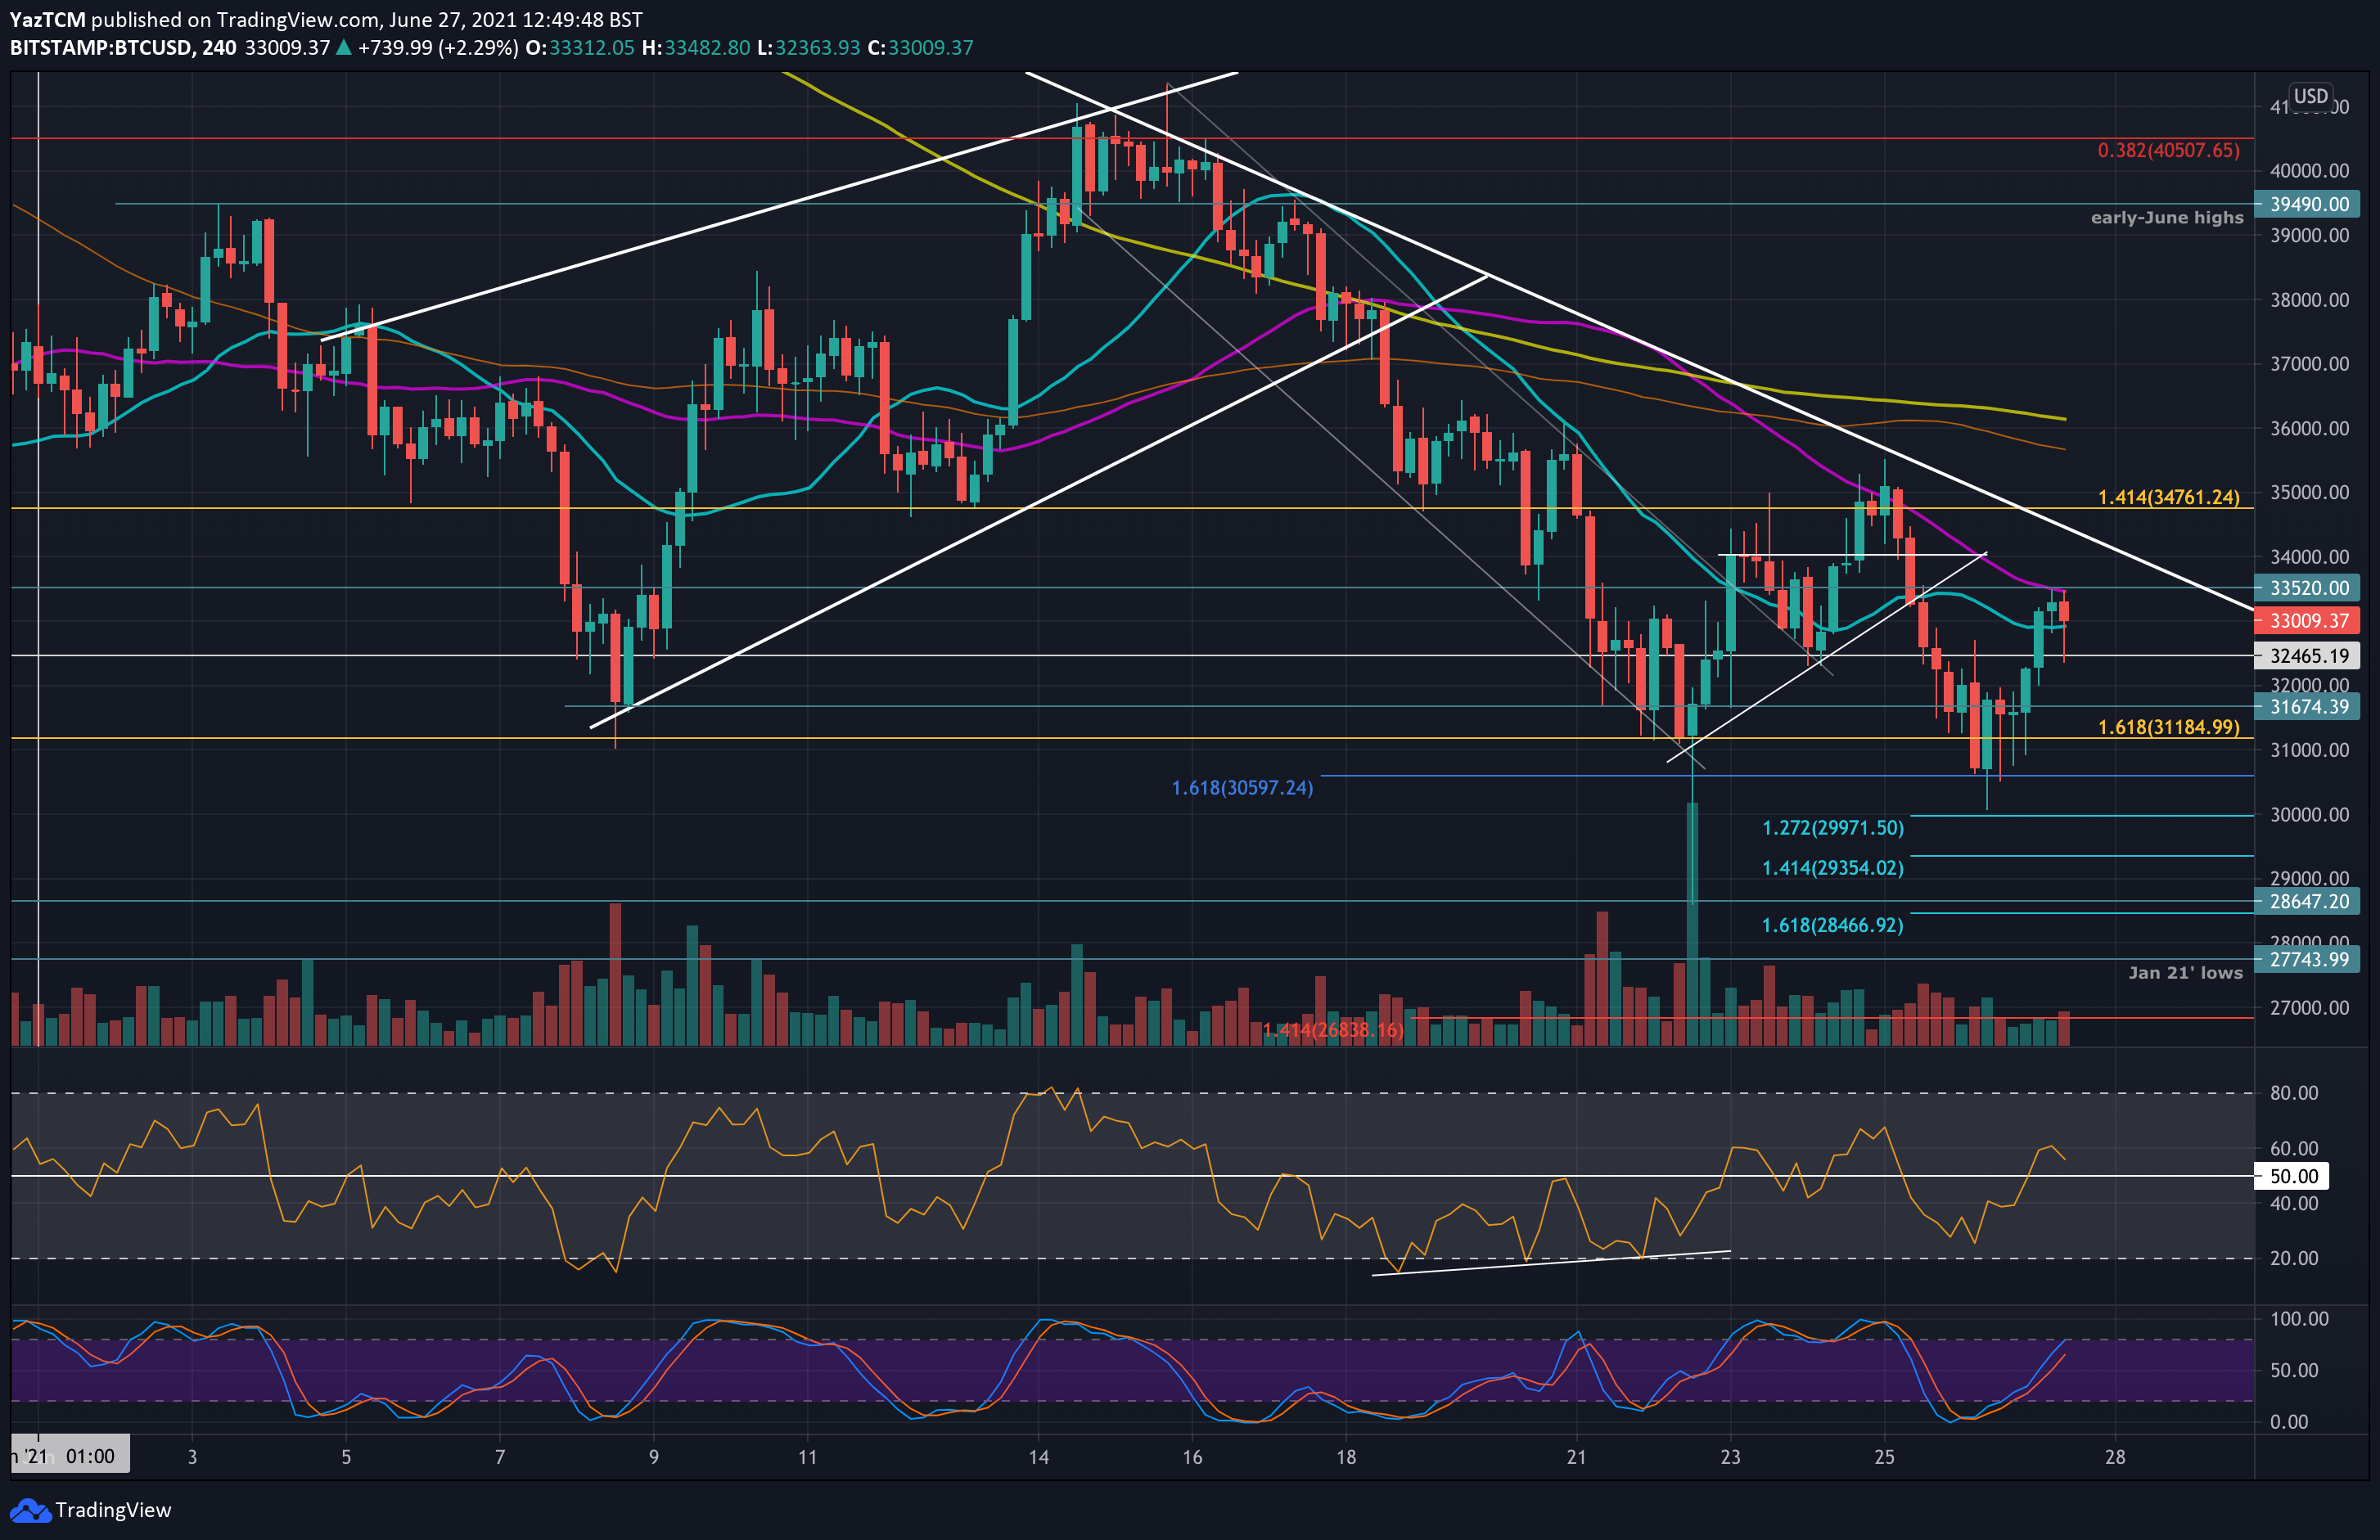
Looking at the following short-term 4-hour’s chart, this was the fifth time the $30K price range ‘saved’ bitcoin since May-19.
The Daily Chart: Bullish Double Bottom?
As mentioned in our most recent BTC analysis, the coin was trading inside a short-term ascending triangle pattern. It did manage to break above but struggled to overcome resistance at $35,000 on Friday, and the breakout quickly turned into a fake-out (false breakout).
From there, the bears popped, and BTC’s price dropped towards the $30-31K area once again. The primary cryptocurrency created a lower 4-hour closing candle at $30,600 (downside 1.618 Fib Extension) before touching as low as $30K (yesterday) but has since rebounded nicely. Over the past hours, Bitcoin was able to recover over $3K from Saturday’s low.
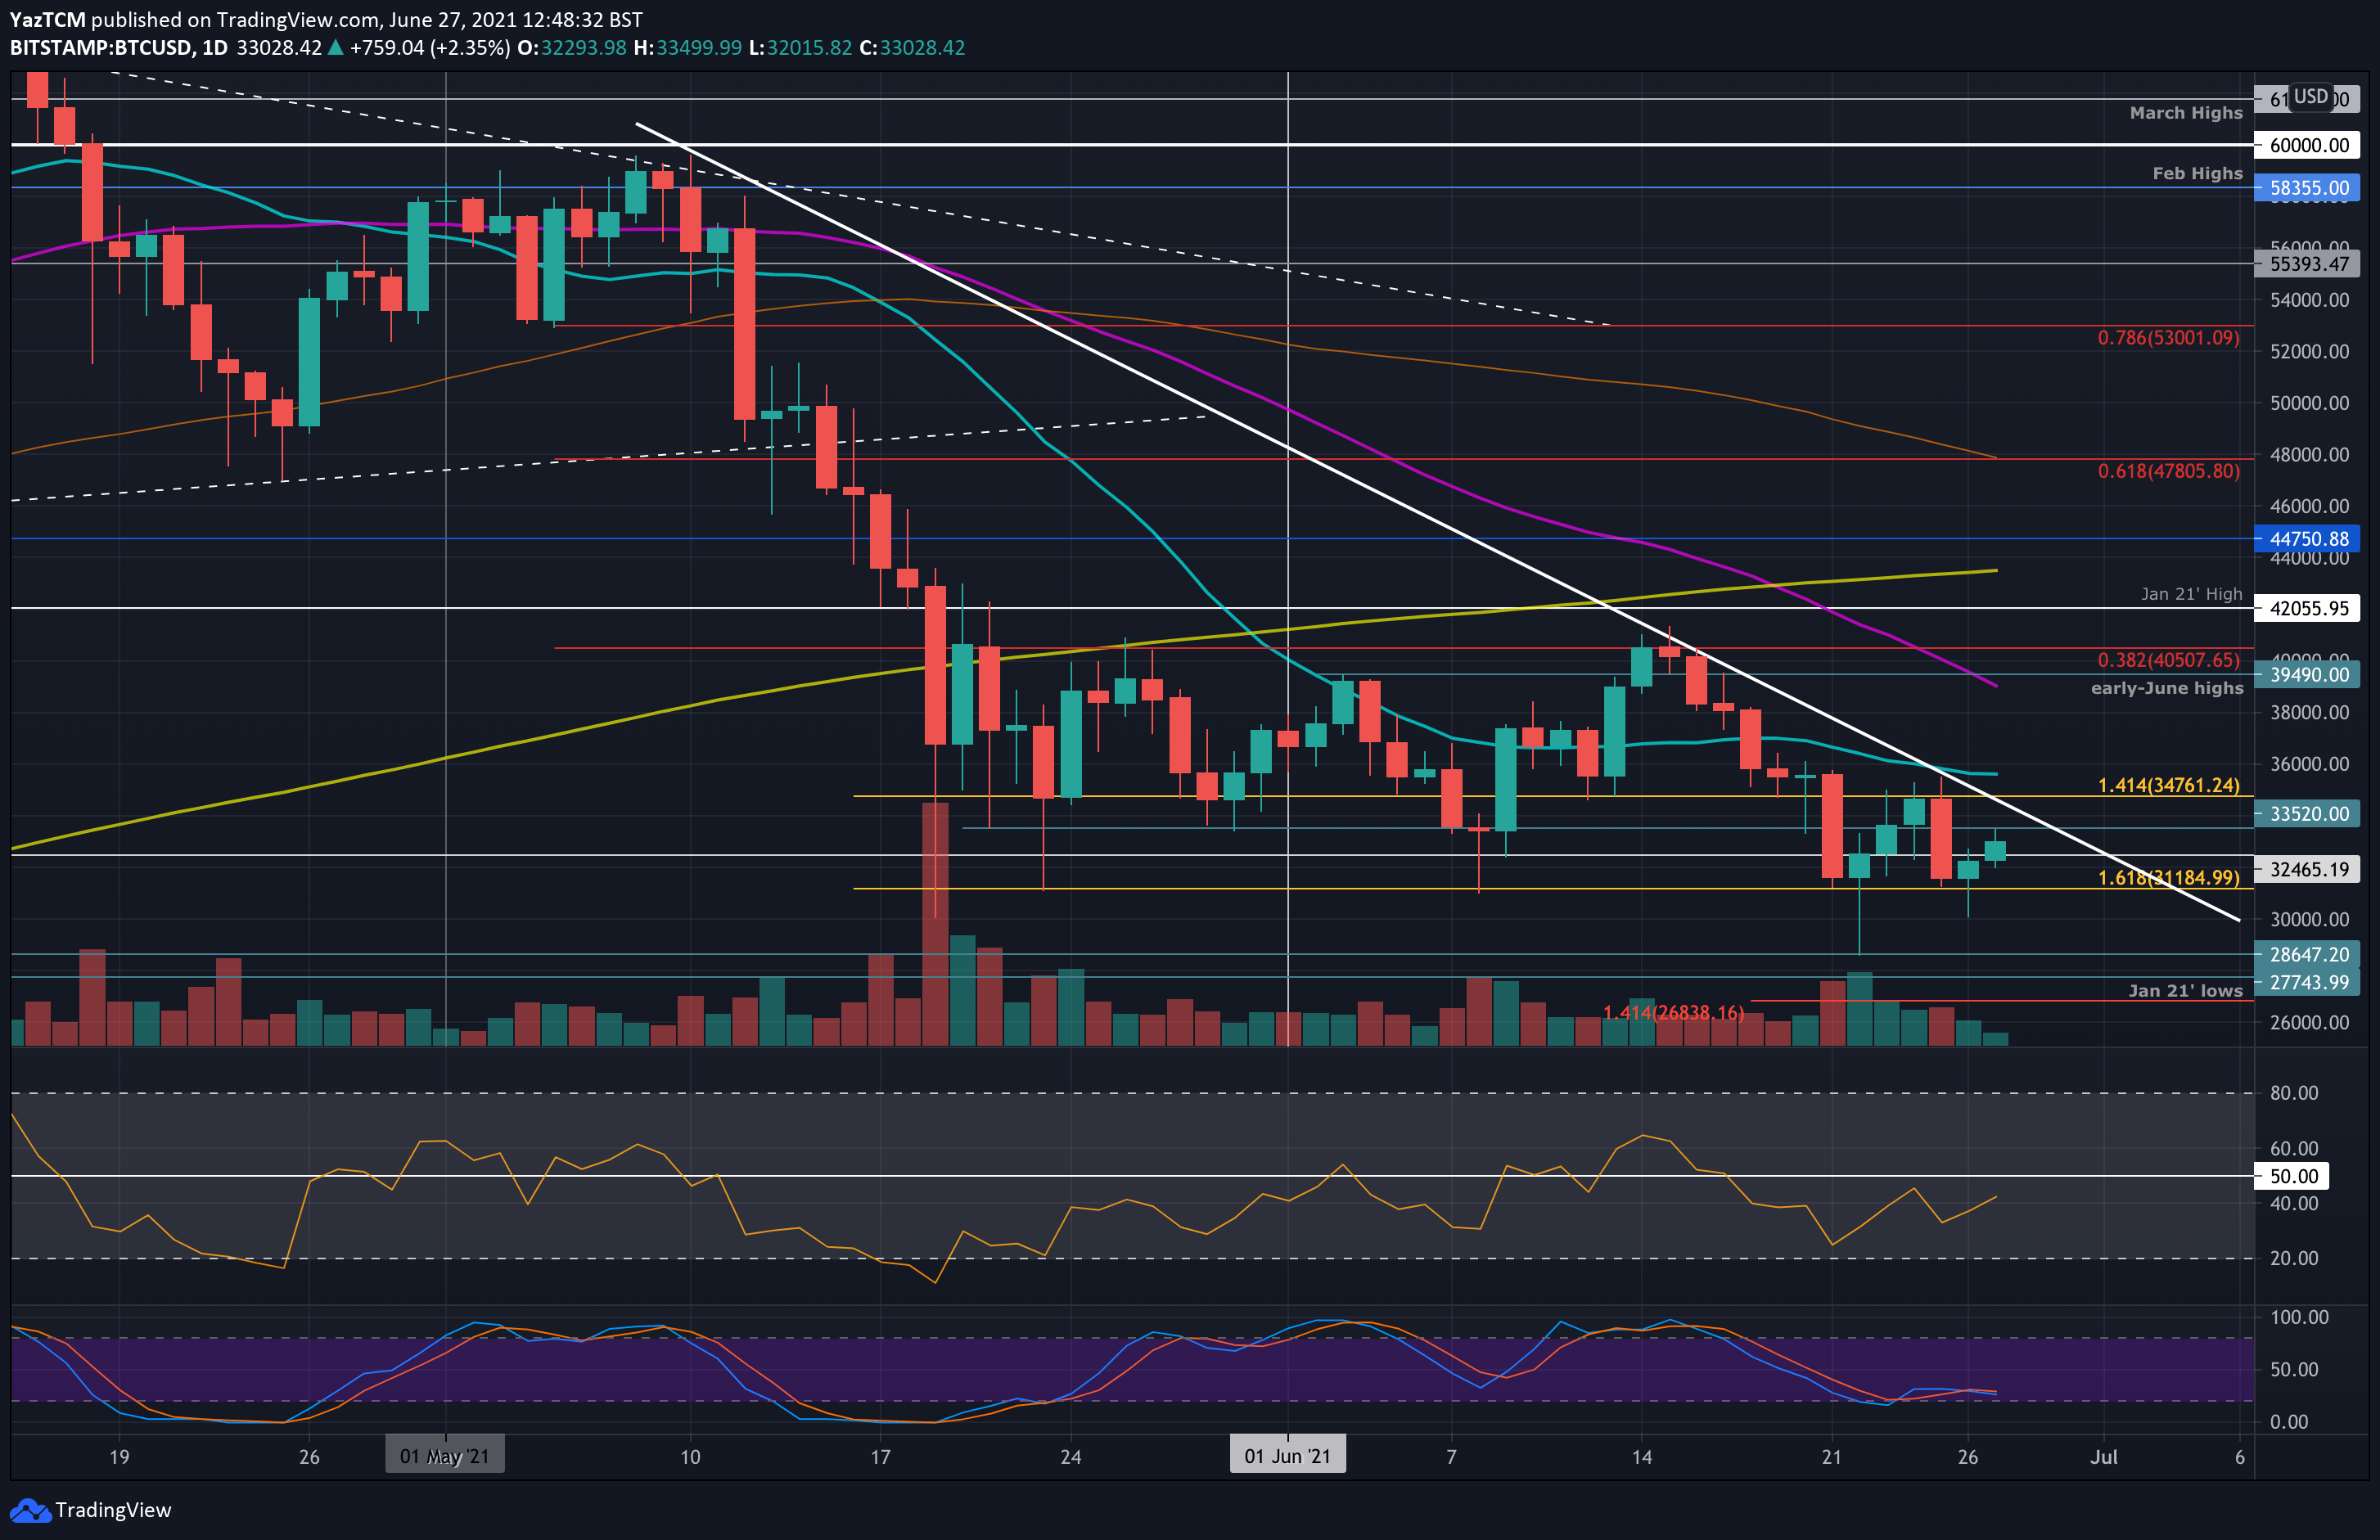
Additionally, BTC did not close (daily candle) beneath the $31,500 level on the daily chart. This is the same level it closed last week when BTC spiked as low as $28,600 on Tuesday. The closing candle at $31,500 has now put a potentially bullish signal in the form of a double bottom pattern that might be forming on the daily chart.
So far, the “demand wall” around $30-31K seems to be holding well, whereas any slide to that range gets quickly gets bought up. This could be a sign that we might be reaching the end of this short-term bearishness, as long as the $30k price level holds.
However, for the mid and long-term, BItcoin is still “stuck” inside a choppy trading range between $30K and $42K for approximately 1.5 months since the liquidation event, which took place on May-19, 2021.
BTC Price Support and Resistance Levels to Watch
Key Support Levels: $32,000, $31,500 – $31,200, $30,600, $30,000, $29,350.
Key Resistance Levels: $33,500 – $34,000, $34,800, $35,700, $38,000, $39K.
Looking ahead, the first resistance lies between $33,500 and $34,000 (mid-term descending trend line). This is followed by $34,800, $35,700 (20-day MA and weekly high reached on Friday), $38K, and $39,000 (50-day MA).
On the other side, the first support lies at $32,000 (today’s low). This is followed by $31,500 – $31,200 (June daily closing support & downside 1.618 Fib), $30,600 downside (1.272 Fib Extension), $30,000, and $29,350 (downside 1.414 Fib Extension).
The daily RSI remains within bearish territory but did create a new higher low, indicating that the bearish momentum is fading a bit.
Bitstamp BTC/USD Daily Chart
Bitstamp BTC/USD 4-Hour Chart