Bitcoin saw another sharp 17% price drop today, causing the cryptocurrency to spike as low as ,250 as of writing these lines. In total, the coin has now dropped by over 30% in a matter of days, and 40% below the current all-time high at around k. The first signal for the bitcoin downturn was the break beneath the rising trend line at the beginning of the past week when BTC fell beneath the ,000 psychological support. From there, the coin continued to drop to find support at ,770 (.618 Fib and January 2021 previous all-time high) over the past couple of days. The 17% price decline today caused BTC to break sharply beneath the K support, which held BTC for the past few days. As of writing these lines, the current low, which is also the lowest BTC price since
Topics:
Yaz Sheikh considers the following as important: Bitcoin (BTC) Price, BTC Analysis, BTCEUR, BTCGBP, btcusd, btcusdt
This could be interesting, too:
Chayanika Deka writes XRP, SOL, and ADA Inclusion in US Crypto Reserve Pushes Traders on Edge
Chayanika Deka writes Why Arthur Hayes Is Bullish on Bitcoin Under Trump’s Economic Strategy
Mandy Williams writes Why the Bitcoin Market Is Stuck—and the Key Metric That Could Change It: CryptoQuant CEO
Wayne Jones writes Metaplanet Acquires 156 BTC, Bringing Total Holdings to 2,391
Bitcoin saw another sharp 17% price drop today, causing the cryptocurrency to spike as low as $36,250 as of writing these lines. In total, the coin has now dropped by over 30% in a matter of days, and 40% below the current all-time high at around $65k.
The first signal for the bitcoin downturn was the break beneath the rising trend line at the beginning of the past week when BTC fell beneath the $50,000 psychological support. From there, the coin continued to drop to find support at $42,770 (.618 Fib and January 2021 previous all-time high) over the past couple of days.
The 17% price decline today caused BTC to break sharply beneath the $42K support, which held BTC for the past few days. As of writing these lines, the current low, which is also the lowest BTC price since February 4, 2021, lies at $36,250 according to Bitstamp.
On the short-term 4-hour charts, we can see that BTC is trading inside a steep falling price channel. The cryptocurrency reached the lower boundary of this price channel earlier today when it touched $36,250.
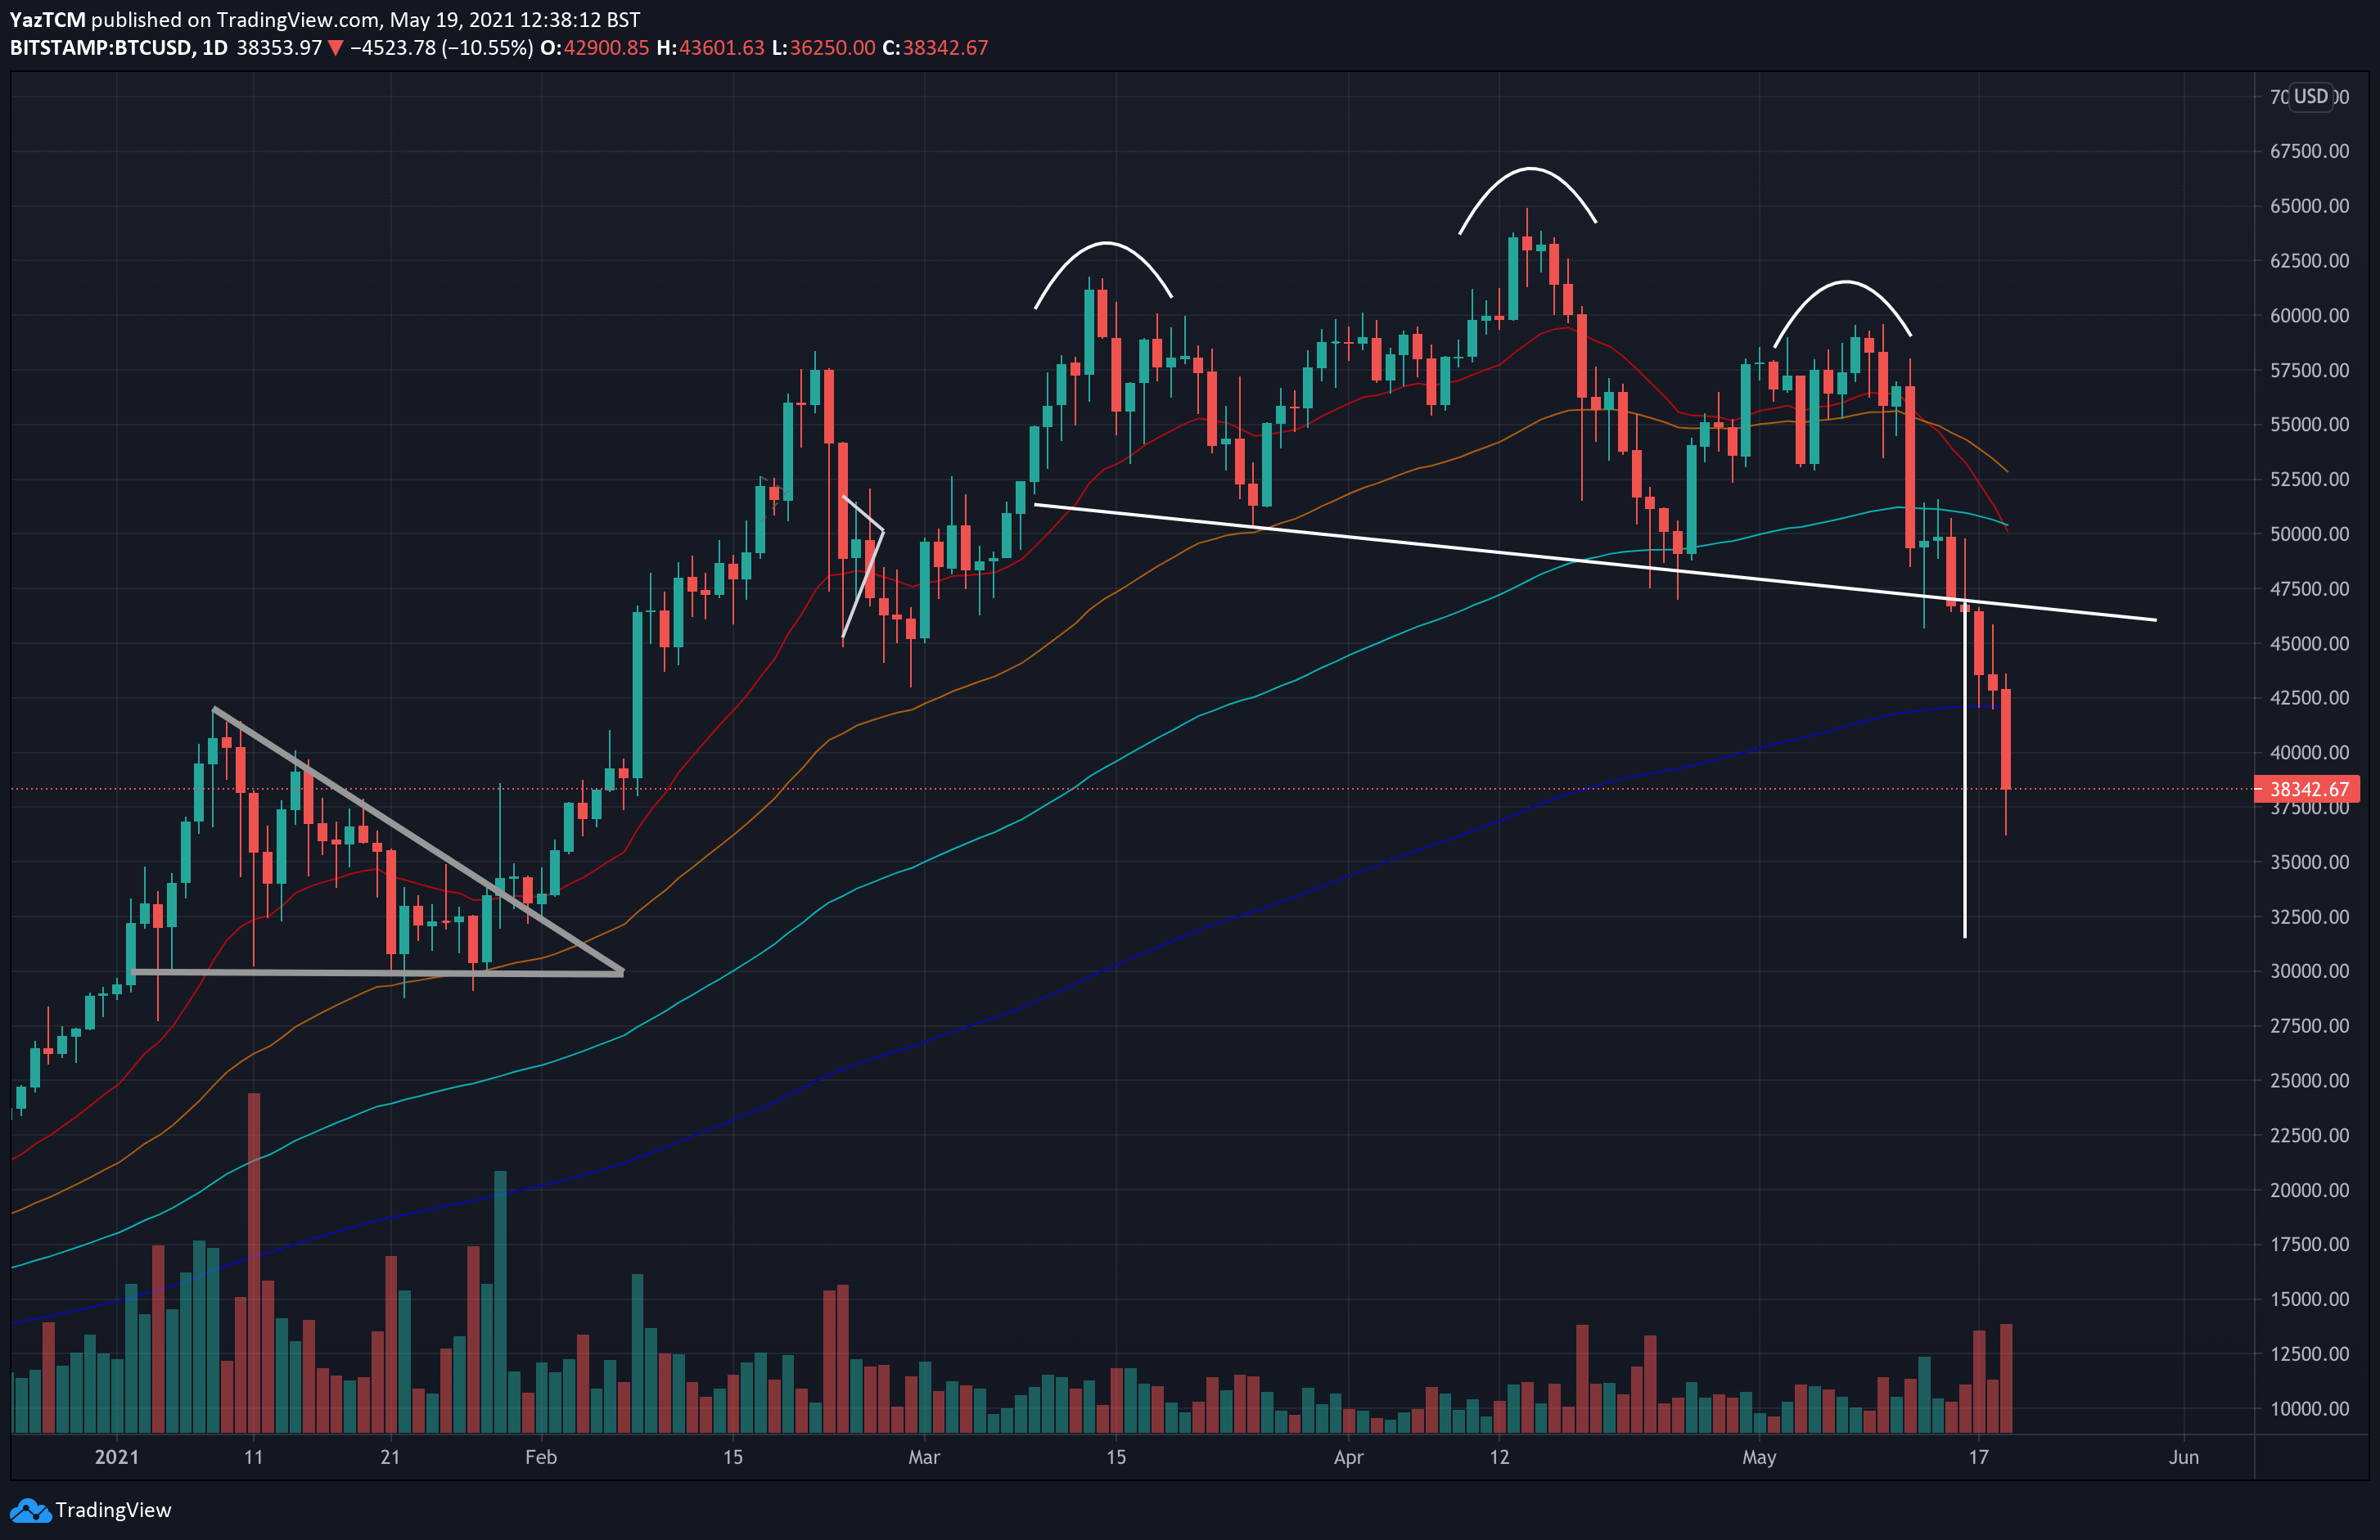
Another worrying signal came once bitcoin dropped below the $47-48K area and formed a huge bearish Head & Shoulders pattern on the daily chart as can be seen below. This pattern was mentioned here for the past two weeks. Once broken down, the target lies around the $32k level (measured from the top of the head to the neckline).
For the next hours, bulls eyes a daily close above the significant 200-days moving average (MA) line, which currently lies around the $39,700 level.
BTC Price Support and Resistance Levels to Watch
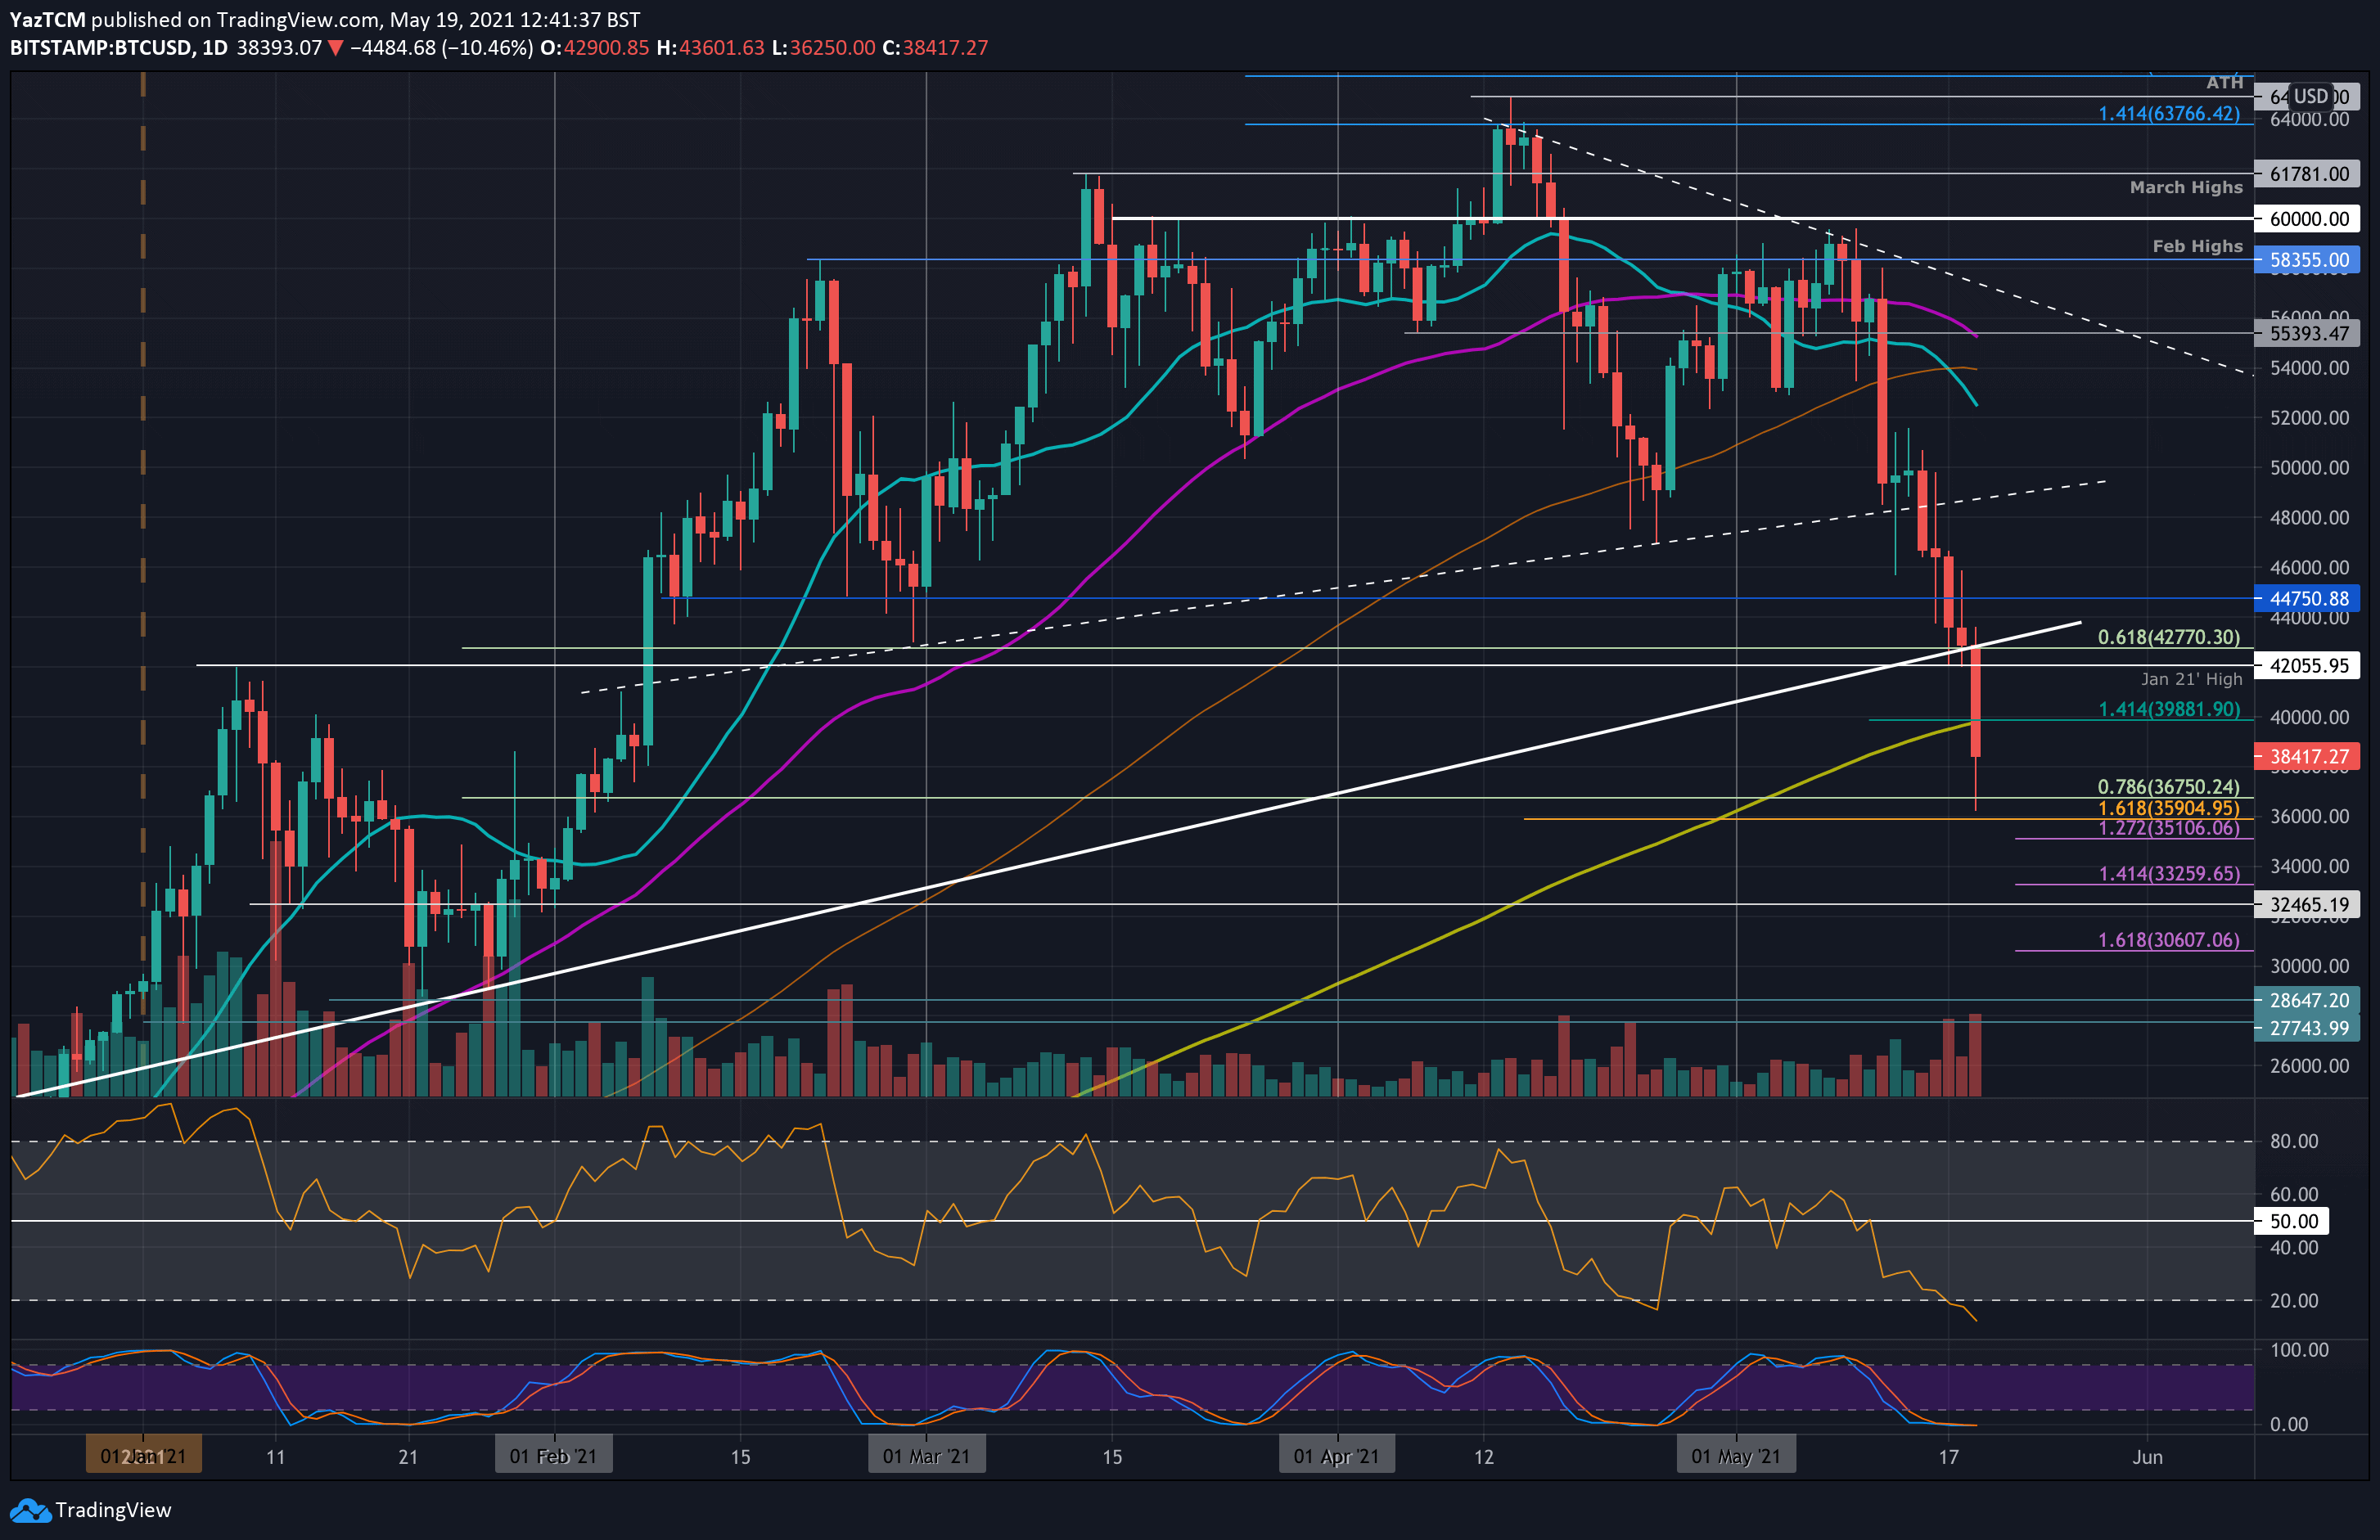
Key Support Levels: $38K, $36,750 / $36,250, $35,900, $35,100, $33,260, $32,465.
Key Resistance Levels: $39,700 – $40,000, $42,000, $44,750, $46,000, $47,890.
Looking ahead, the first support lies at the current level of $38K, followed by $36,750 (.786 Fib), along with today’s low at $36,250 (lower boundary of the the price channel). This is followed by $35,900 (downside 1.618 Fib Extension – orange), $35,100 (short term downside 1.272 Fib Extension), $33,260 (short term downside 1.414 Fib Extension), and $32,465 (Feb lows).
On the other side, the first resistance lies at $39,700 – $40K (200-day MA). This is followed by $42,000 (Jan 21 highs), $44,750, $46,000, and $47,890 (bearish .5 Fib).
Once again, the RSI is now the most oversold since March 2020, the beginning of the financial crisis caused by the COVID19 pandemic. It is oversold to a level where it should not continue for too much longer, hence a correction is expected. Nevertheless, if the selling continues, the RSI has every right to remain extremely oversold for an extended period of time.
Bitstamp BTC/USD Daily Chart
Bitstamp BTC/USD 4-Hour Chart
