Bitcoin continues to recover from the tumble it suffered during the weekend. As of now, the BTC price is up by 3% today, following the 14% devastating crash seen on Sunday. Yesterday, Bitcoin slipped from the k price area as it dropped to reach as low as ,440. There, it found support at the .618 Fib Retracement level and managed to rebound, trading between k – k during most of the day. By the end of the day, Bitcoin managed to recover to ,280, where it found support at a 50-days MA level. This was further bolstered by an ascending trend line that dates back to the beginning of March. Today, Bitcoin has battled to remain above the 50-days MA but looks to be struggling to hold the support, even at the time of this writing. BTC Price Support and Resistance
Topics:
Yaz Sheikh considers the following as important: Bitcoin (BTC) Price, BTC Analysis, BTCEUR, BTCGBP, btcusd, btcusdt
This could be interesting, too:
Chayanika Deka writes XRP, SOL, and ADA Inclusion in US Crypto Reserve Pushes Traders on Edge
Chayanika Deka writes Why Arthur Hayes Is Bullish on Bitcoin Under Trump’s Economic Strategy
Mandy Williams writes Why the Bitcoin Market Is Stuck—and the Key Metric That Could Change It: CryptoQuant CEO
Wayne Jones writes Metaplanet Acquires 156 BTC, Bringing Total Holdings to 2,391
Bitcoin continues to recover from the tumble it suffered during the weekend. As of now, the BTC price is up by 3% today, following the 14% devastating crash seen on Sunday.
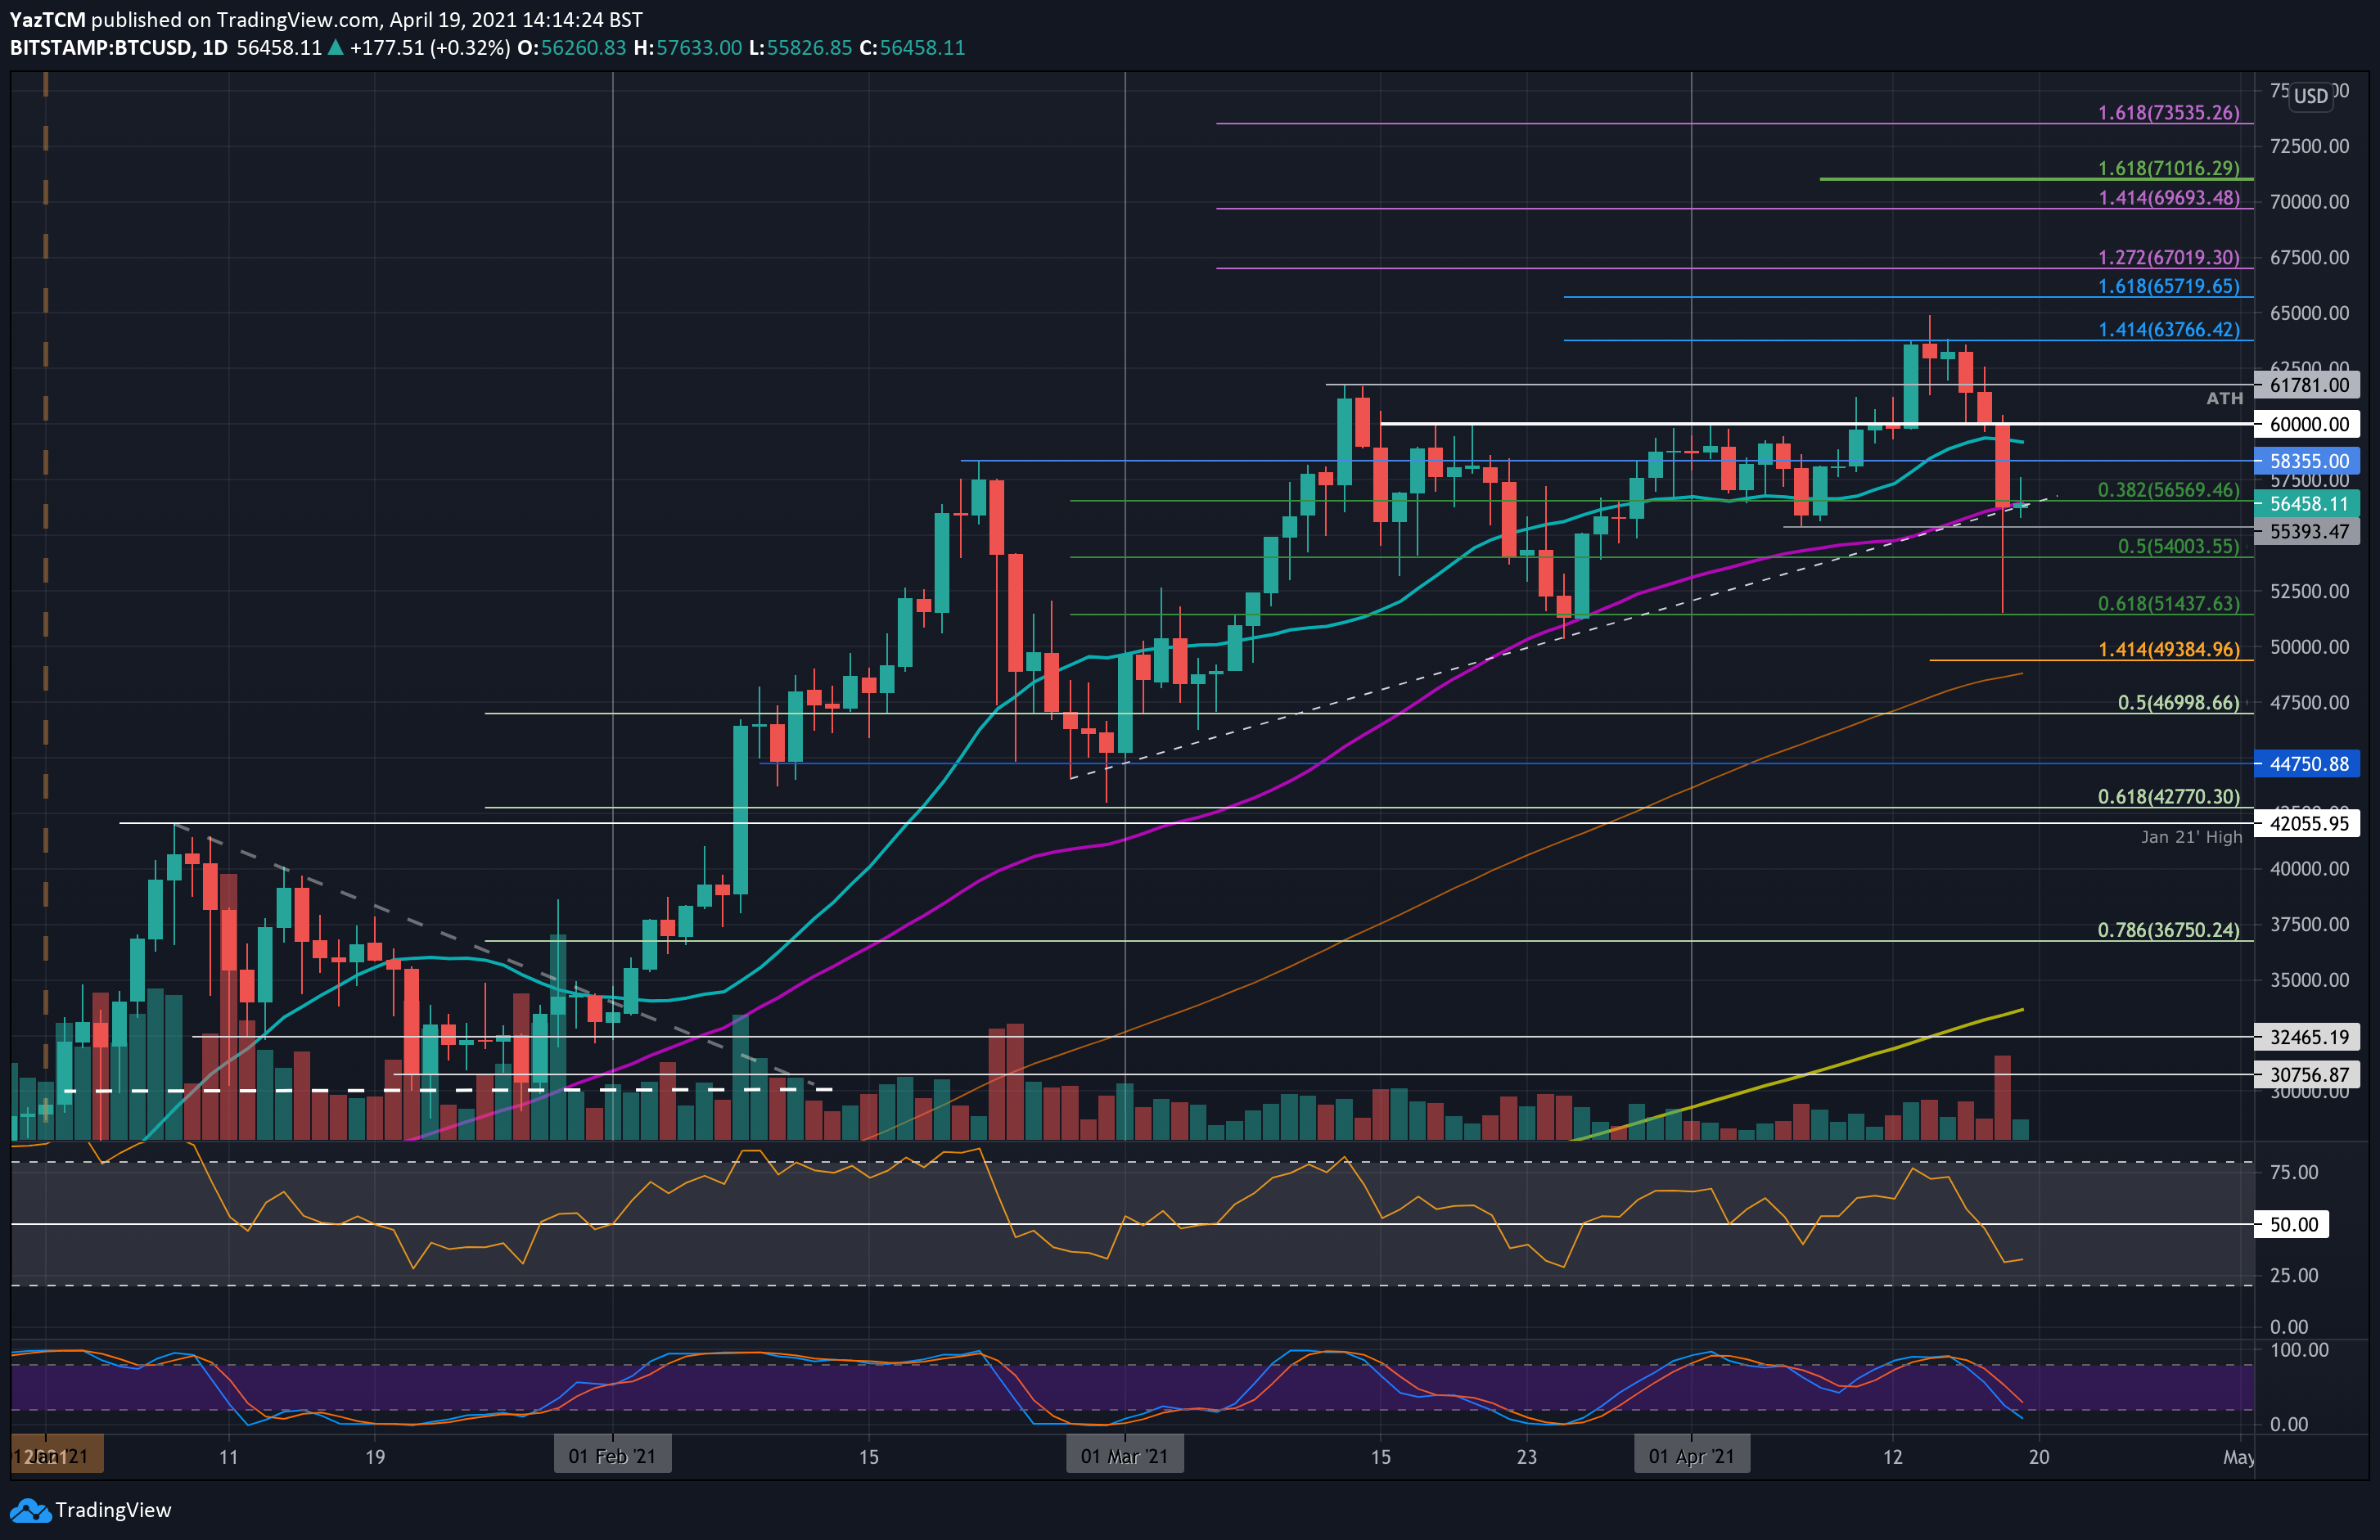
Yesterday, Bitcoin slipped from the $60k price area as it dropped to reach as low as $51,440. There, it found support at the .618 Fib Retracement level and managed to rebound, trading between $54k – $55k during most of the day.
By the end of the day, Bitcoin managed to recover to $56,280, where it found support at a 50-days MA level. This was further bolstered by an ascending trend line that dates back to the beginning of March.
Today, Bitcoin has battled to remain above the 50-days MA but looks to be struggling to hold the support, even at the time of this writing.
BTC Price Support and Resistance Levels to Watch
Key Support Levels: $55,400, $54,000, $51,440, $50,000, $49,385.
Key Resistance Levels: $56,280, $58,355, $59,200, $60,000.
Looking ahead, if the sellers push beneath the 50-days MA the first support lies at $55,400 (early April support). This is followed by $54,000 (.5 Fib), $51,440 (.618 Fib), and $50,000. Beneath $50,000, added support lies at $49,385 (downside 1.414 Fib Extension), and $47,000 (long term .5 Fib).
On the other side, the first resistance lies at the 50-days MA at $56,280. This is followed by $58,3555 (Feb Highs), $59,200 – the 20-day moving average line, and $60,000.
The daily RSI is now beneath the midline and is at its lowest value in April, indicating that the bears are in complete control of the short-term momentum.
Bitstamp BTC/USD Daily Chart
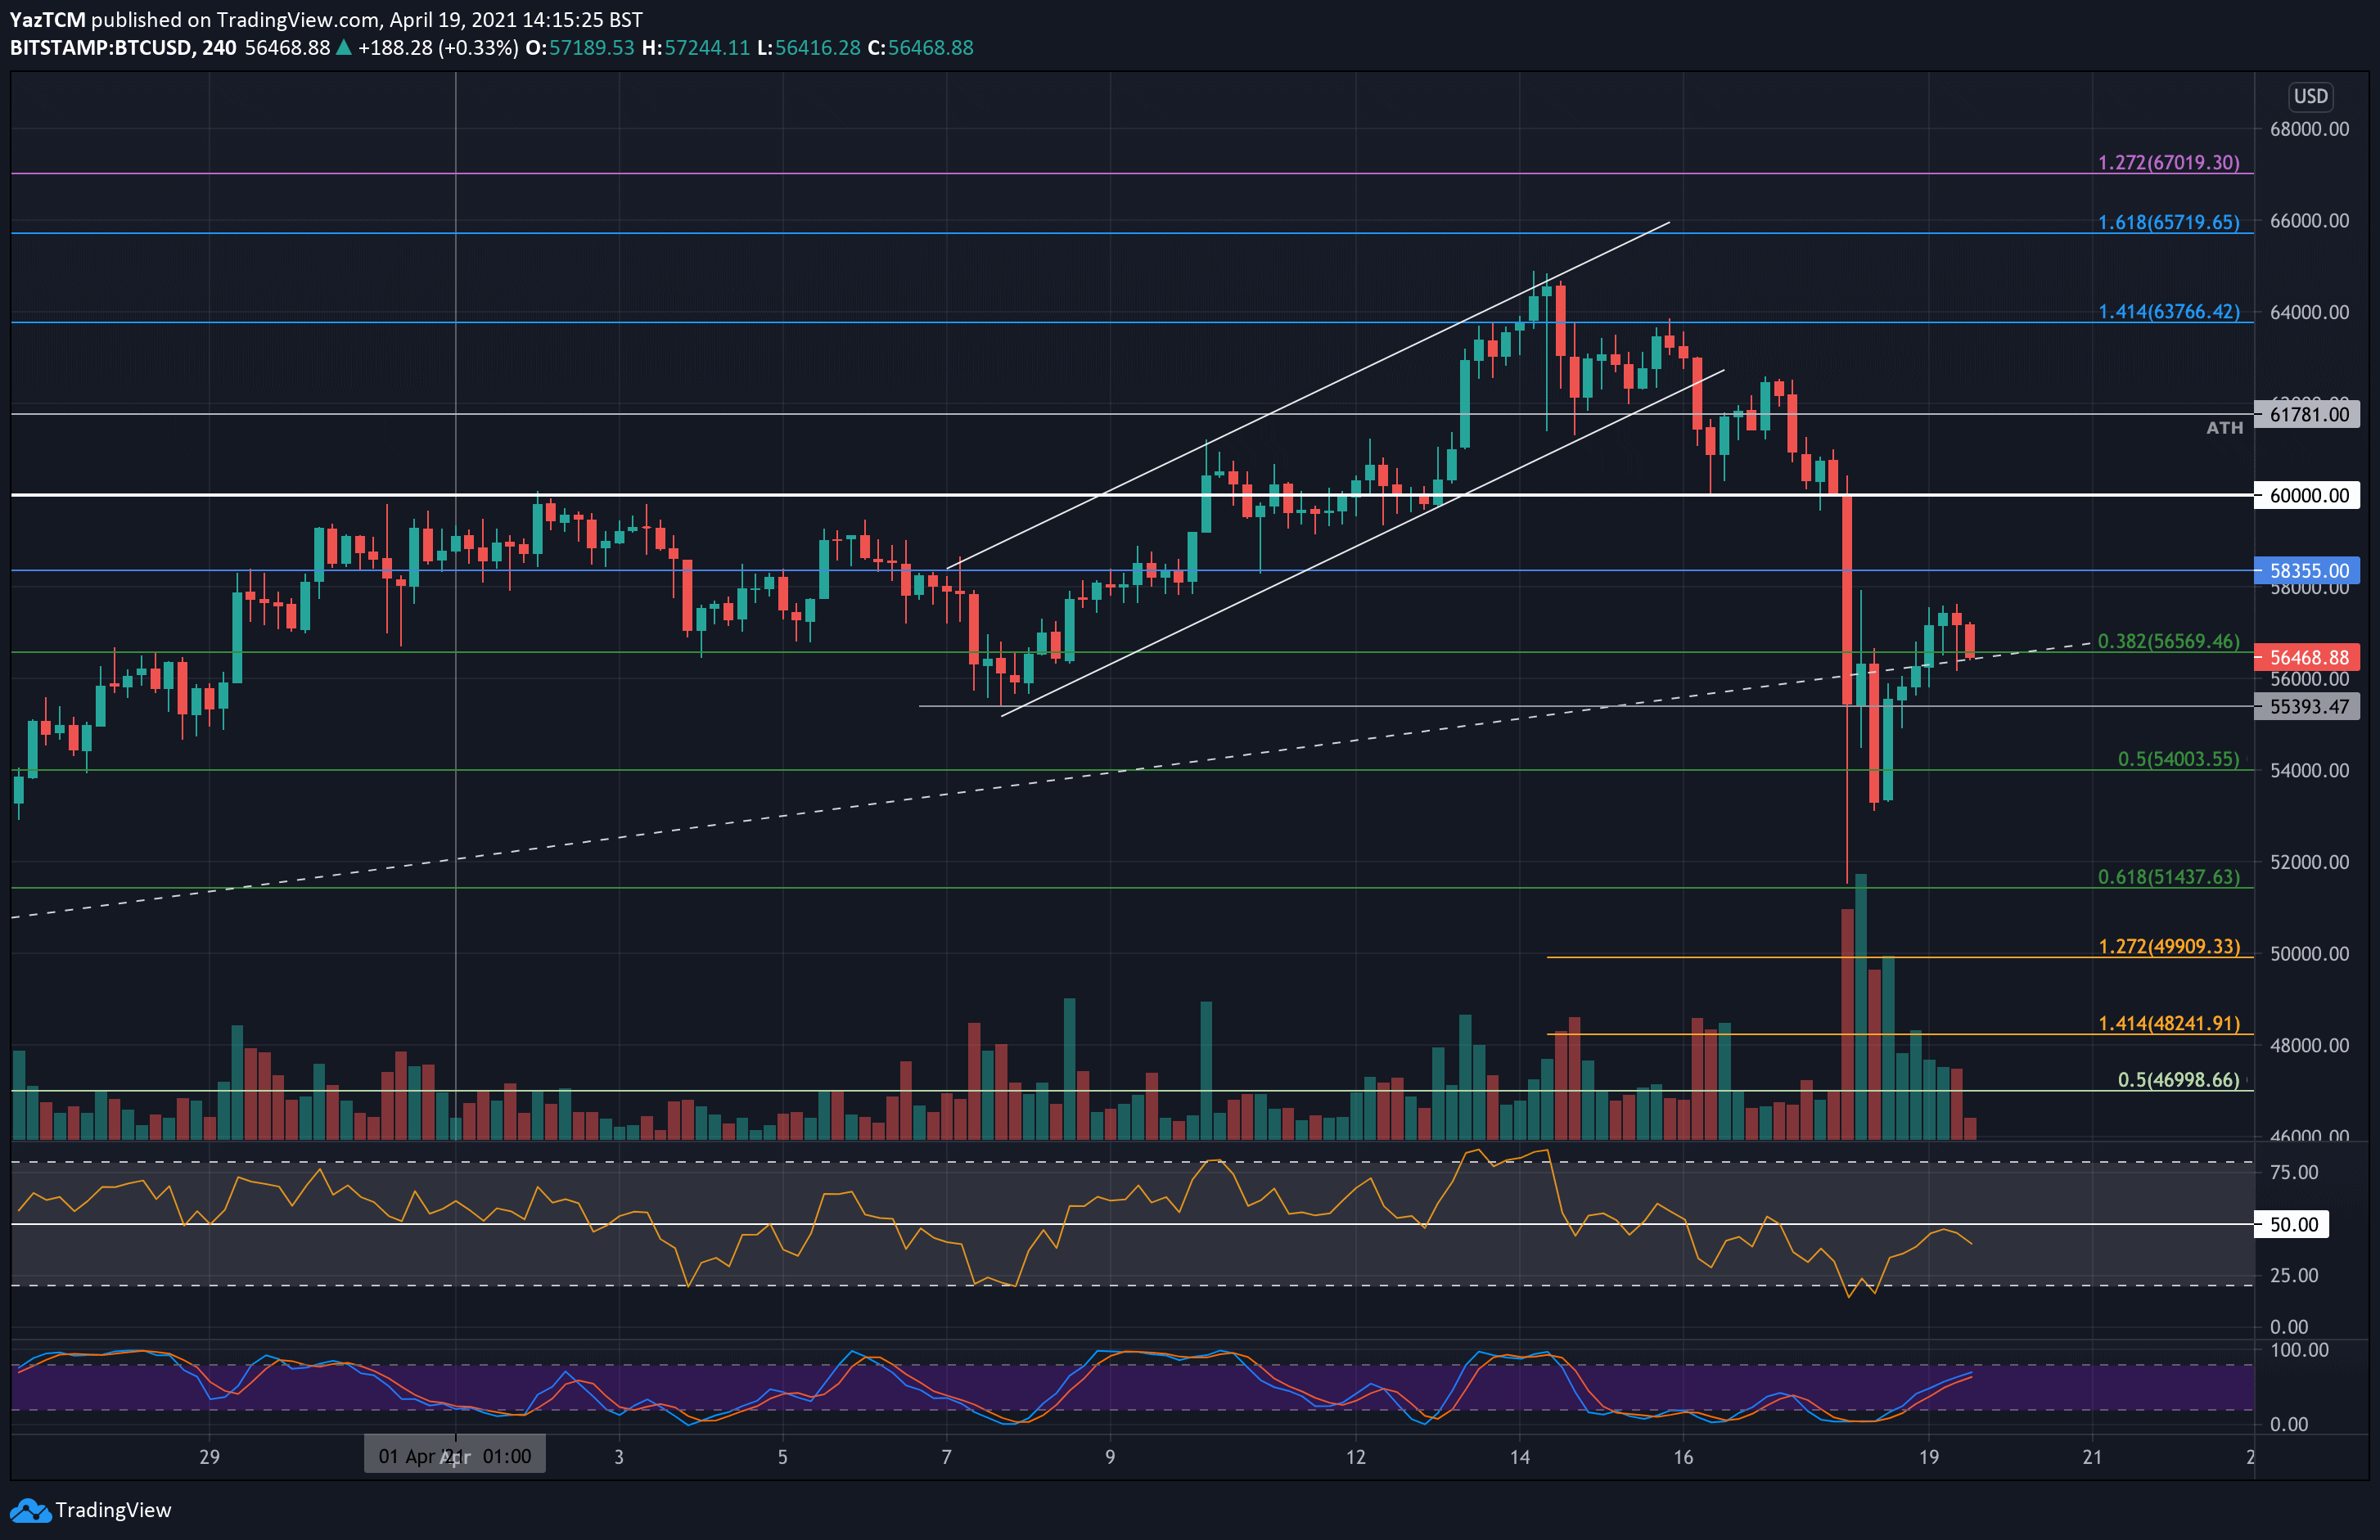
Bitstamp BTC/USD 4-Hour Chart