Bitcoin’s rollercoaster continues today after the primary cryptocurrency fell by ,240, around 12%, from yesterday’s highs of ,080. BTC had dipped further this morning but managed to rebound from the support at ,750 (4-hr 50 MA) and is now trading around ,000.Yesterday, the coin was looking promising as it attempted to break above a short-term symmetrical triangle pattern. Unfortunately, this proved to be a false breakout, and Bitcoin stalled and reversed at ,000.Looking at the larger picture, yesterday’s closing candle at ,200 (.382 Fib) confirmed that Bitcoin had penetrated beneath the previous ascending price channel. It was toying with the lower boundary over the previous three days as the bulls attempted to defend the level.Nevertheless, Bitcoin is now trading beneath
Topics:
Yaz Sheikh considers the following as important: BTC Analysis, BTCEUR, BTCGBP, btcusd, btcusdt
This could be interesting, too:
Chayanika Deka writes Why Arthur Hayes Is Bullish on Bitcoin Under Trump’s Economic Strategy
Mandy Williams writes Why the Bitcoin Market Is Stuck—and the Key Metric That Could Change It: CryptoQuant CEO
Wayne Jones writes Metaplanet Acquires 156 BTC, Bringing Total Holdings to 2,391
Jordan Lyanchev writes Liquidations Top 0M as Bitcoin Falls K, Reversing Trump-Driven Rally
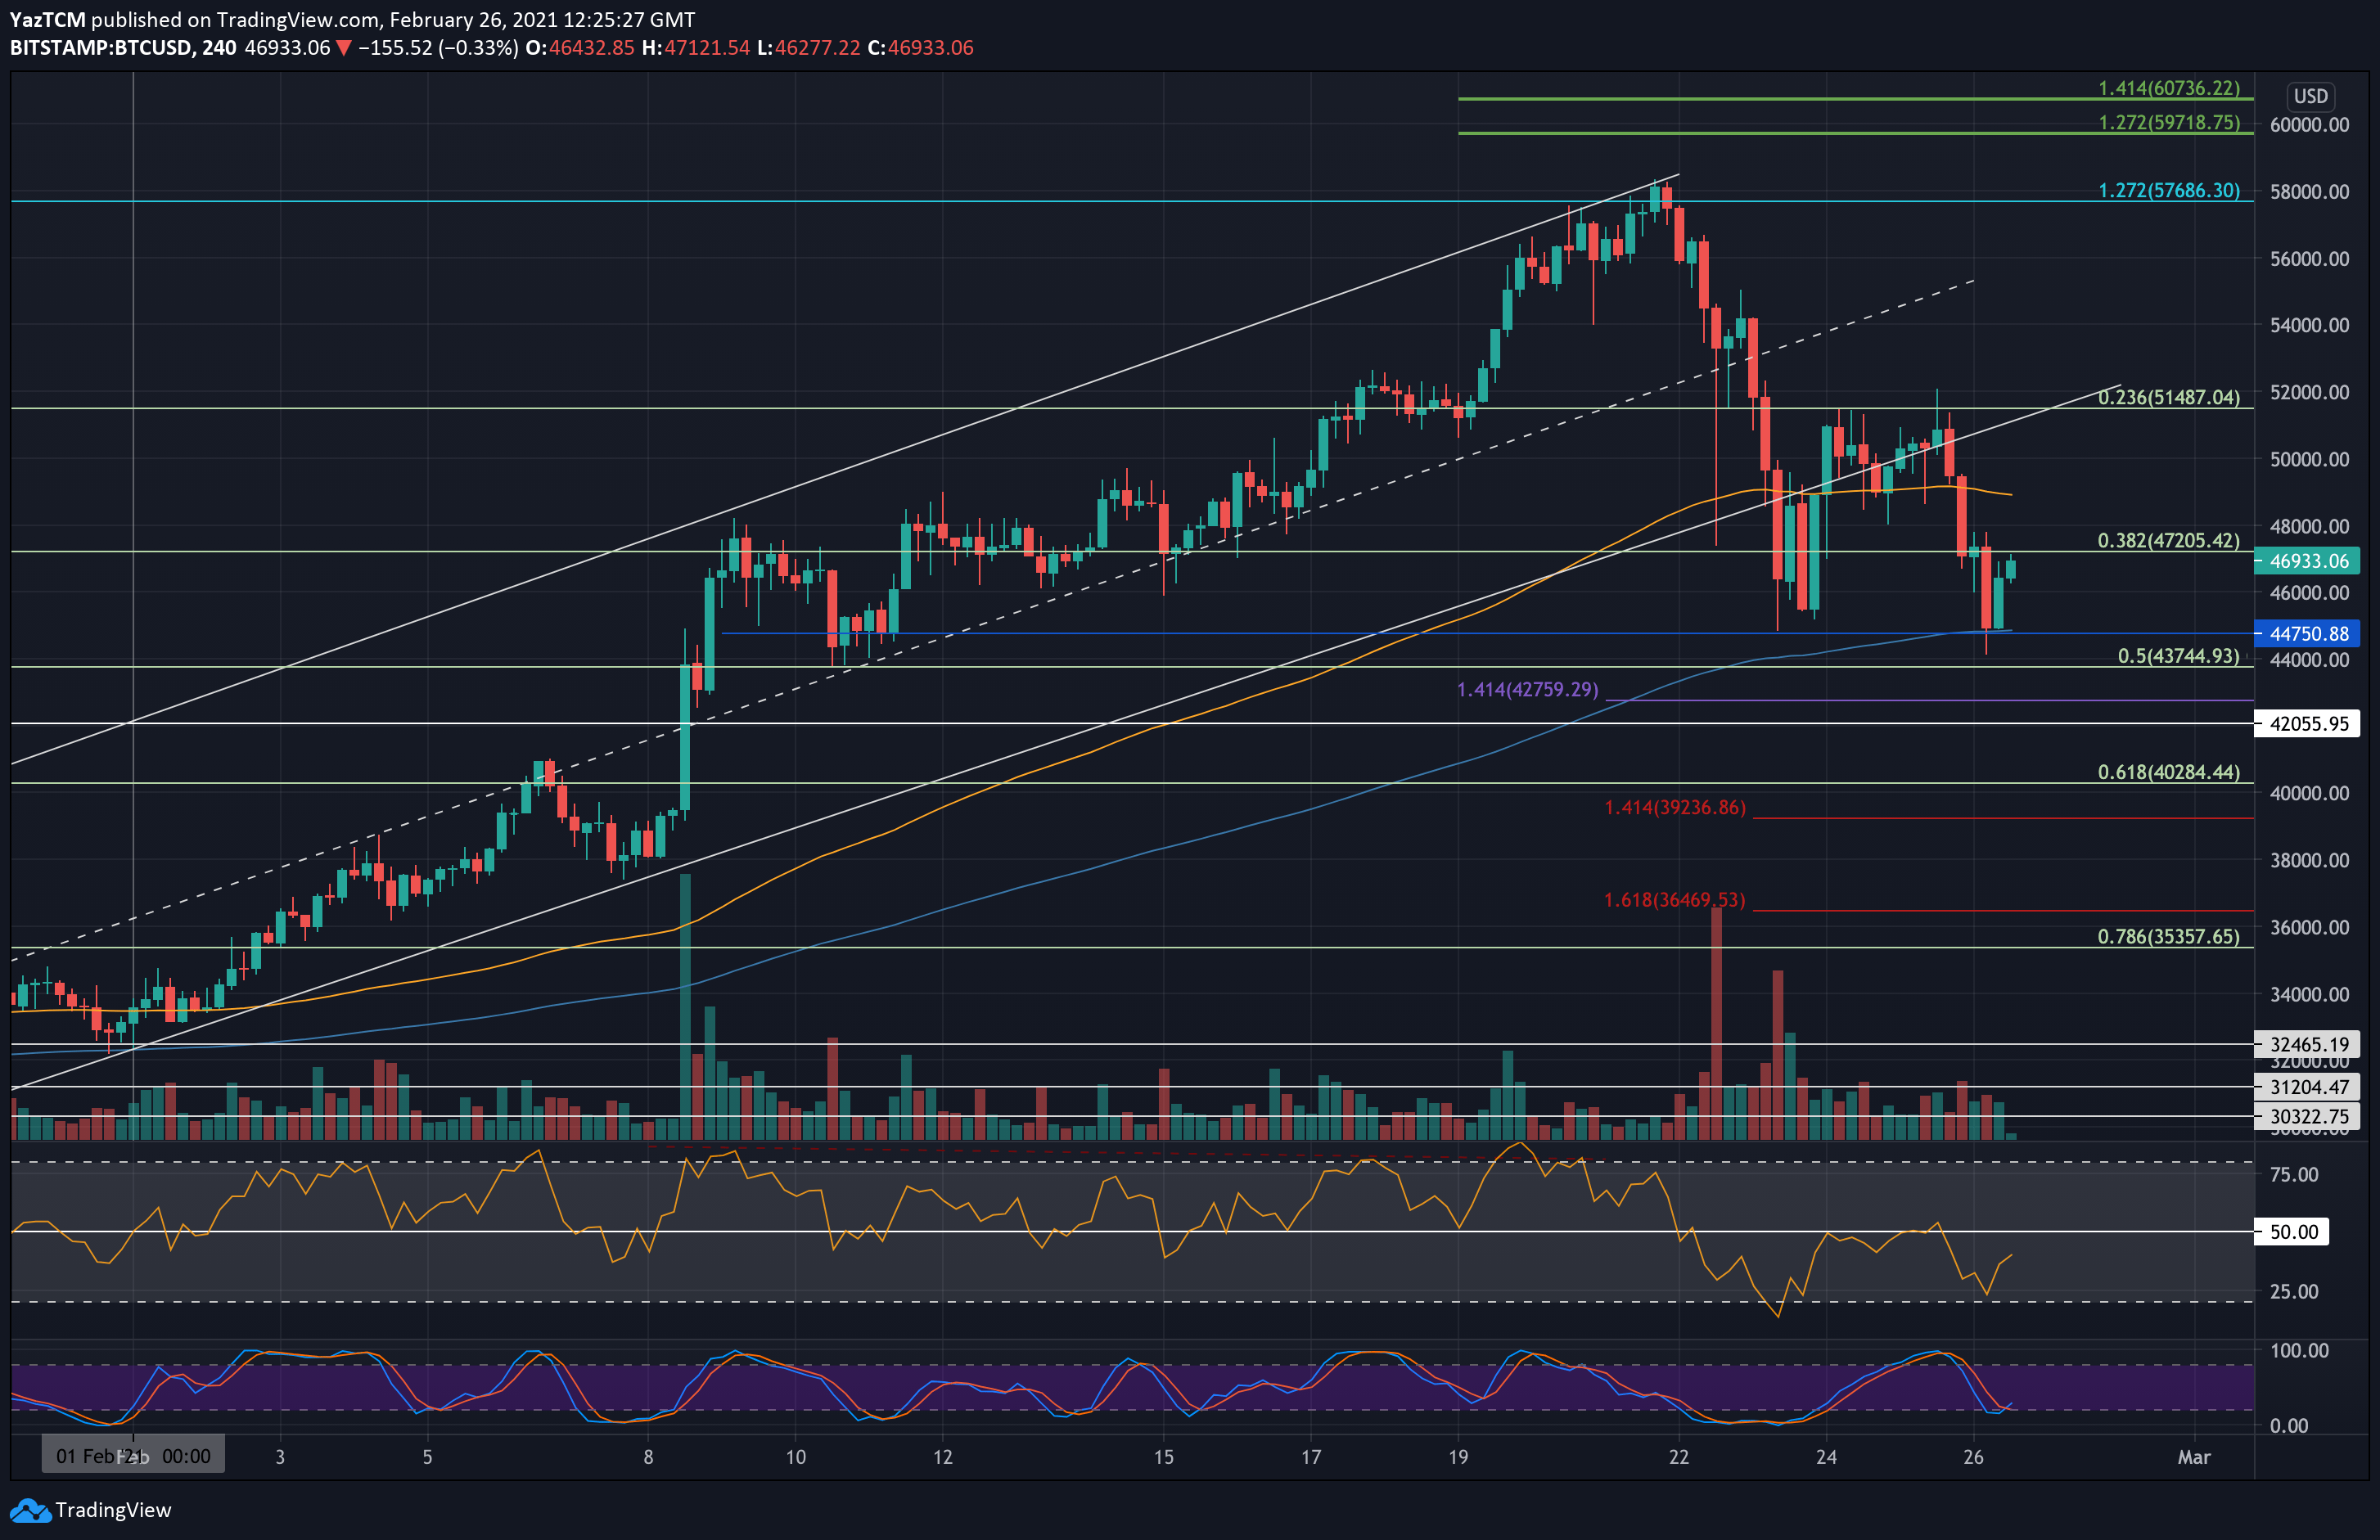
Bitcoin’s rollercoaster continues today after the primary cryptocurrency fell by $6,240, around 12%, from yesterday’s highs of $52,080. BTC had dipped further this morning but managed to rebound from the support at $44,750 (4-hr 50 MA) and is now trading around $47,000.
Yesterday, the coin was looking promising as it attempted to break above a short-term symmetrical triangle pattern. Unfortunately, this proved to be a false breakout, and Bitcoin stalled and reversed at $52,000.
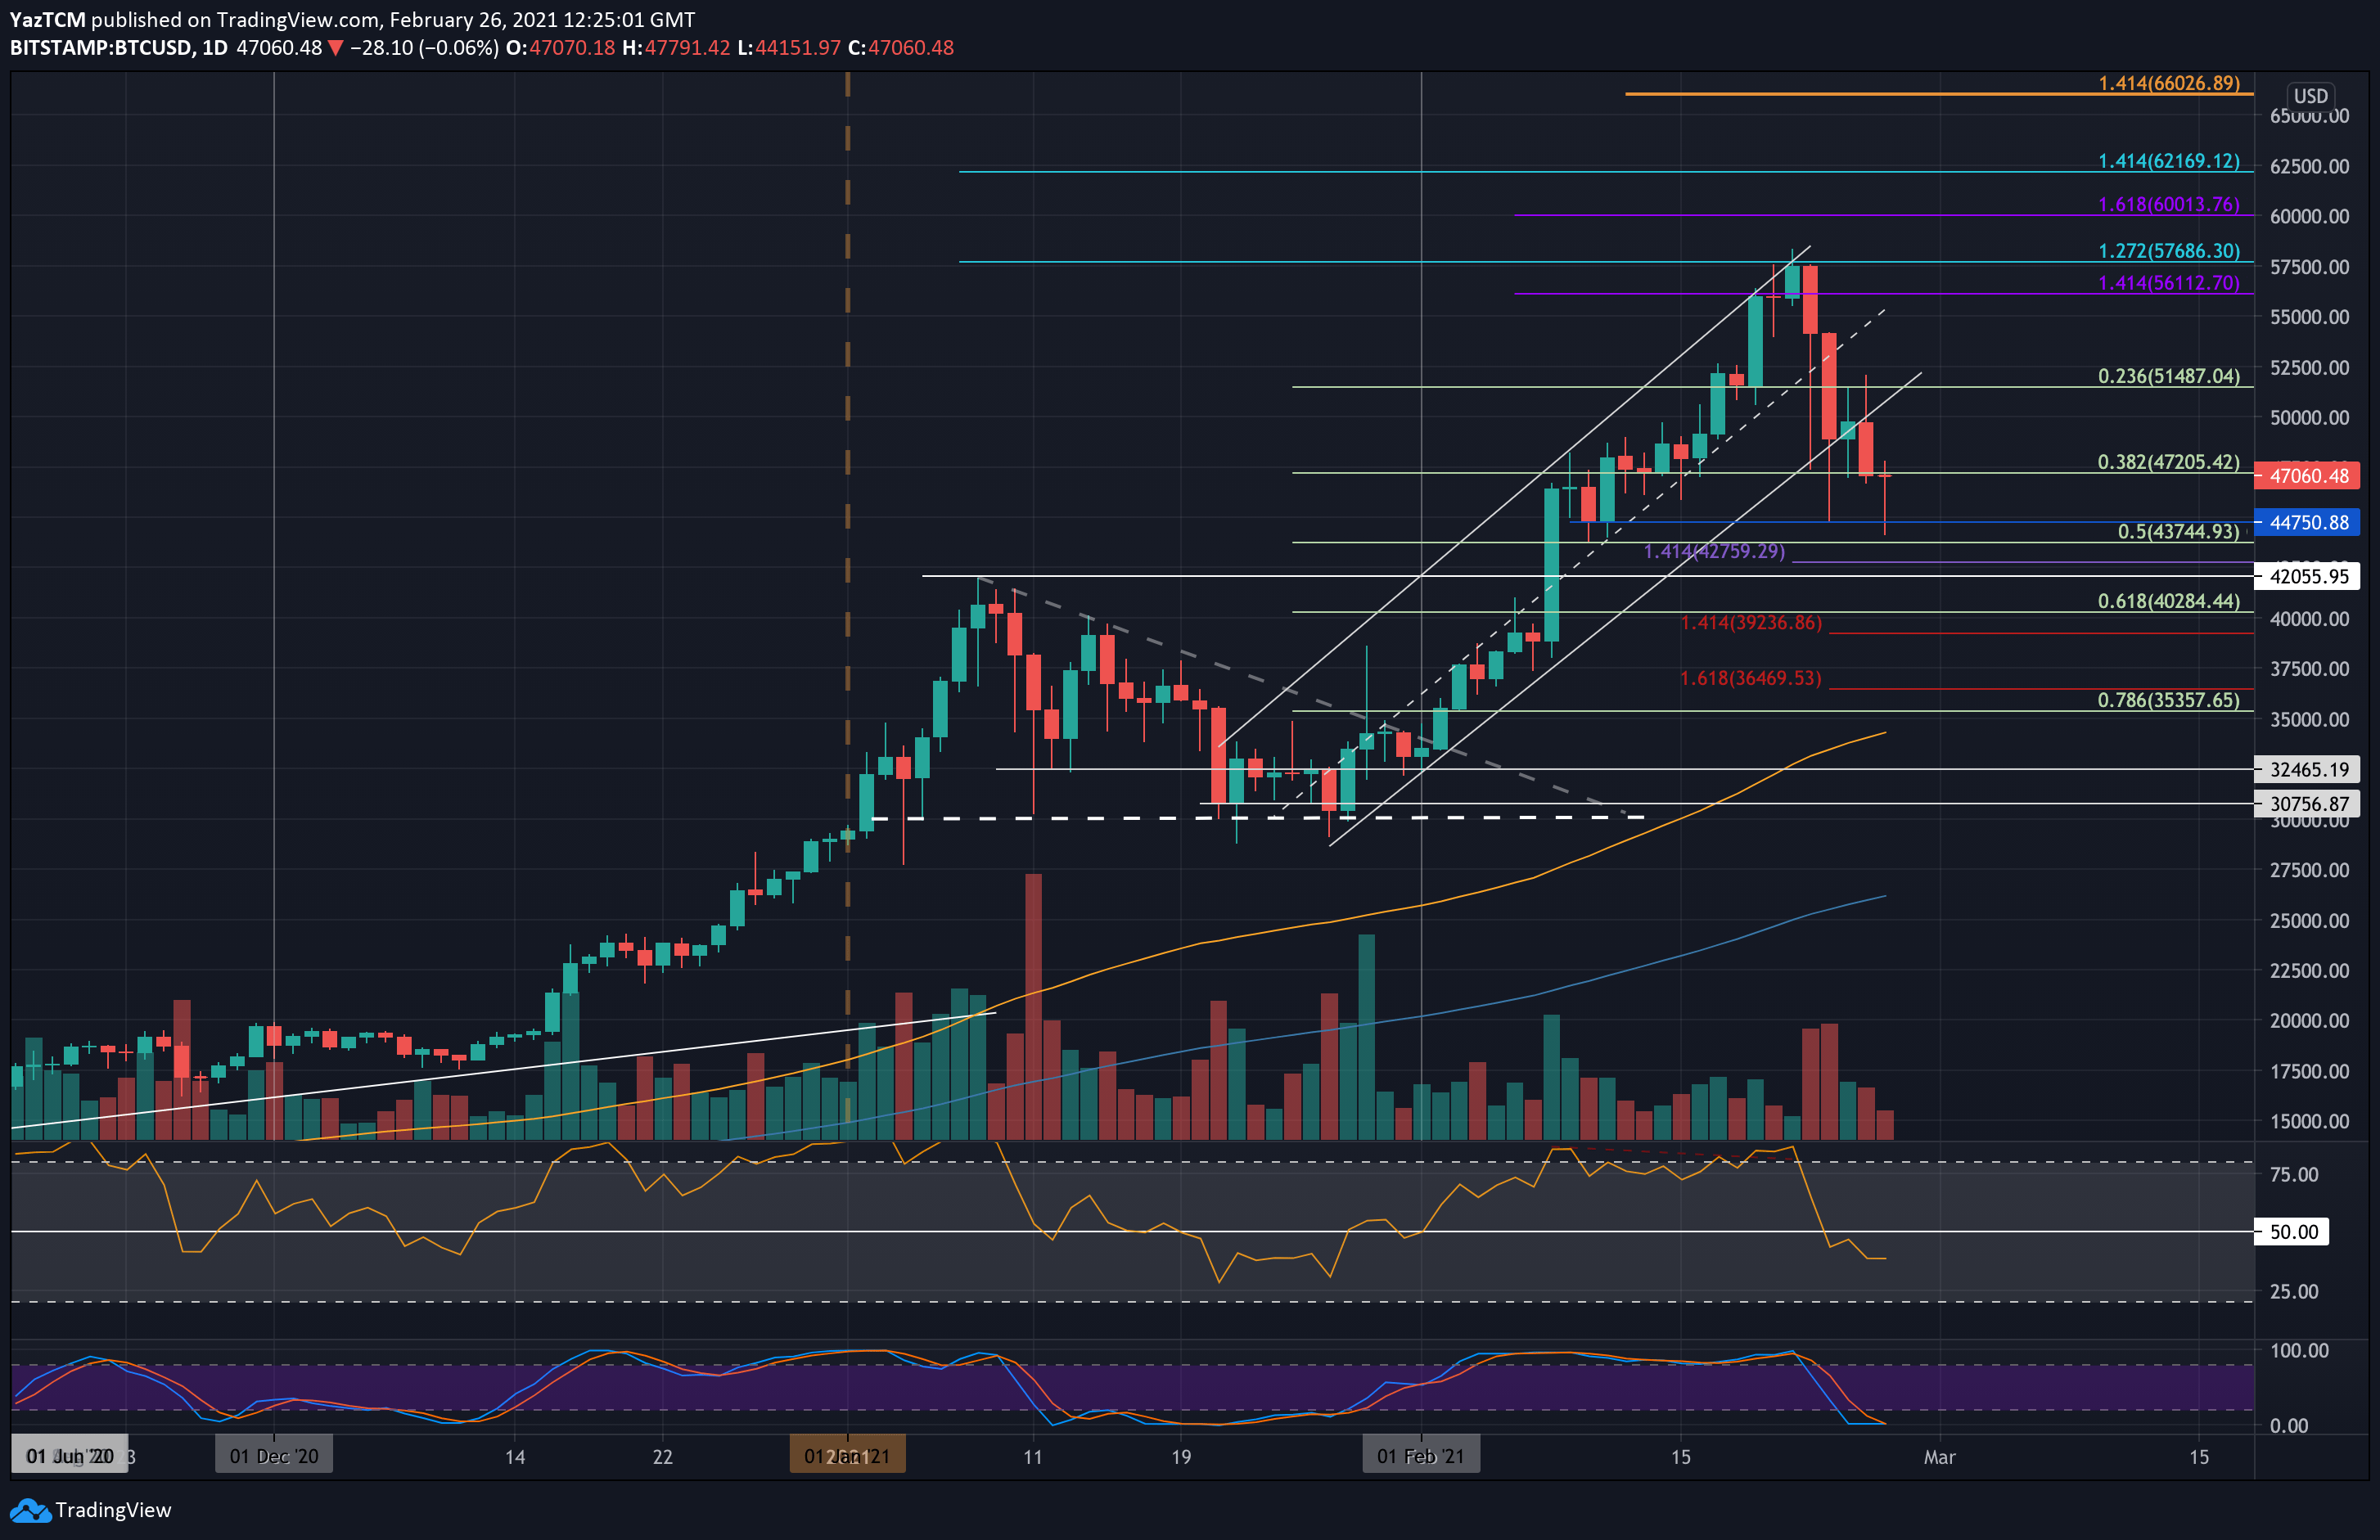
Looking at the larger picture, yesterday’s closing candle at $47,200 (.382 Fib) confirmed that Bitcoin had penetrated beneath the previous ascending price channel. It was toying with the lower boundary over the previous three days as the bulls attempted to defend the level.
Nevertheless, Bitcoin is now trading beneath the price channel as a much-needed retracement is underway. Interestingly, the price drops this week also coincided with a rough week in the legacy markets, with NASDAQ seeing its biggest slump since October last year.
BTC Price Support and Resistance Levels to Watch
Key Support Levels: $44,750, $43,745, $42,760, $42,000, $40,300.
Key Resistance Levels: $47,200, $48,000, $50,000, $51,500, $52,000.
Moving forward, the first level of strong support lies at $44,750 (4-Hour 50MA). This is followed by $43,745 (.5 Fib), $42,760 (downside 1.414 Fib Extension), and $42,000 (January ATH). Beneath this, additional support lies at $40,300 (50-MA & .618 Fib) and $39,235 (downside 1.414 Fib Extension).
On the other side, the first resistance lies at $47,200. This is followed by $48,000, $50,000, $51,500, and $52,000.
The RSI is now comfortably beneath the midline and is heading lower. This suggests that the bears are in charge of the market momentum, and their control is increasing. The Stochastic RSI is extremely oversold, and a bullish crossover signal here will be the first signal for the end of this retracement.
Bitstamp BTC/USD Daily Chart
Bitstamp BTC/USD 4-Hour Chart