Bitcoin dropped by a sharp 3% today as the cryptocurrency falls to the current ,000 level. It attempted to break above ,000 over the weekend but it failed to close a daily candle above ,355. As a result, BTC slipped from ,300 yesterday and fell beneath the March ascending trend line to reach as low as ,700. It rebounded by the end of the day to close the candle at ,000.Earlier today, Bitcoin spiked further lower to reach as low as ,930. Luckily, it found solid short-term support at ,000, best seen on the 4-Hour charts, and bounced higher from there to climb back above ,000.This recent breakdown for BTC might set a short-term bearish trajectory for the coin as it starts to make fresh 2-weeks low.BTC Price Support and Resistance Levels to WatchKey Support Levels:
Topics:
Yaz Sheikh considers the following as important: Bitcoin (BTC) Price, BTC Analysis, BTCEUR, BTCGBP, btcusd, btcusdt
This could be interesting, too:
Chayanika Deka writes XRP, SOL, and ADA Inclusion in US Crypto Reserve Pushes Traders on Edge
Chayanika Deka writes Why Arthur Hayes Is Bullish on Bitcoin Under Trump’s Economic Strategy
Mandy Williams writes Why the Bitcoin Market Is Stuck—and the Key Metric That Could Change It: CryptoQuant CEO
Wayne Jones writes Metaplanet Acquires 156 BTC, Bringing Total Holdings to 2,391
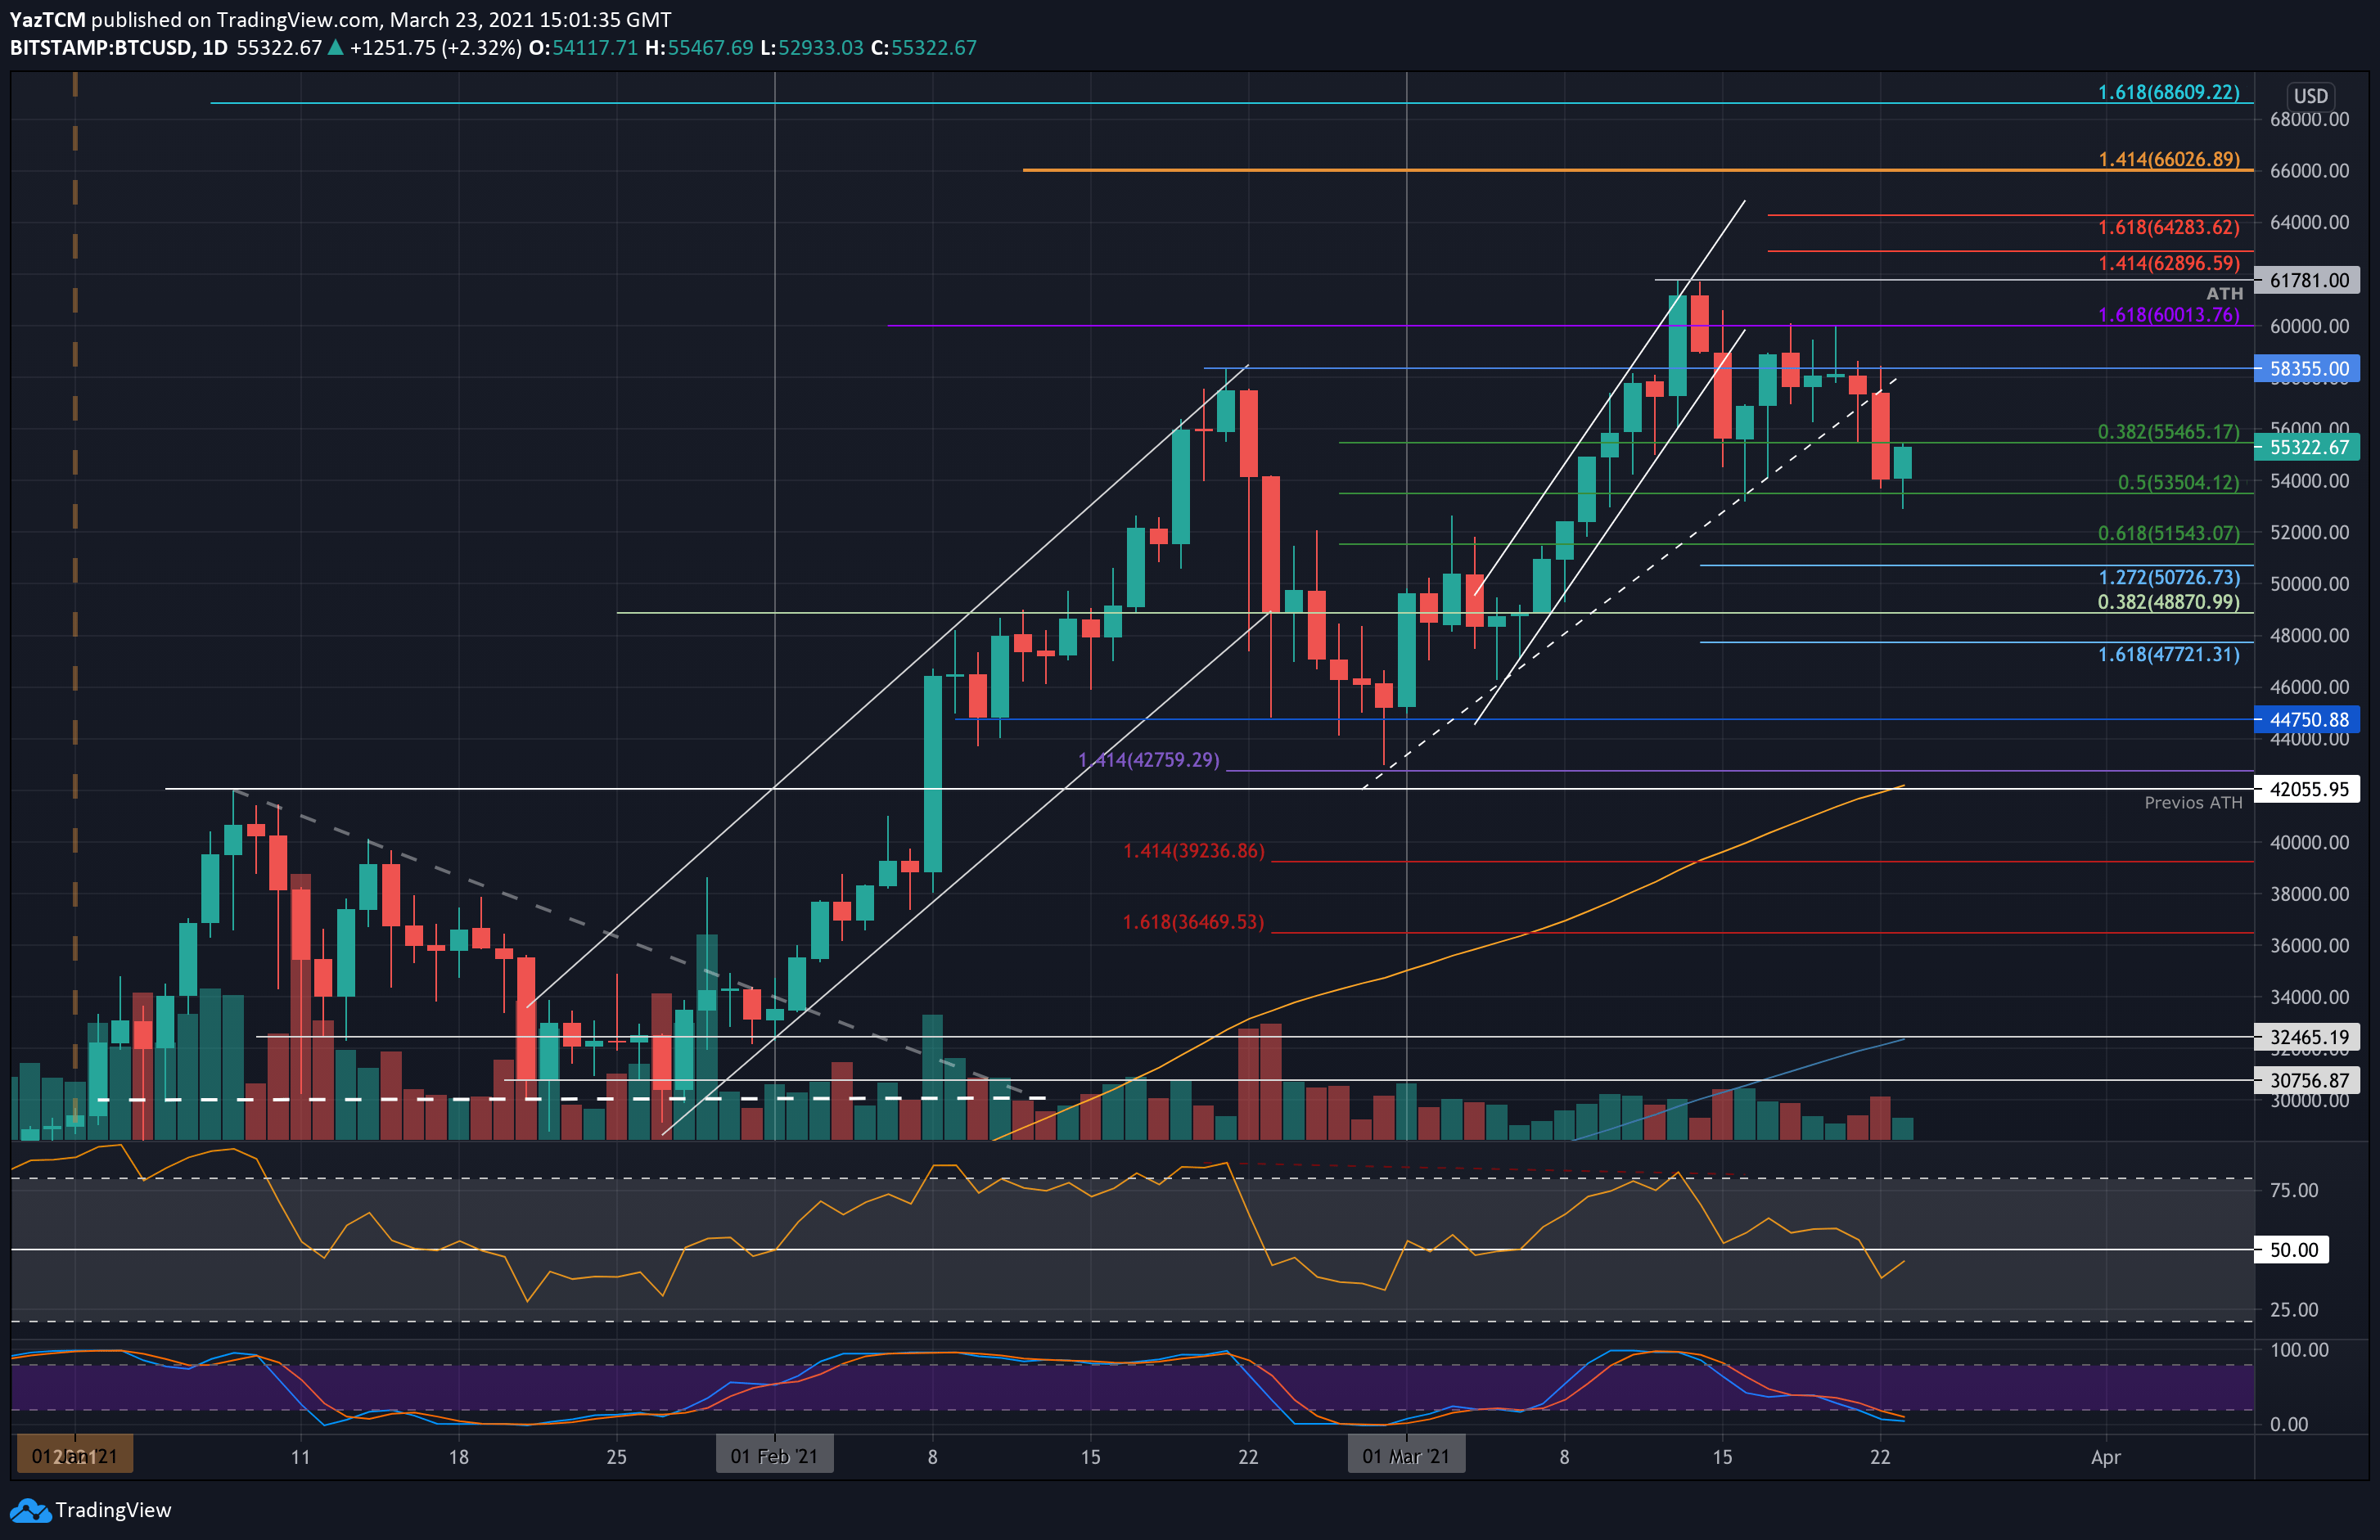
Bitcoin dropped by a sharp 3% today as the cryptocurrency falls to the current $55,000 level. It attempted to break above $60,000 over the weekend but it failed to close a daily candle above $58,355. As a result, BTC slipped from $58,300 yesterday and fell beneath the March ascending trend line to reach as low as $53,700. It rebounded by the end of the day to close the candle at $54,000.
Earlier today, Bitcoin spiked further lower to reach as low as $52,930. Luckily, it found solid short-term support at $54,000, best seen on the 4-Hour charts, and bounced higher from there to climb back above $55,000.
This recent breakdown for BTC might set a short-term bearish trajectory for the coin as it starts to make fresh 2-weeks low.
BTC Price Support and Resistance Levels to Watch
Key Support Levels: $52,000, $52,000, $51,500, $50,700, $50,000.
Key Resistance Levels: $55,000, $58,350, $60,000, $61,780, $62,900.
Looking ahead, the first level of support lies at $54,000. This is followed by support at $52,000, $51,500 (.618 Fib), $50,700 (downside 1.272 Fib Extension), and $50,000.
On the other side, the first resistance lies at $55,500. This is followed by $58,350, $60,000 (1.618 Fib Extension), $61,780 (ATH), and $62,900 (1.414 Fib Extension – red).
The RSI has now plunged beneath the midline, indicating short-term bearish momentum within the market. If it continues to drop, the increased bearish momentum will likely drag Bitcoin back toward $50,000.
Luckily, the Stochastic RSI is already extremely oversold, and a bullish crossover signal should help to stall the downtrend.
Bitstamp BTC/USD Daily Chart
Bitstamp BTC/USD 4-Hour Chart
