The parabolic run of bitcoin does not stop. As we reach Coinbase listing day, the primary cryptocurrency climbed higher to set a new all-time high at ,895, according to BItstamp. This happened earlier today. As of writing these lines, bitcoin retraced a bit. BTC managed to penetrate above ,000 yesterday and closed the daily candle above the level for the first time since mid-March – the time of the previous ATH was set (~.8k). As mentioned above, and since setting the ATH, the price has corrected sharply, retested ,630 as support (short term .236 Fib). Nevertheless, even with the recent short-term price drop, the market sentiment is extremely bullish on all time frames from a technical point of view. From a fundamental point of view – needless to say, amid the
Topics:
Yaz Sheikh considers the following as important: Bitcoin (BTC) Price, BTC Analysis, BTCEUR, BTCGBP, btcusd, btcusdt
This could be interesting, too:
Chayanika Deka writes XRP, SOL, and ADA Inclusion in US Crypto Reserve Pushes Traders on Edge
Chayanika Deka writes Why Arthur Hayes Is Bullish on Bitcoin Under Trump’s Economic Strategy
Mandy Williams writes Why the Bitcoin Market Is Stuck—and the Key Metric That Could Change It: CryptoQuant CEO
Wayne Jones writes Metaplanet Acquires 156 BTC, Bringing Total Holdings to 2,391
The parabolic run of bitcoin does not stop. As we reach Coinbase listing day, the primary cryptocurrency climbed higher to set a new all-time high at $64,895, according to BItstamp. This happened earlier today. As of writing these lines, bitcoin retraced a bit.
BTC managed to penetrate above $60,000 yesterday and closed the daily candle above the level for the first time since mid-March – the time of the previous ATH was set (~$61.8k).
As mentioned above, and since setting the ATH, the price has corrected sharply, retested $62,630 as support (short term .236 Fib). Nevertheless, even with the recent short-term price drop, the market sentiment is extremely bullish on all time frames from a technical point of view. From a fundamental point of view – needless to say, amid the listing of one of the most popular crypto exchanges on NASDAQ, things are also looking good.
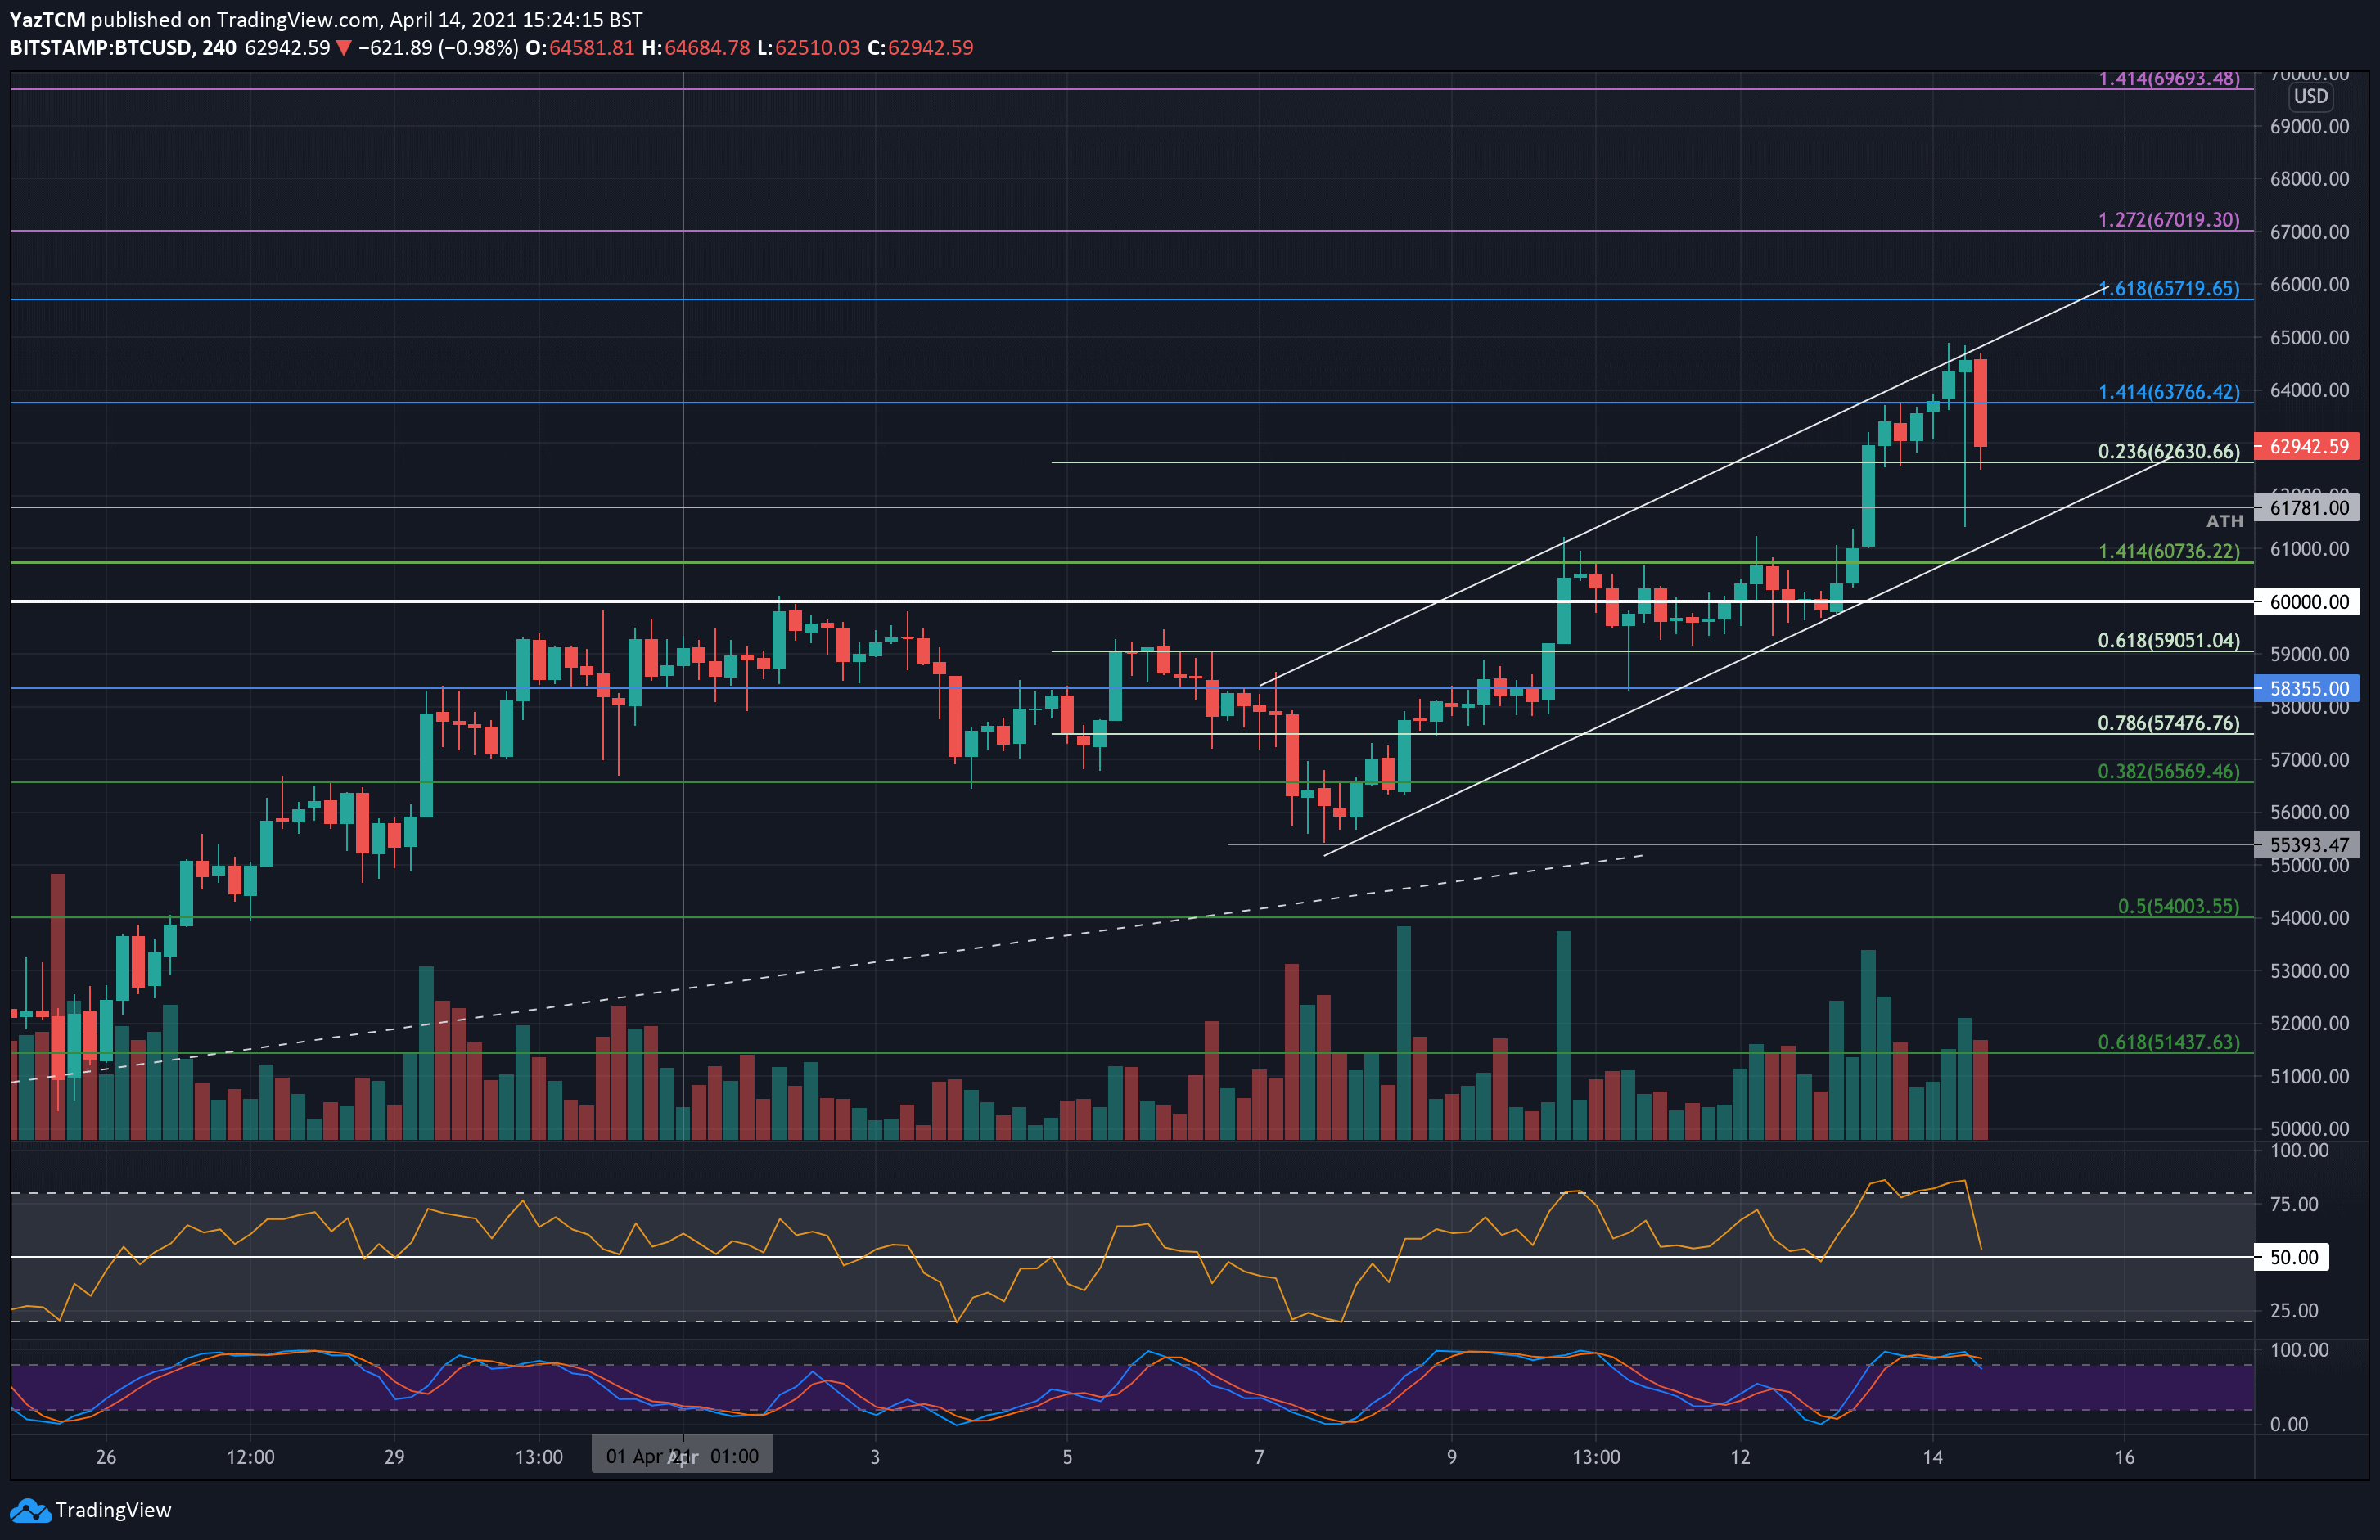
Looking ahead, Bitcoin is starting to form a new ascending price channel on the following short-term chart and as can be seen – got rejected by the channel’s upper border.
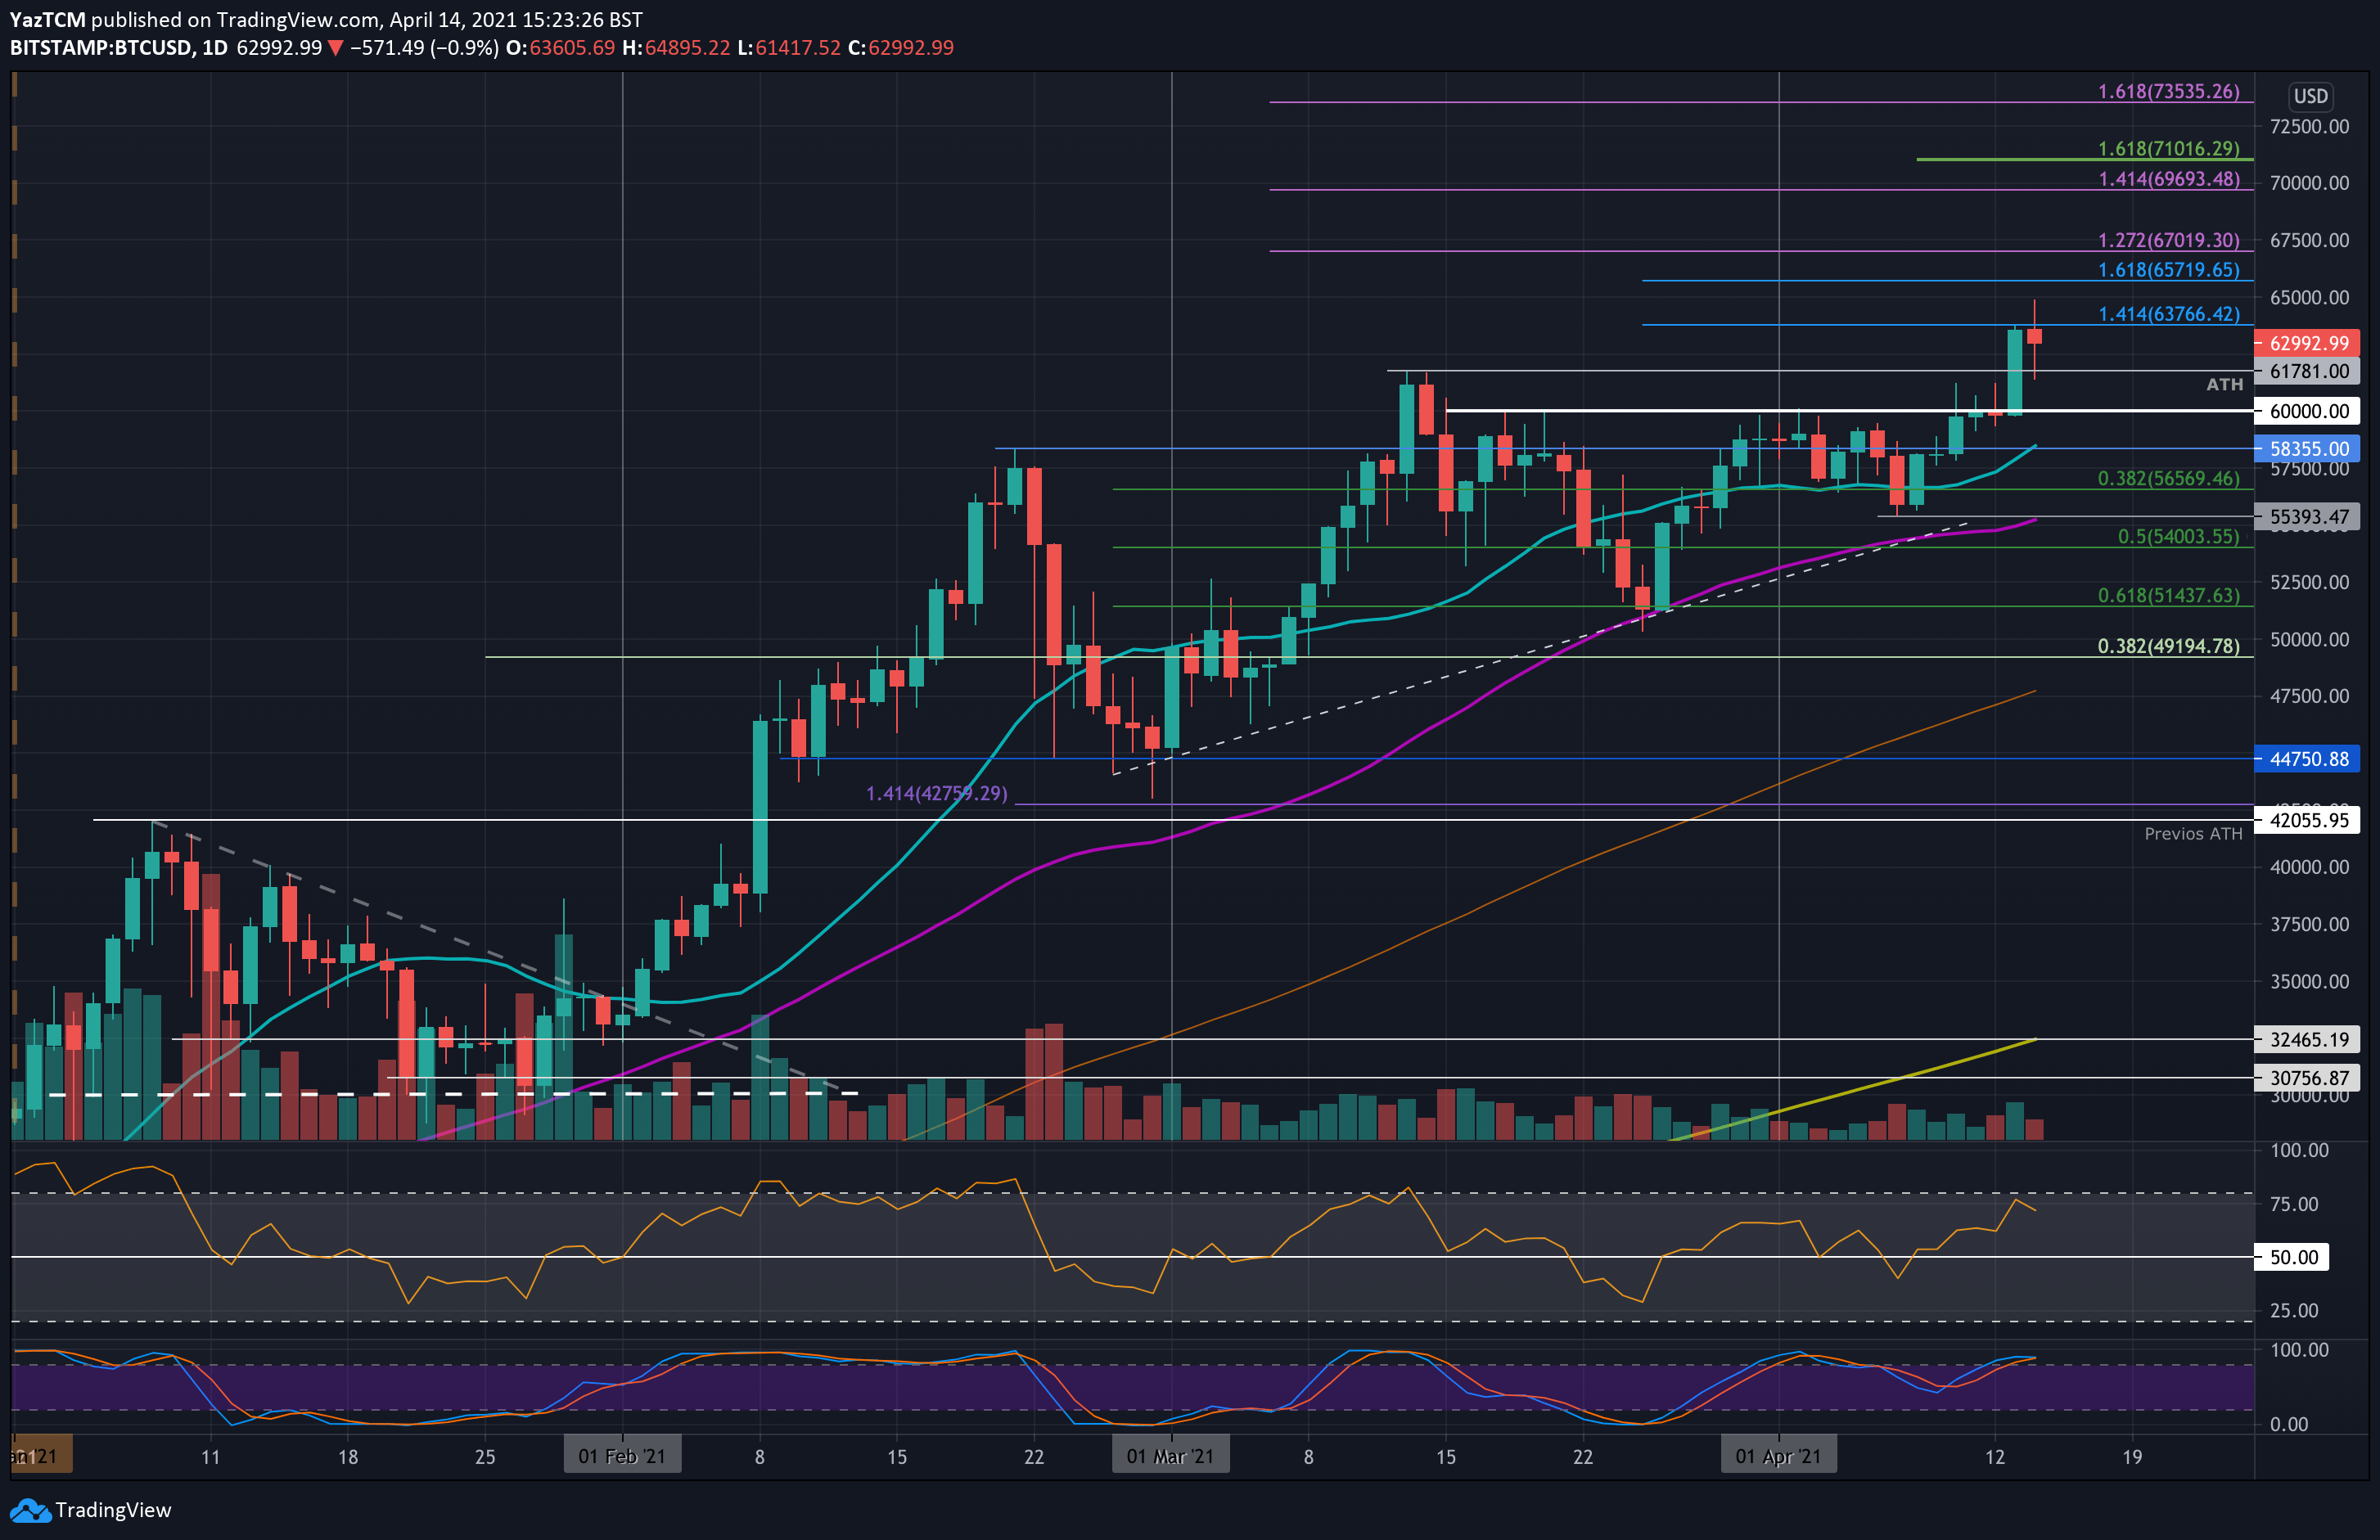
A little worrying sign is a bearish divergence spotted in the daily timeframe. As can be seen, while the price is setting higher highs, the daily RSI is setting lower highs accordingly. Aside from this worrying sign, it seems like $65k is not the end of this bull cycle.
BTC Price Support and Resistance Levels to Watch
Key Support Levels: $62,630, $61,781, $61,000, $60,000.
Key Resistance Levels: $63,765, $64,895 – $65k, $65,720, $67,000, $70,000.
Looking ahead, the first level of resistance lies at $63,765 (1.414 Fib Extension). This is followed by resistance at the ATH of $64,895 – $65k (the upper border of the marked price channel), $65,720 (1.618 Fib Extension), $67,000 (1.272 Fib Extension – purple), and the psychological level of $70,000 (1.414 Fib Extension – purple).
On the other side, the first support lies at $62,630 (.236 Fib). The previous March-13 ATH follows this at $61,781, the lower boundary of the price channel around $61,000 and $60,000. Added support beneath $60,000 is found at $59,050 (.618 Fib) and $58,355 (20-days EMA).
The daily RSI has started to roll over from near overbought conditions but is still heavily in the bulls’ favor – indicating any retracement from here should be short-term only.
There were hints of bearish divergence on the 4-hour charts as price made higher highs while the RSI failed to do so. This bearish divergence has already played out as the 4-hour RSI drops to neutral conditions at the midline. However, and as mentioned above, there is still bearish divergence on the higher time frames.
Bitstamp BTC/USD Daily Chart
Bitstamp BTC/USD 4-Hour Chart