Another volatile weekend: the Bitcoin price is down by 7% over the past 24 hours after losing critical support at ,000. Only three days ago, the cryptocurrency pushed over K but failed to close above the benchmark level.After failing at K, BTC started losing altitude on Friday as it broke beneath a short term rising price channel. It then dropped into support at ,800 (short term .5 Fib Retracement) and rebounded sharply, but couldn’t overcome resistance at K (,940, bearish .618 Fib Retracement) as of yesterday.Looking at the following 4-hour, after it provided support on two different occasions, the MA-50 line got broken down and, moreover, tested earlier today, this time to confirm the line as support-turned-resistance (around K).As of writing these lines, Bitcoin
Topics:
Yaz Sheikh considers the following as important: Bitcoin (BTC) Price, BTC Analysis, BTCEUR, BTCGBP, btcusd, btcusdt
This could be interesting, too:
Chayanika Deka writes XRP, SOL, and ADA Inclusion in US Crypto Reserve Pushes Traders on Edge
Chayanika Deka writes Why Arthur Hayes Is Bullish on Bitcoin Under Trump’s Economic Strategy
Mandy Williams writes Why the Bitcoin Market Is Stuck—and the Key Metric That Could Change It: CryptoQuant CEO
Wayne Jones writes Metaplanet Acquires 156 BTC, Bringing Total Holdings to 2,391
Another volatile weekend: the Bitcoin price is down by 7% over the past 24 hours after losing critical support at $36,000. Only three days ago, the cryptocurrency pushed over $40K but failed to close above the benchmark level.
After failing at $40K, BTC started losing altitude on Friday as it broke beneath a short term rising price channel. It then dropped into support at $34,800 (short term .5 Fib Retracement) and rebounded sharply, but couldn’t overcome resistance at $38K ($37,940, bearish .618 Fib Retracement) as of yesterday.
Looking at the following 4-hour, after it provided support on two different occasions, the MA-50 line got broken down and, moreover, tested earlier today, this time to confirm the line as support-turned-resistance (around $36K).
As of writing these lines, Bitcoin found support upon the same ascending trend-line that stopped the bloodbath that took place on Monday. This time the daily bottom was $33,800, according to BItstamp.
Keeping in mind that it’s Sunday today, the CME Futures Friday’s closing price was $35,625. At the time of this writing, we do not expect any major price gap as we had during the past weekends.
BTC Price Support and Resistance Levels to Watch
Key Support Levels: $34,800, $34,000, $33,400 – $33,130, $30,750, $30,000.
Key Resistance Levels: $36,000, $36,700, $38,000, $39,700, $40,000.
Looking from the bearish side, if the sellers break down the support at $34,800 (short term .5 Fib), the next level of support lies at $34,000. This is followed by the ascending trend line currently around $33,400 (the same line that Bitcoin found last Monday’s bottom), $33,130 (short term .618 Fib), and $30,750 (short term .786 Fib) – and also the weekly low recorded on Monday.
On the other side, the first level of resistance lies at $36,000. This is followed by $36,700 (bearish .5 Fib & 4-hour 50-MA line), $38,000 (bearish .618 Fib), and $39,700 (bearish .786 Fib).
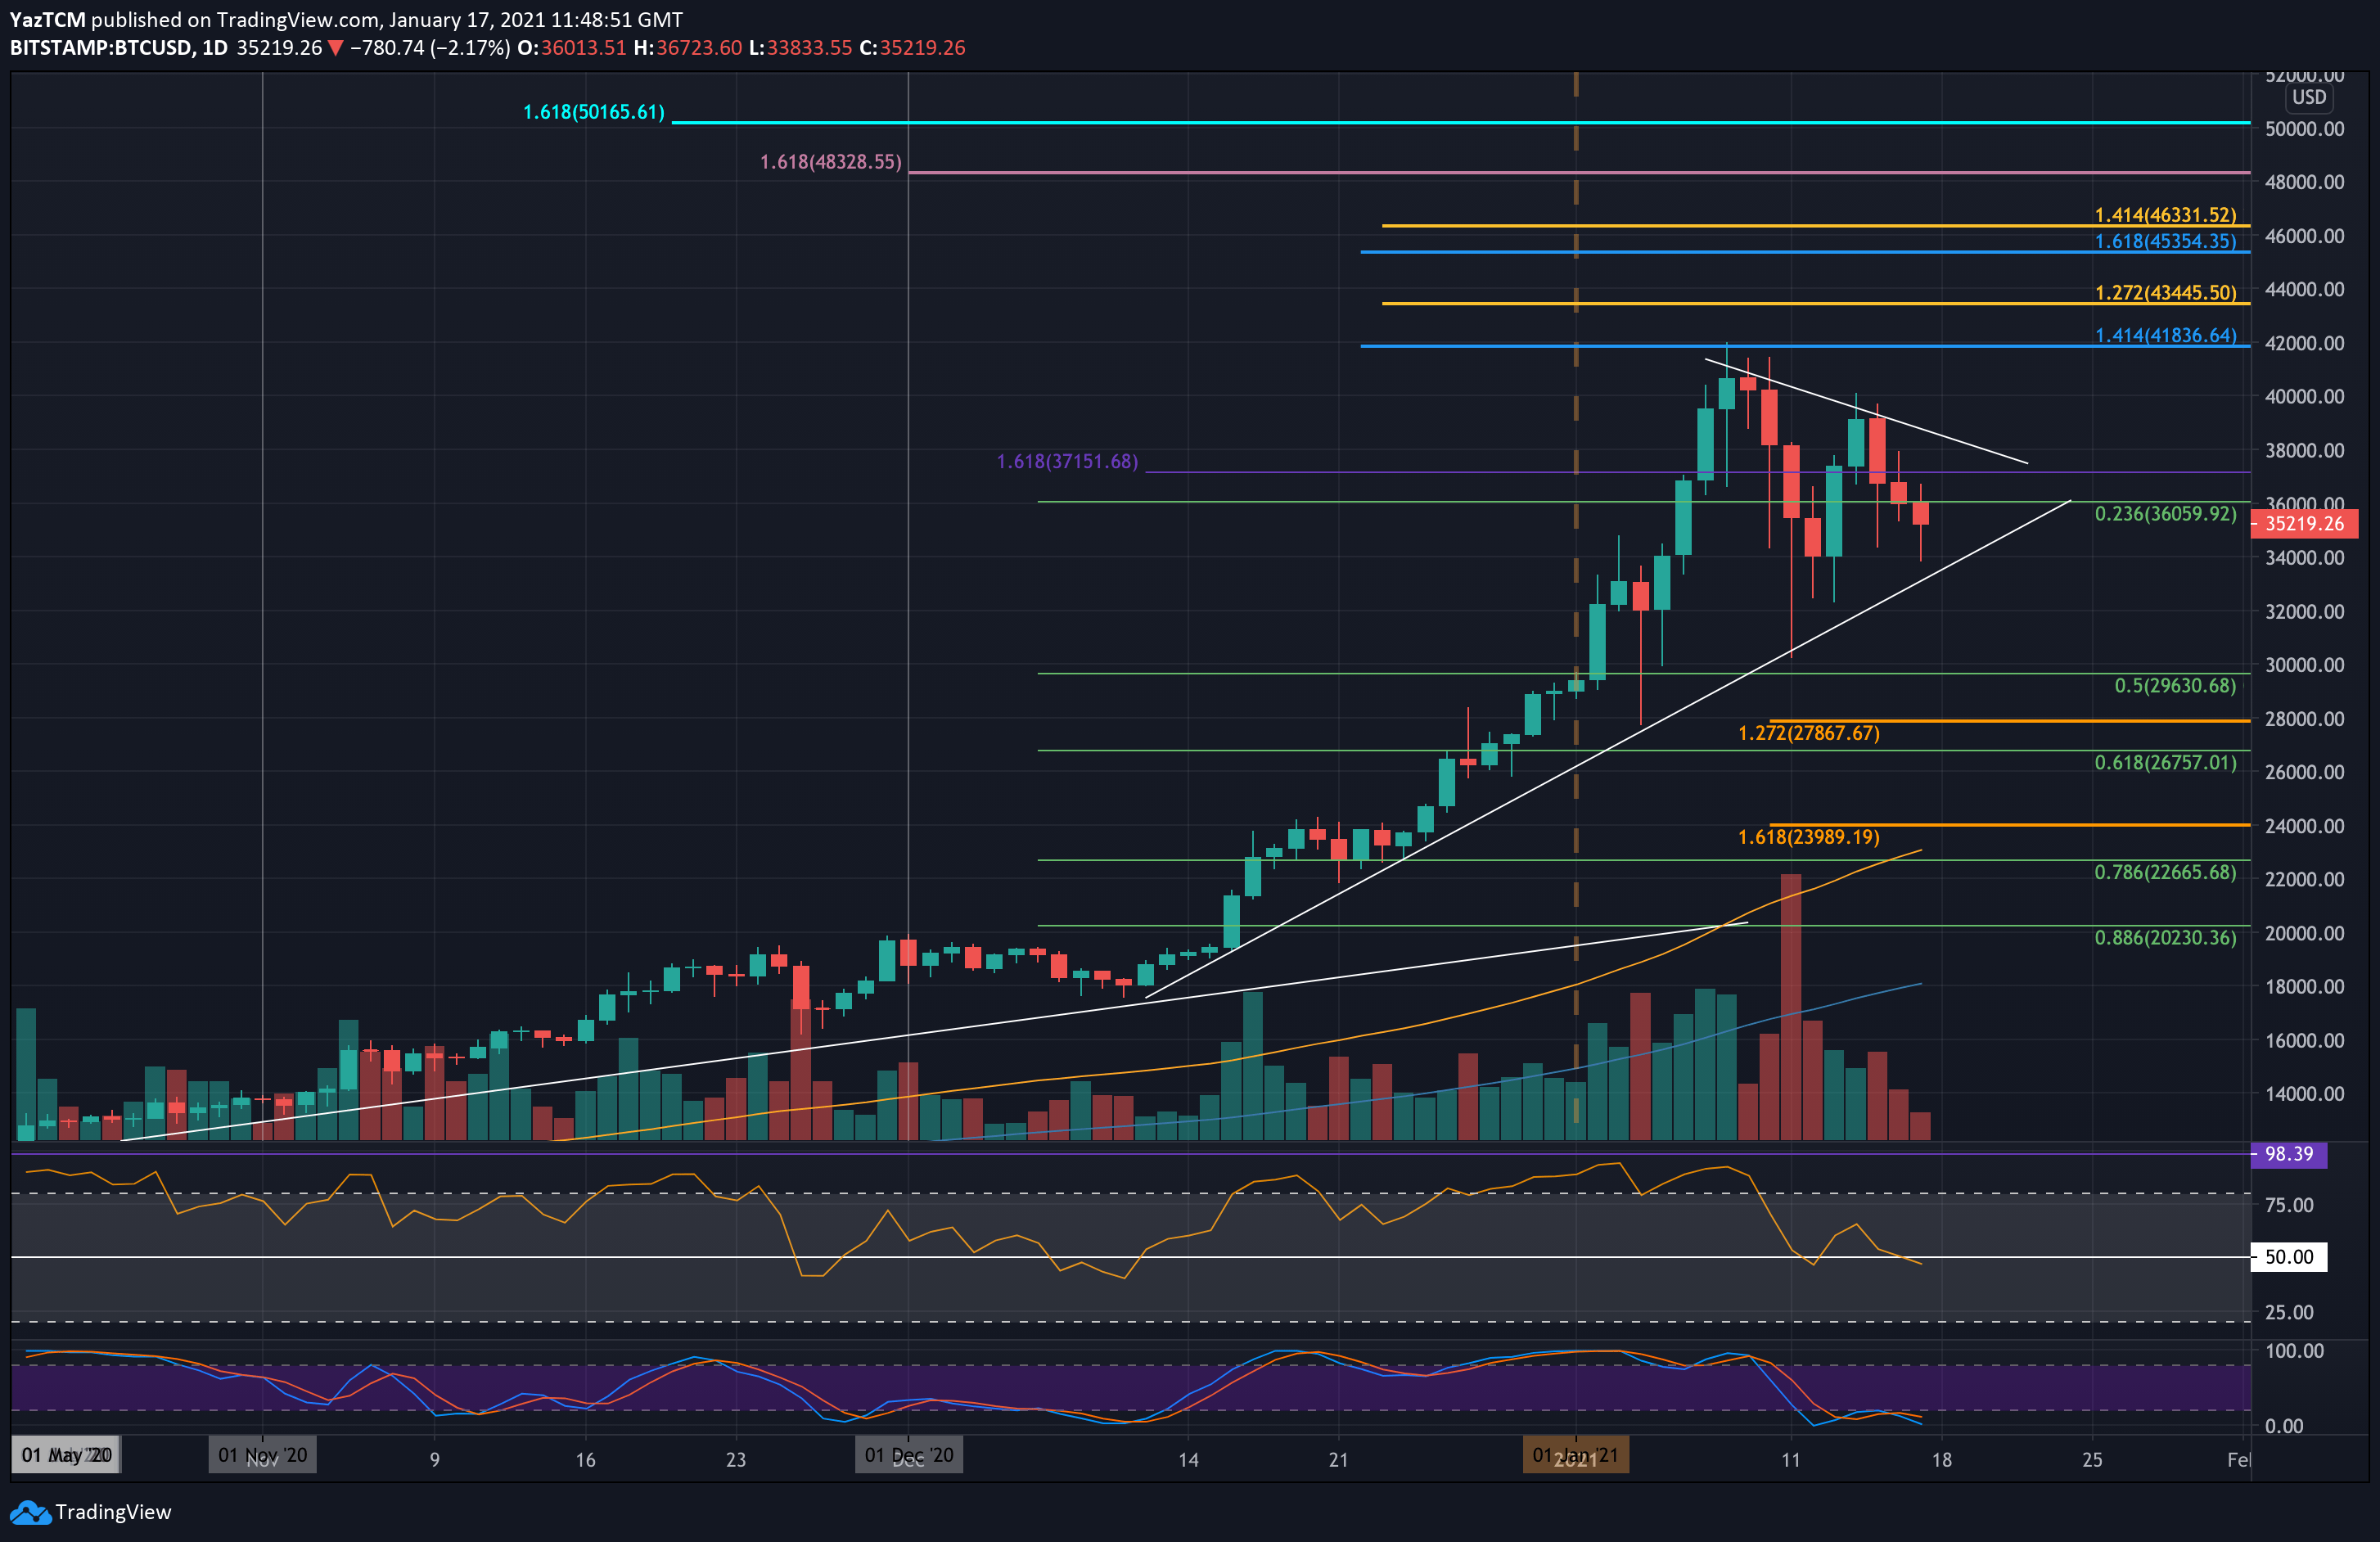
The daily RSI set a lower high and is in the process of creating a lower low, which might indicate a short-term bearish trend. Additionally, it is struggling to stay on top of the mid-line and not to enter the bearish territory.
Bitstamp BTC/USD Daily Chart
Bitstamp BTC/USD 4-Hour Chart
