The Bitcoin price surged by over 00 today, which is a new record, as of writing these lines. The solid 13% daily rise had brought BTC beyond ,000 to reach a new ATH at ,333 (according to Bitstamp).Over the past week, Bitcoin managed to increase by a robust 32%, which also marked a new ATH for Bitcoin’s market cap – over 0 billion, as well as the total crypto market cap, which recorded currently hovers around 6 billion, with Bitcoin dominating 71% of it.A quick recap of the past month: Bitcoin managed to break beyond the 3-year ATH level of ,000 on December 16th, just two weeks ago, and has continued to create fresh ATHs ever since. ,900 – ,000 provided some resistance for the past few days, but this was finally broken as Bitcoin surged above K in the first two
Topics:
Yaz Sheikh considers the following as important: Bitcoin (BTC) Price, BTC Analysis, BTCEUR, BTCGBP, btcusd, btcusdt
This could be interesting, too:
Chayanika Deka writes XRP, SOL, and ADA Inclusion in US Crypto Reserve Pushes Traders on Edge
Chayanika Deka writes Why Arthur Hayes Is Bullish on Bitcoin Under Trump’s Economic Strategy
Mandy Williams writes Why the Bitcoin Market Is Stuck—and the Key Metric That Could Change It: CryptoQuant CEO
Wayne Jones writes Metaplanet Acquires 156 BTC, Bringing Total Holdings to 2,391
The Bitcoin price surged by over $3300 today, which is a new record, as of writing these lines. The solid 13% daily rise had brought BTC beyond $30,000 to reach a new ATH at $33,333 (according to Bitstamp).
Over the past week, Bitcoin managed to increase by a robust 32%, which also marked a new ATH for Bitcoin’s market cap – over $600 billion, as well as the total crypto market cap, which recorded currently hovers around $856 billion, with Bitcoin dominating 71% of it.
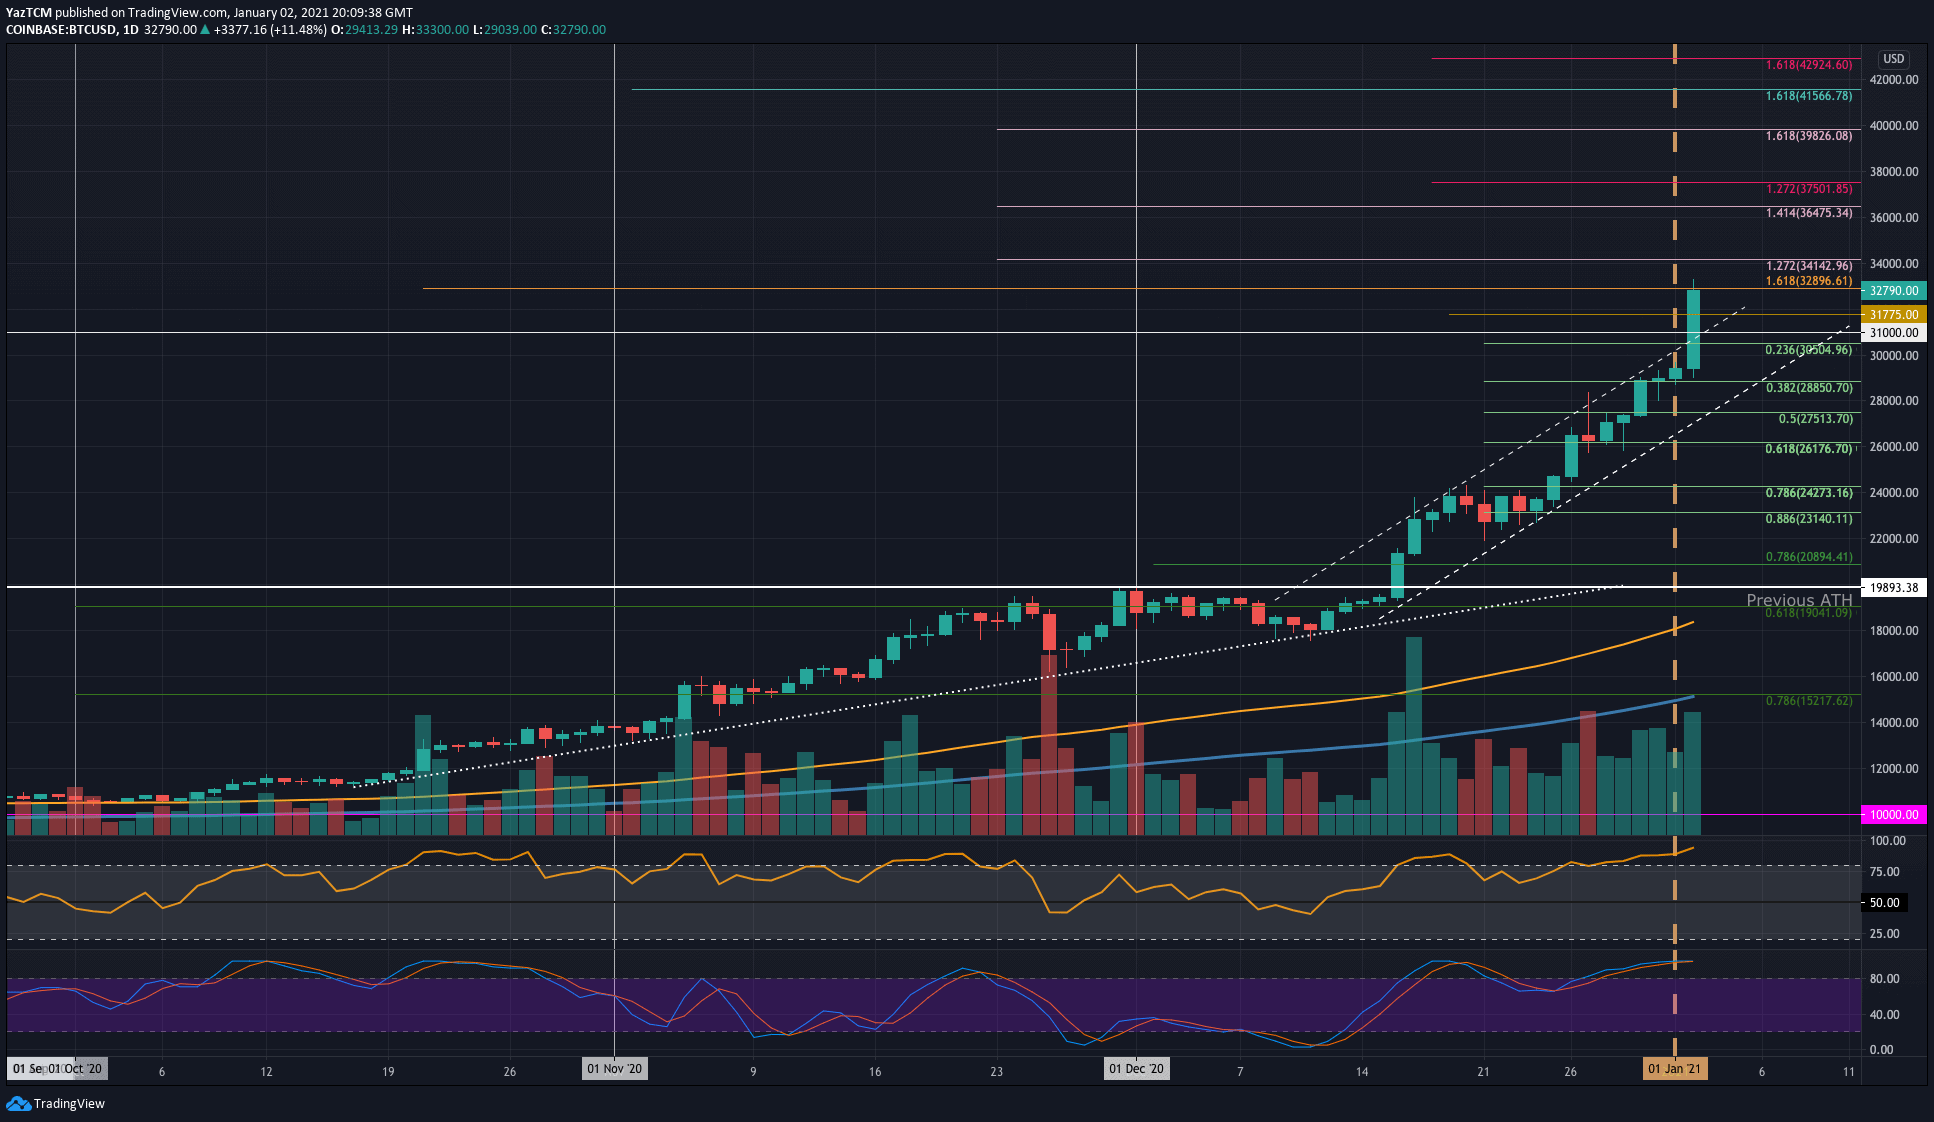
A quick recap of the past month: Bitcoin managed to break beyond the 3-year ATH level of $20,000 on December 16th, just two weeks ago, and has continued to create fresh ATHs ever since. $27,900 – $28,000 provided some resistance for the past few days, but this was finally broken as Bitcoin surged above $33K in the first two days of 2021, breaking out an ascending price channel parabolically (marked on the following daily chart).
BTC Price Support and Resistance Levels To Watch
Key Support Levels: $32,500, $31,800, $30,500, $30,000.
Key Resistance Levels: $32,900, $33,300, $34,100, $35,000.
As Bitcoin is creating new ATHs, it is currently in a price discovery zone – a zone where the asset was never traded before. Therefore, there is no past resistance available above $33,300, and we will need to predict possible levels using the Fibonacci Extension Tool.
Looking at the daily chart, if the buyers continue to push higher, the first level of resistance lies at $32,900 (Long term 1.618 Fib Extension). This is followed by $33,300 (current ATH), $34,140 (1.272 Fib Extension – pink), $35,000, and $36,475 (1.414 Fib Extension – pink).
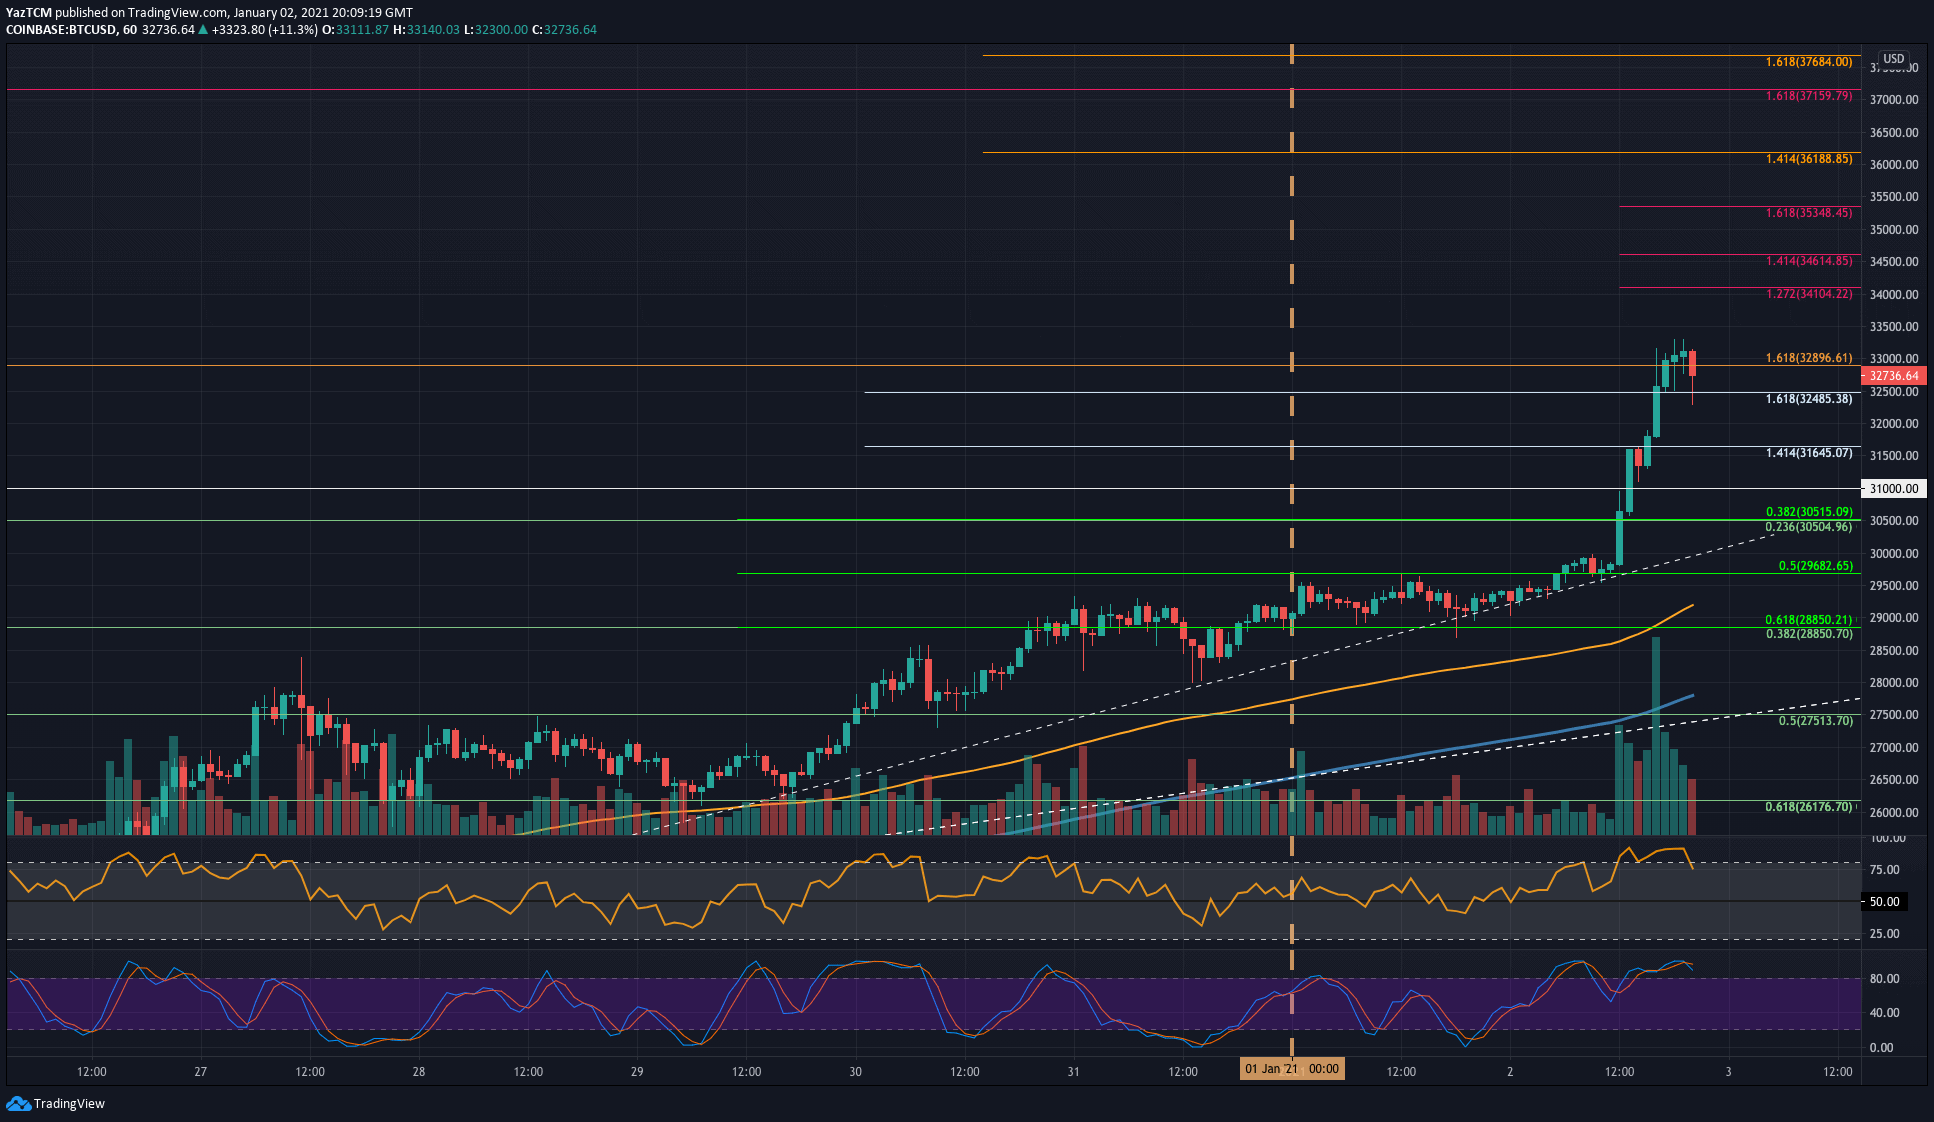
On the other hand, in case of a correction, the first major level of support lies at $32,500, followed by support at $31,800 (the ascending channel on the daily chart below). Further support lies at $30,500 (.236 Fib Retracement), $30,000, and $28,850 (.382 Fib Retracement).
The RSI is at an extremely overbought level that has not been since August 2020. Additionally, the Stochastic RSI is primed for a bearish crossover signal that a correction is needed following the recent parabolic run.
Coinbase BTC/USD Daily Chart
Coinbase BTC/USD 1HR Chart