Bitcoin is down by a total of 17% since last Sunday as the primary cryptocurrency struggles to regain ground above the ,000 milestone. Most of the downside action took place on Wednesday, after Tesla announced they halted to accept BTC as a payment method for their electric vehicles. The news sent BTC tumbling as it slipped to an 11-week low at ,700, according to Bitstamp. The bulls attempted to rebound on Thursday and Friday as they battled to break back above ,000. Although they did spike above the level, they failed to close a daily candle above ,000. Earlier today, the bulls have started to rebound but are seeing resistance around ,000, where lies a bearish .236 Fib Retracement. Yesterday’s price drop caused bitcoin to fall and close beneath a long-term
Topics:
Yaz Sheikh considers the following as important: Bitcoin (BTC) Price, BTC Analysis, BTCEUR, BTCGBP, btcusd, btcusdt
This could be interesting, too:
Chayanika Deka writes XRP, SOL, and ADA Inclusion in US Crypto Reserve Pushes Traders on Edge
Chayanika Deka writes Why Arthur Hayes Is Bullish on Bitcoin Under Trump’s Economic Strategy
Mandy Williams writes Why the Bitcoin Market Is Stuck—and the Key Metric That Could Change It: CryptoQuant CEO
Wayne Jones writes Metaplanet Acquires 156 BTC, Bringing Total Holdings to 2,391
Bitcoin is down by a total of 17% since last Sunday as the primary cryptocurrency struggles to regain ground above the $50,000 milestone. Most of the downside action took place on Wednesday, after Tesla announced they halted to accept BTC as a payment method for their electric vehicles.
The news sent BTC tumbling as it slipped to an 11-week low at $45,700, according to Bitstamp. The bulls attempted to rebound on Thursday and Friday as they battled to break back above $50,000. Although they did spike above the level, they failed to close a daily candle above $50,000.
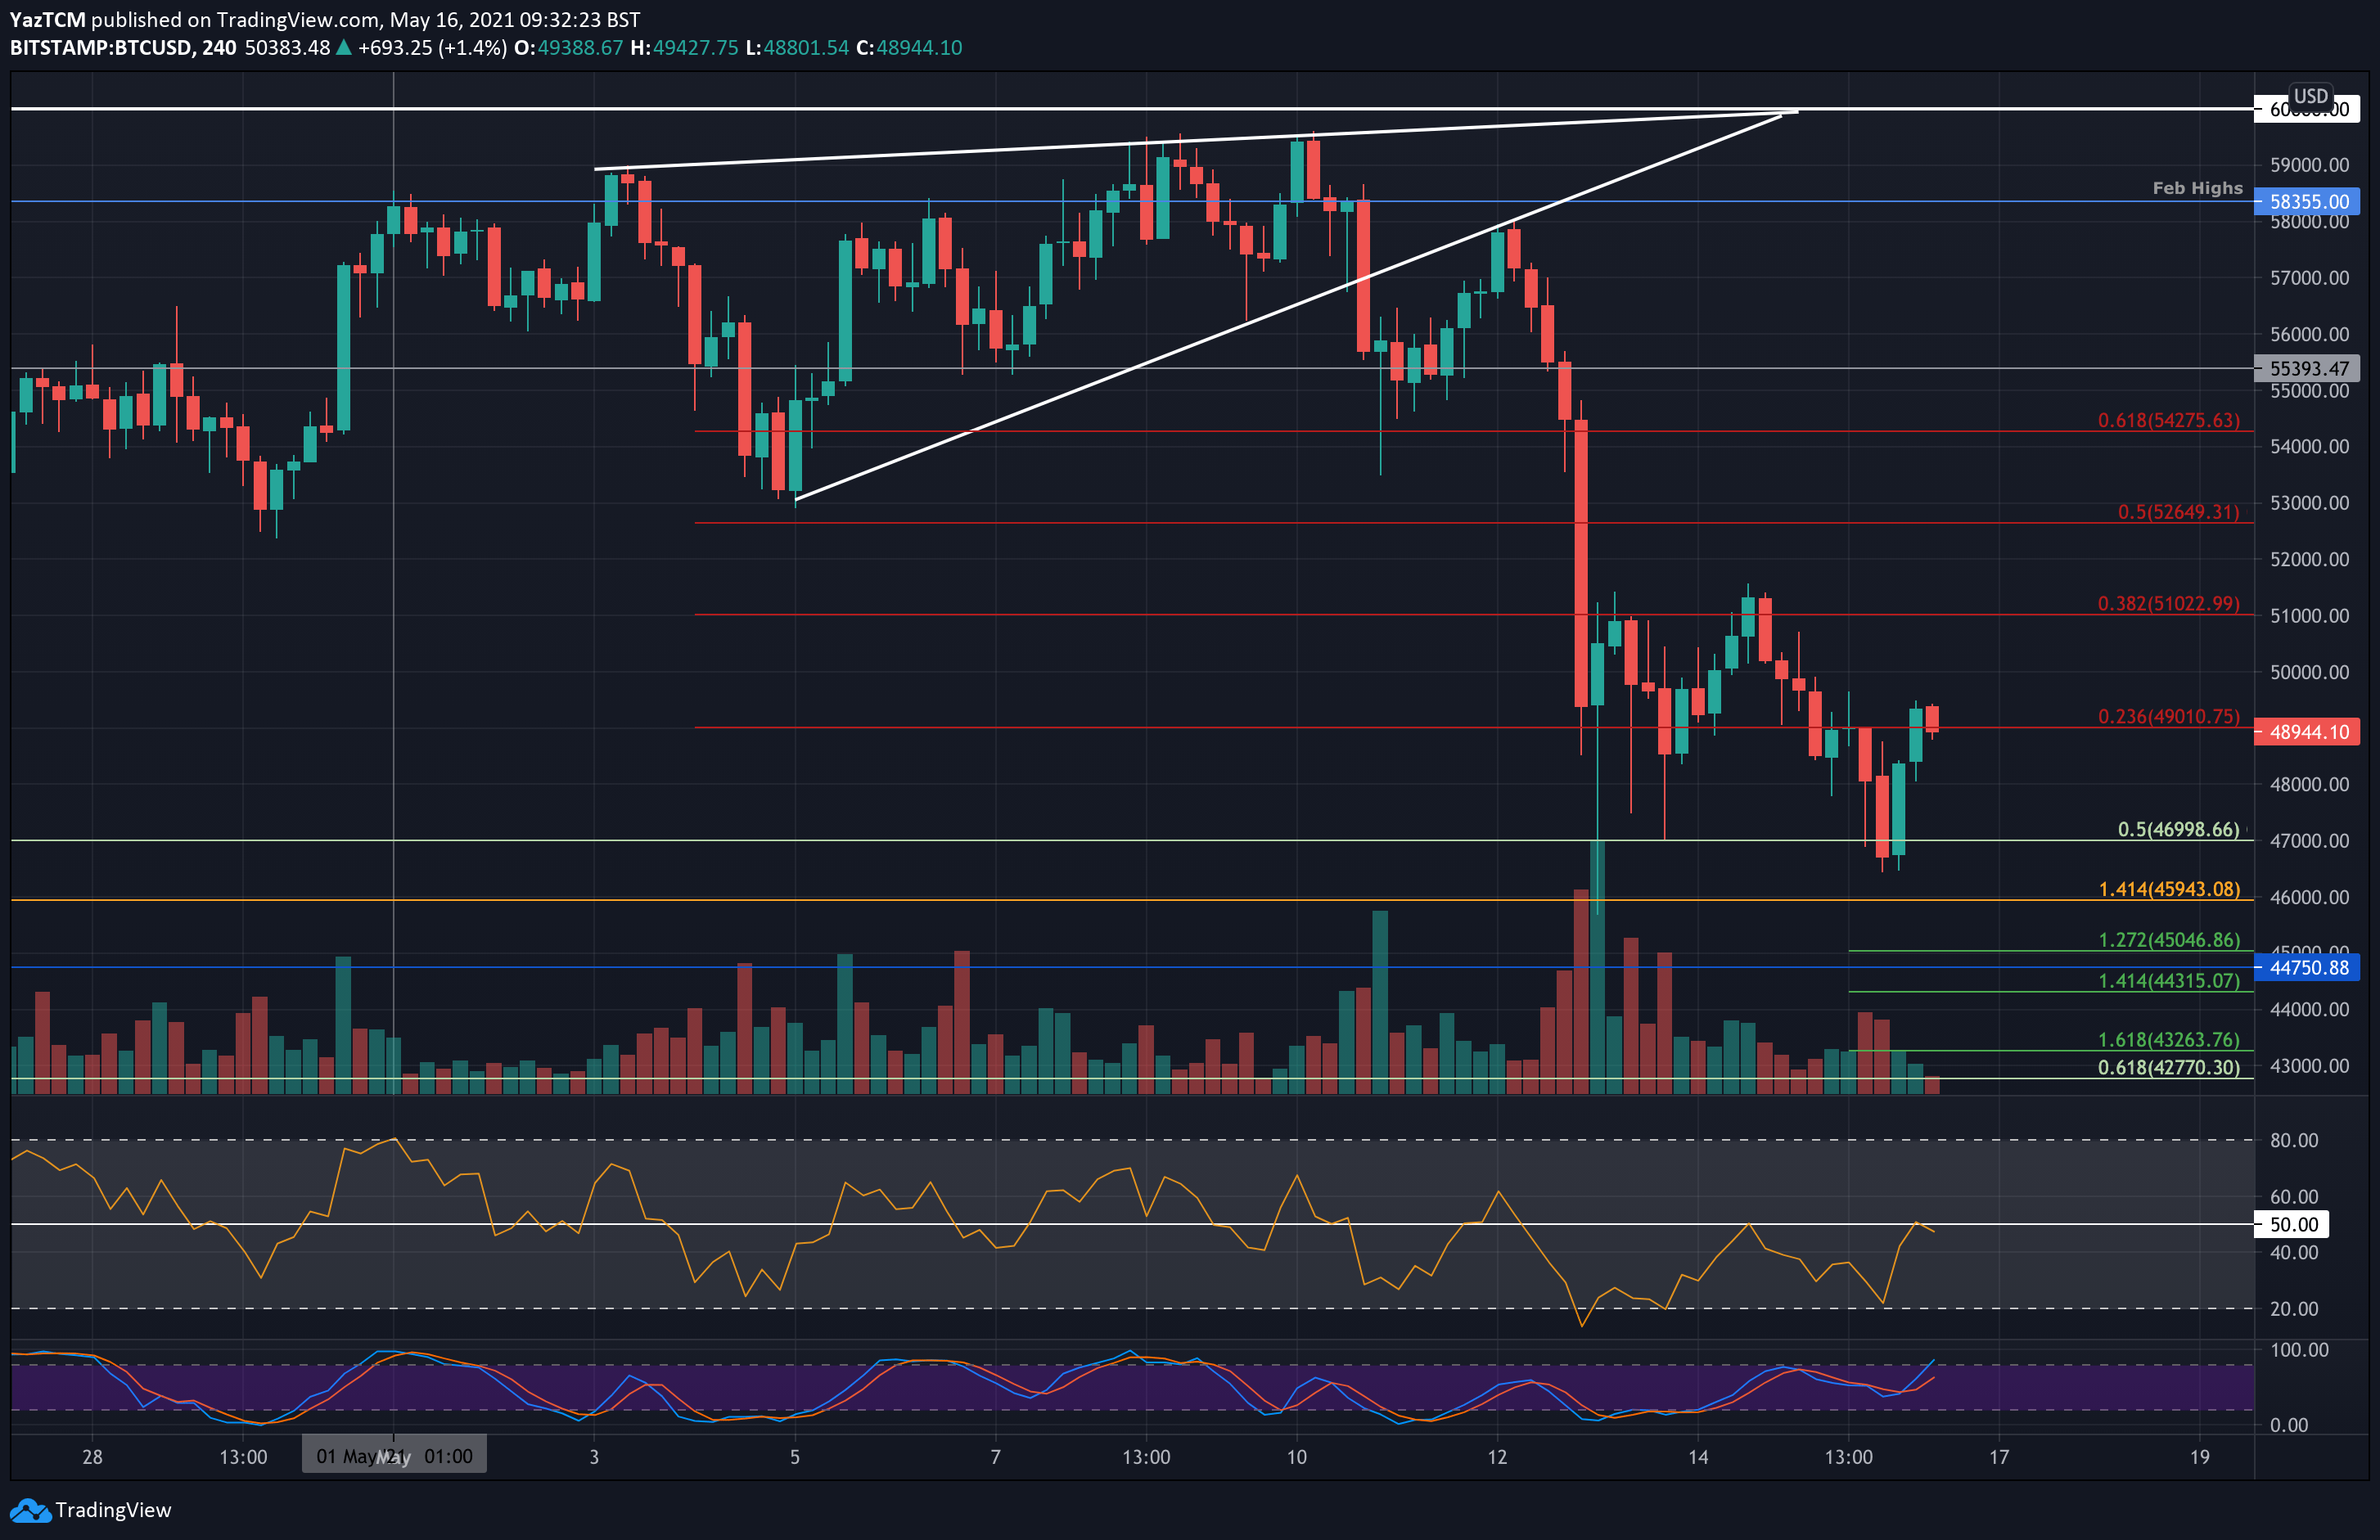
Earlier today, the bulls have started to rebound but are seeing resistance around $49,000, where lies a bearish .236 Fib Retracement.
Yesterday’s price drop caused bitcoin to fall and close beneath a long-term rising trend line dating back to February 2021. However, the market is still battling to remain above the neckline of the following long-term Head & Shoulders pattern. So far, so good; however, the bearish H&S pattern is still valid.
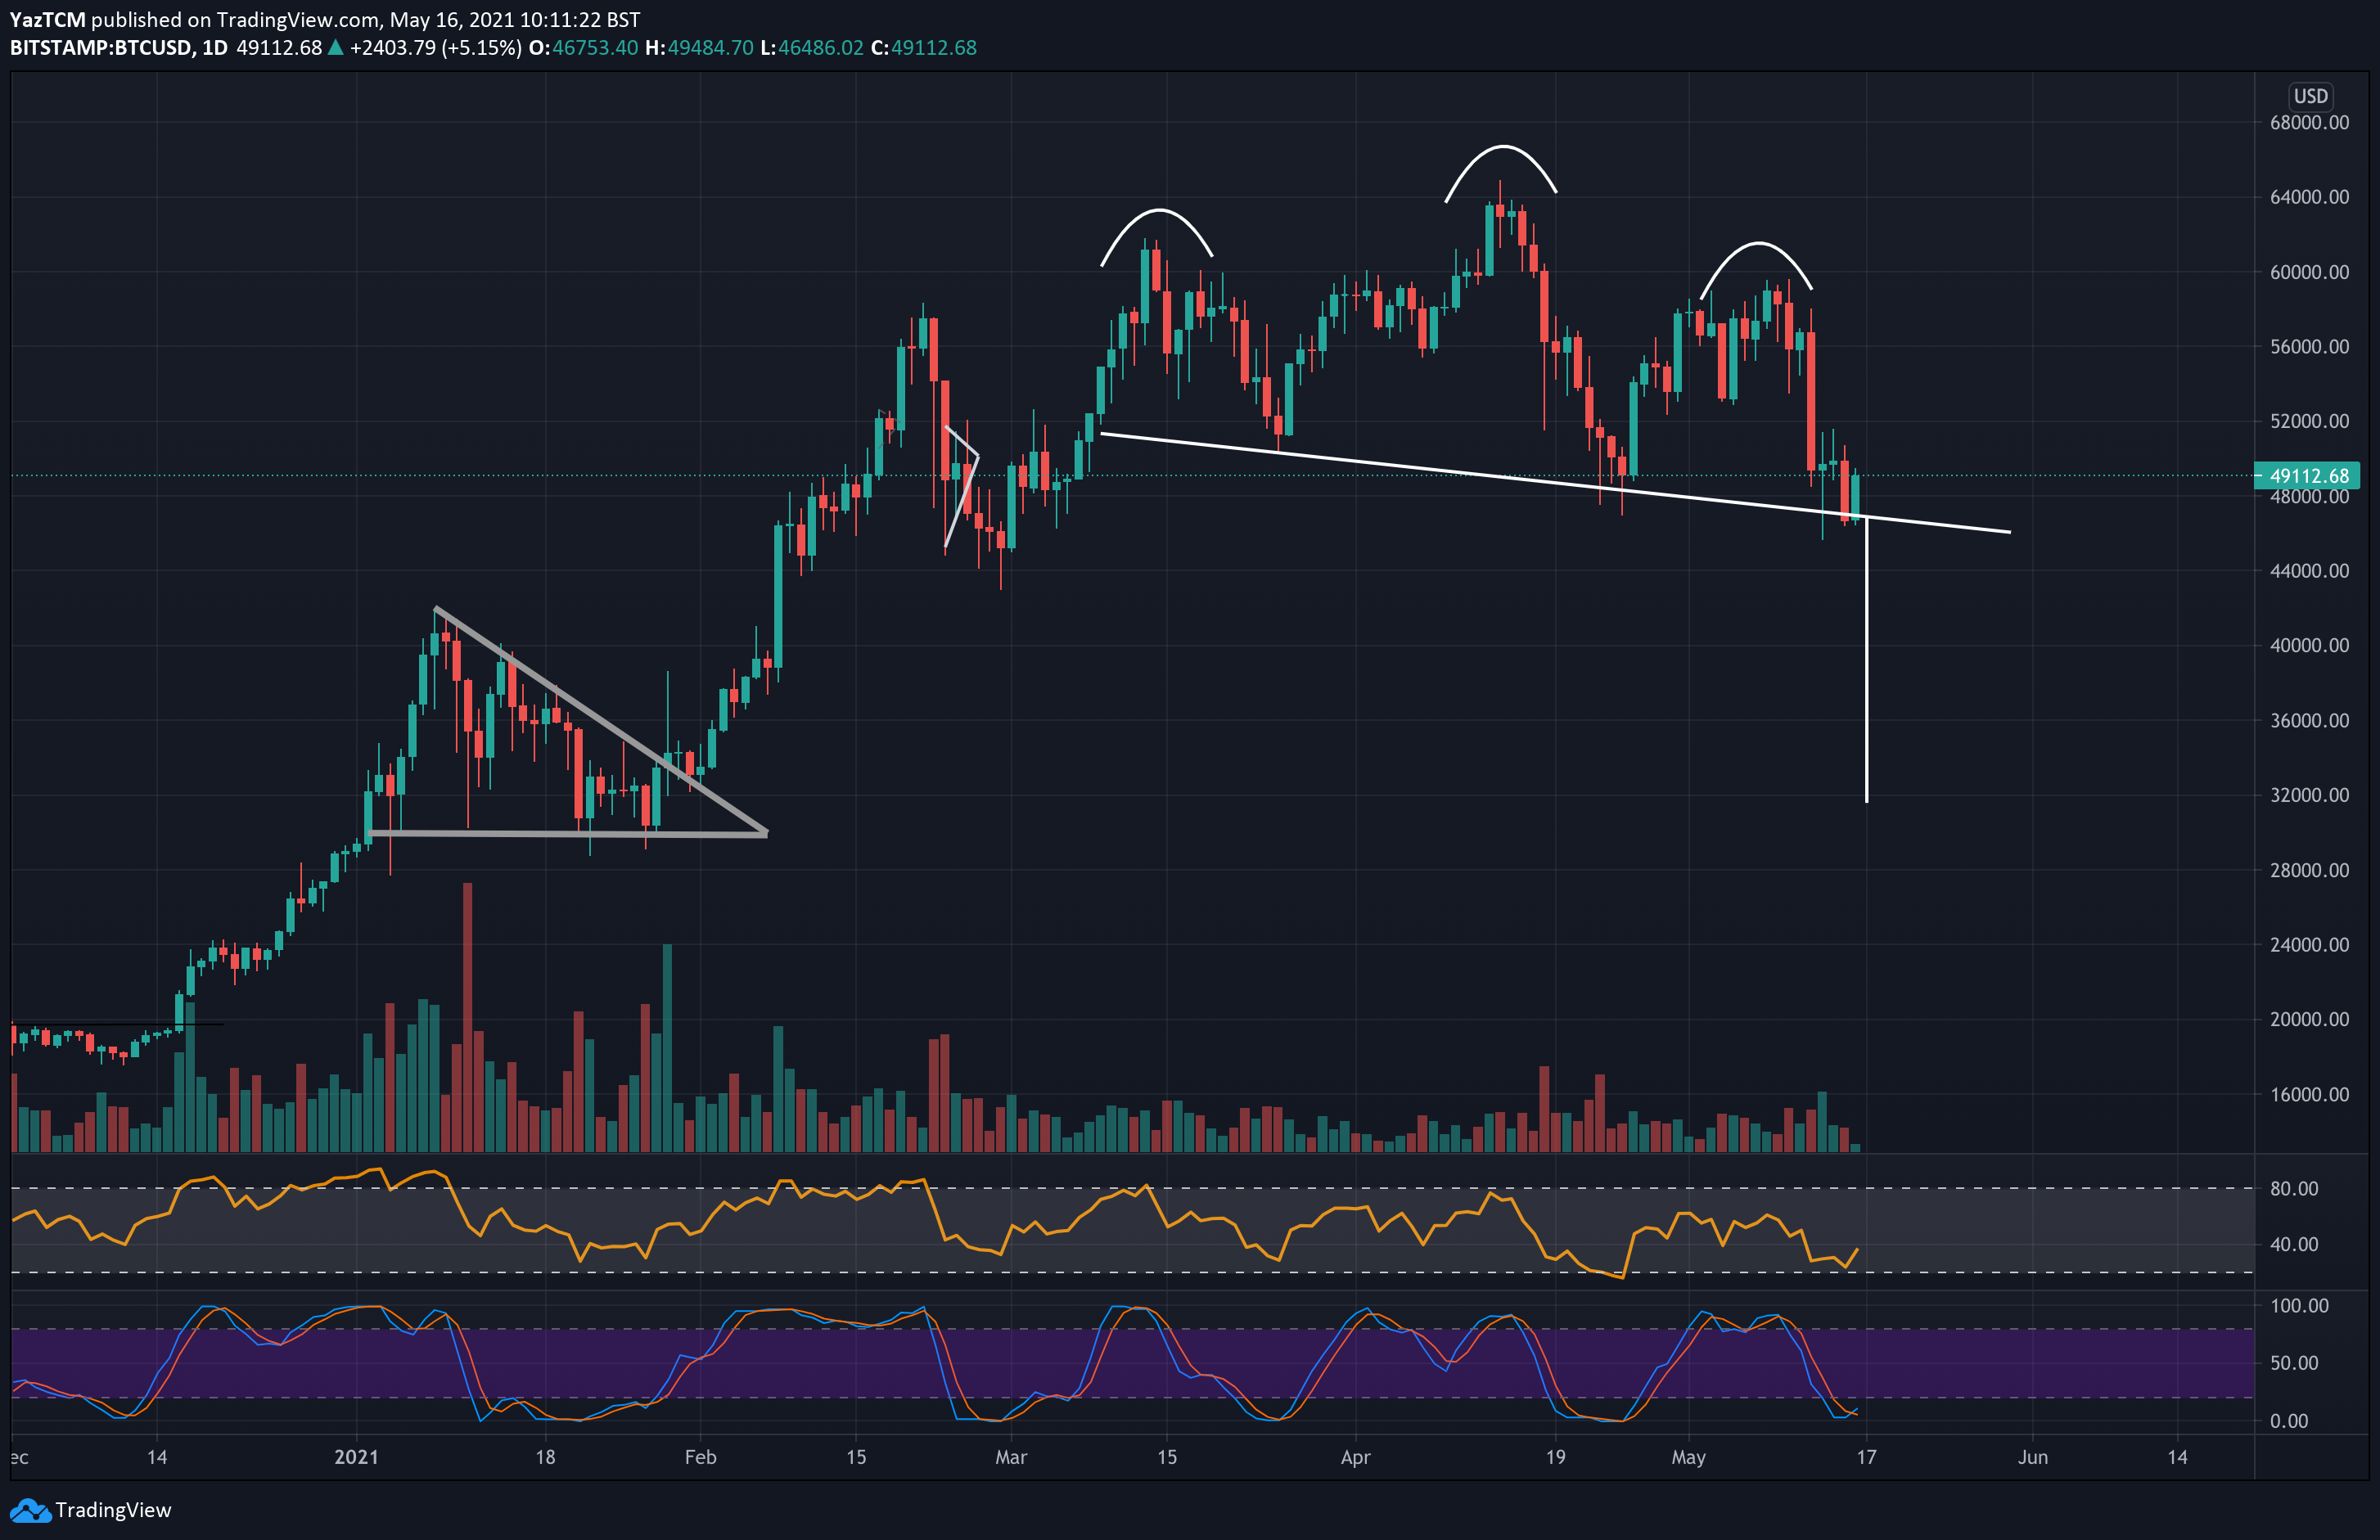
A break beneath this neckline, with a daily close below, could result in Bitcoin plummetting into the $32,000 level. Lastly, it is essential to point out the price drop this week caused bitcoin to make a lower low – a worrying signal that could be the first alert of the current bull run potentially ending.
BTC Price Support and Resistance Levels to Watch
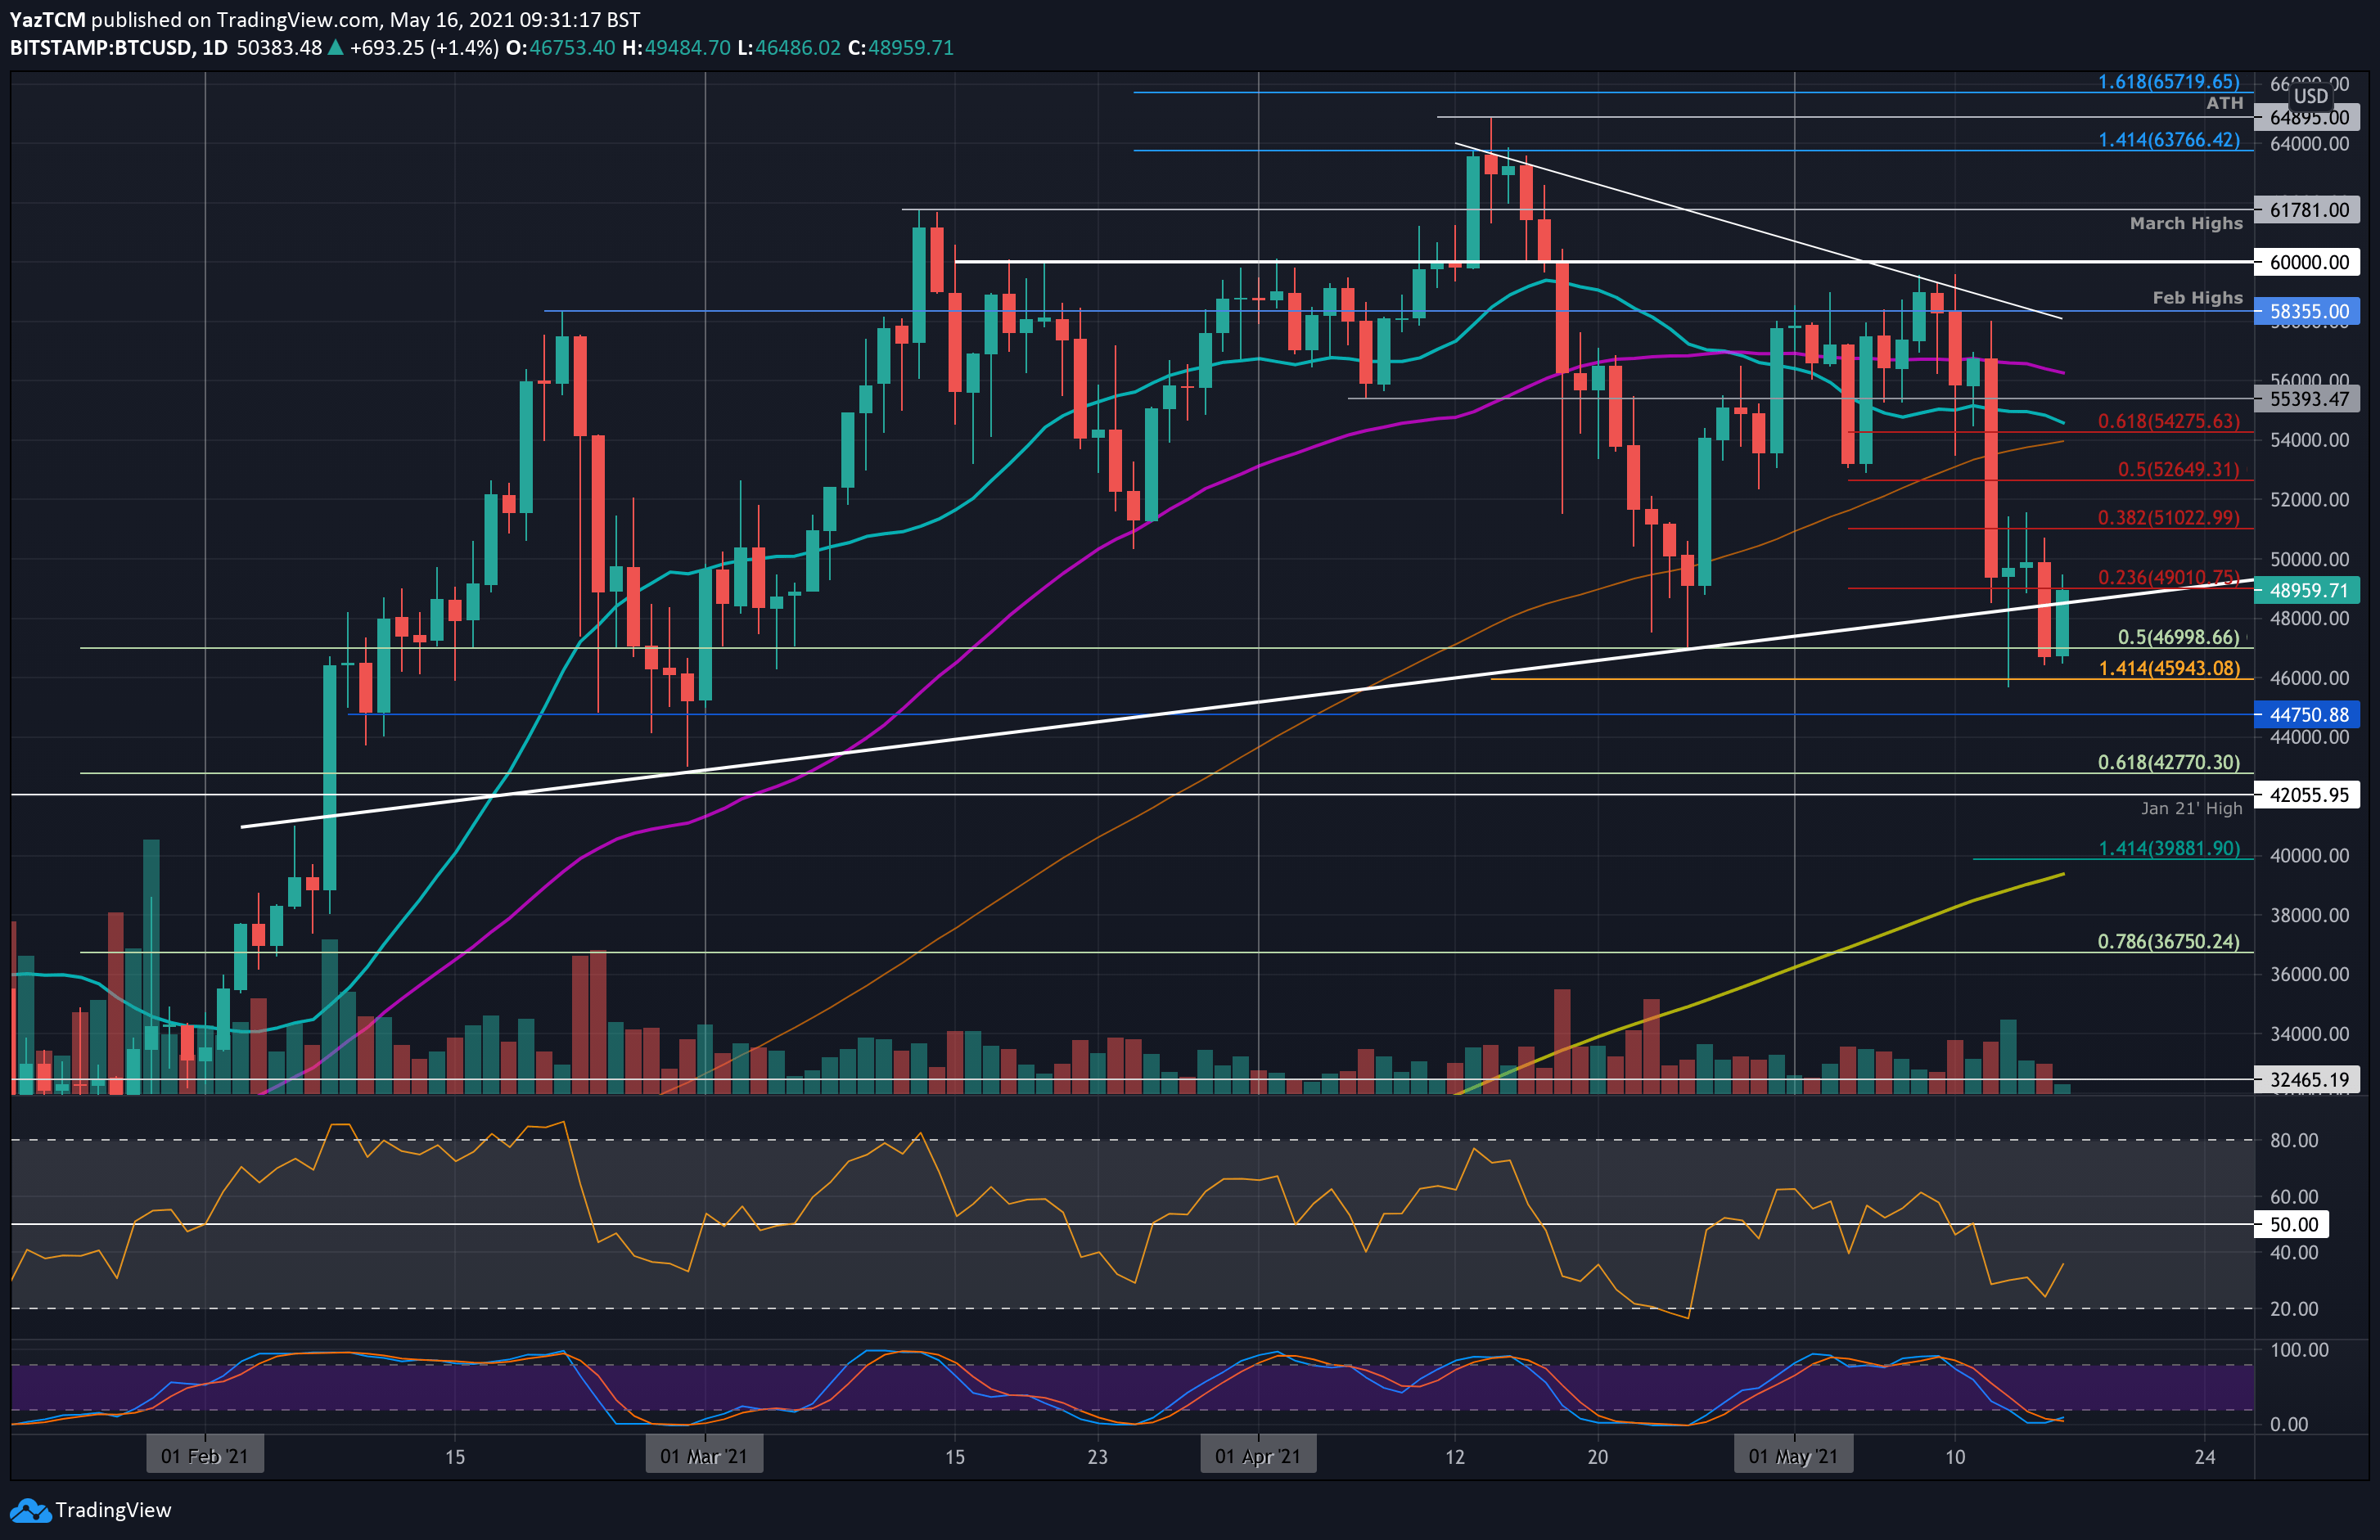
Key Support Levels: $49,000, $46,500, $46,000, $44,750, $42,770, $42,000.
Key Resistance Levels: $50,000, $51,000, $52,650.
Looking ahead, the first support lies at current levels around the $49k mark. This is followed by today’s low – around $46,500 and $46,000 (Downside 1.414 Fib Extension). Further below lies $44,750, $42,770 (.618 Fib), and $42,000 (Jan 21 highs).
On the other side, the first strong resistance lies at $49,000 (bearish .236 Fib). This is followed by $50,000, $51,000 (bearish .382 Fib), $52,650 (bearish .5 Fib), and $54,000 (100-days MA).
The RSI has bounced from near oversold conditions, which could suggest the recently short-term bearish momentum is starting to fade. Additionally, the Stochastic RSI is primed for a bullish crossover signal that could bring bullish pressure back into the market.
Bitstamp BTC/USD Daily Chart
Bitstamp BTC/USD 4-Hour Chart