Bitcoin is up by a strong 7.5% today as the cryptocurrency grinds back toward the ,000 level, this becomes even more impressive as Wall Street indices are down 1-2%. Decoupling? so far, so good.Quick recap: BTC had reached a new ATH over the weekend as it hit ,780 (Bitstamp) on Saturday. From there, it rolled over during the start of this week, whereas on Tuesday it hit the current weekly low at 220. There, support was found upon an ascending trend line that started forming on February’s last day.Looking at the short-term timeframe, over the past 24 hours Bitcoin was forming a falling wedge, as can be seen on the 1-hour chart below. The wedge pattern broke to the bullish side just shortly before writing this update.Following the breakout, Bitcoin soared towards the k
Topics:
Yaz Sheikh considers the following as important: Bitcoin (BTC) Price, BTC Analysis, BTCEUR, BTCGBP, btcusd, btcusdt
This could be interesting, too:
Chayanika Deka writes XRP, SOL, and ADA Inclusion in US Crypto Reserve Pushes Traders on Edge
Chayanika Deka writes Why Arthur Hayes Is Bullish on Bitcoin Under Trump’s Economic Strategy
Mandy Williams writes Why the Bitcoin Market Is Stuck—and the Key Metric That Could Change It: CryptoQuant CEO
Wayne Jones writes Metaplanet Acquires 156 BTC, Bringing Total Holdings to 2,391
Bitcoin is up by a strong 7.5% today as the cryptocurrency grinds back toward the $60,000 level, this becomes even more impressive as Wall Street indices are down 1-2%. Decoupling? so far, so good.
Quick recap: BTC had reached a new ATH over the weekend as it hit $61,780 (Bitstamp) on Saturday. From there, it rolled over during the start of this week, whereas on Tuesday it hit the current weekly low at $53220. There, support was found upon an ascending trend line that started forming on February’s last day.
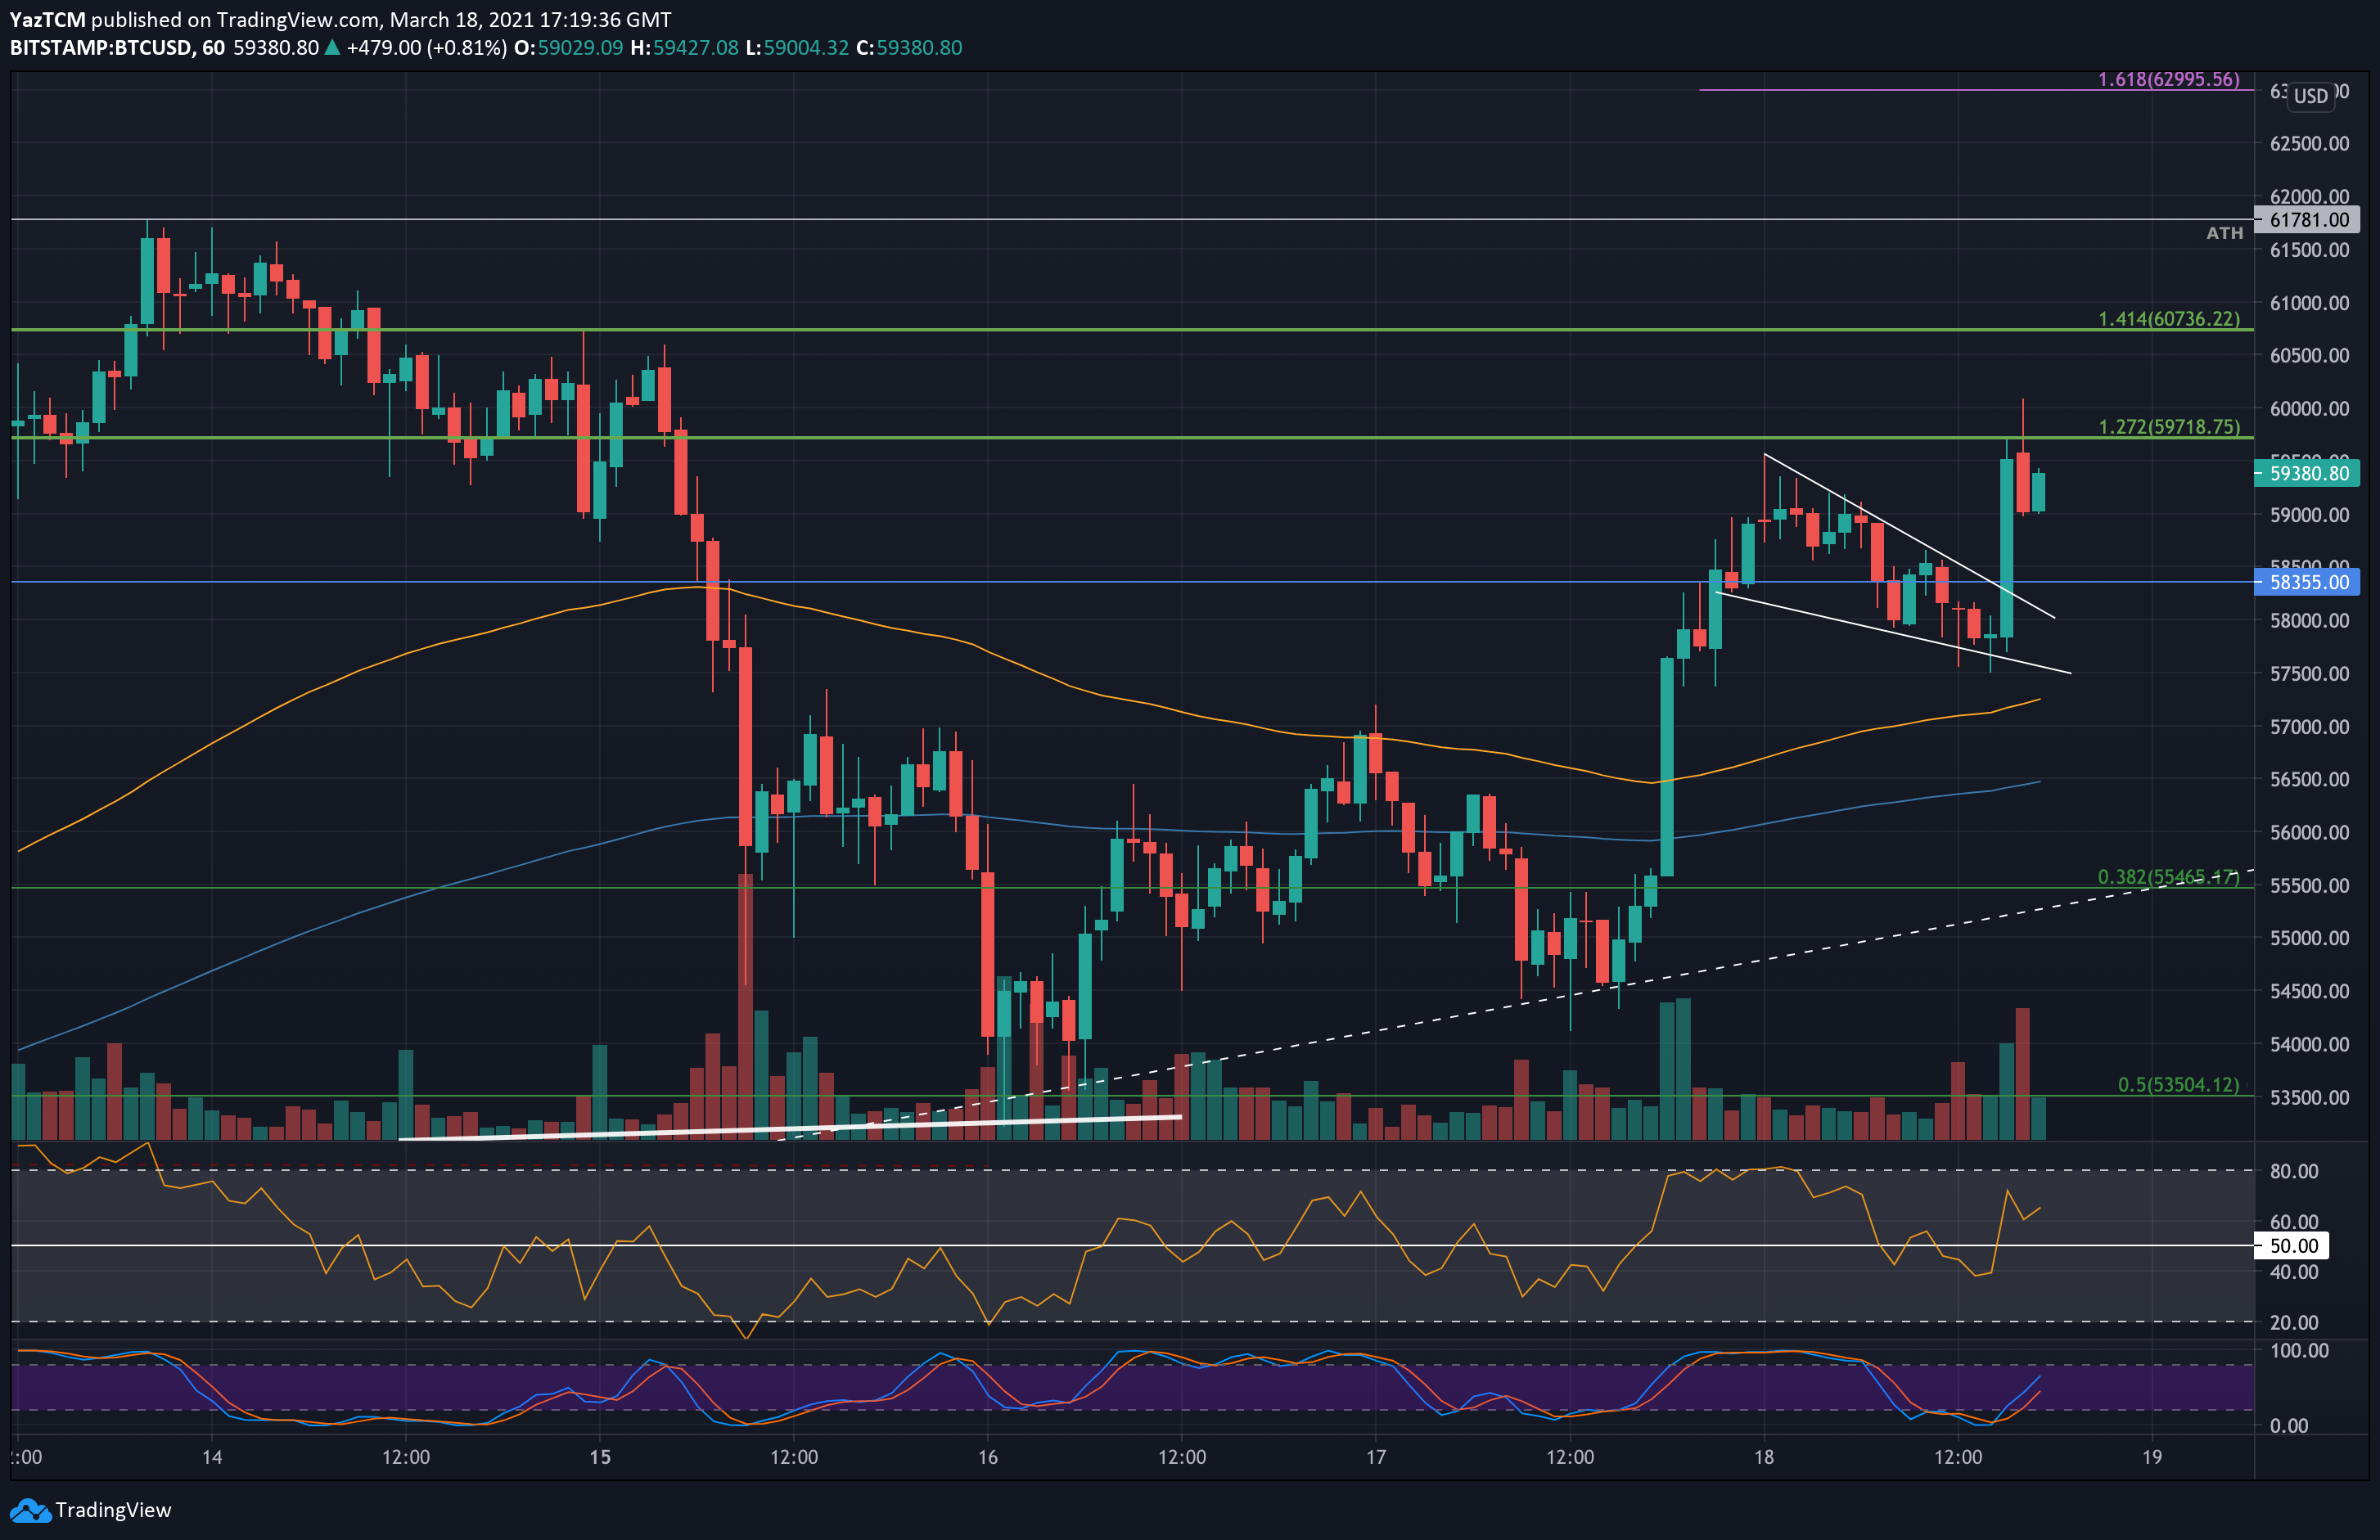
Looking at the short-term timeframe, over the past 24 hours Bitcoin was forming a falling wedge, as can be seen on the 1-hour chart below. The wedge pattern broke to the bullish side just shortly before writing this update.
Following the breakout, Bitcoin soared towards the $60k benchmark, recording $60,083 as the current daily high as of now, according to Bitstamp. Once the wedge was broken, the target is somewhere around the $61,200 area (the pole’s size).
BTC Price Support and Resistance Levels to Watch
Key Support Levels: $58,355, $57,500, $55,465, $53,500, $52,500.
Key Resistance Levels: $59,720 – $60,000, $60,735, $61,200, $61,781 (ATH).
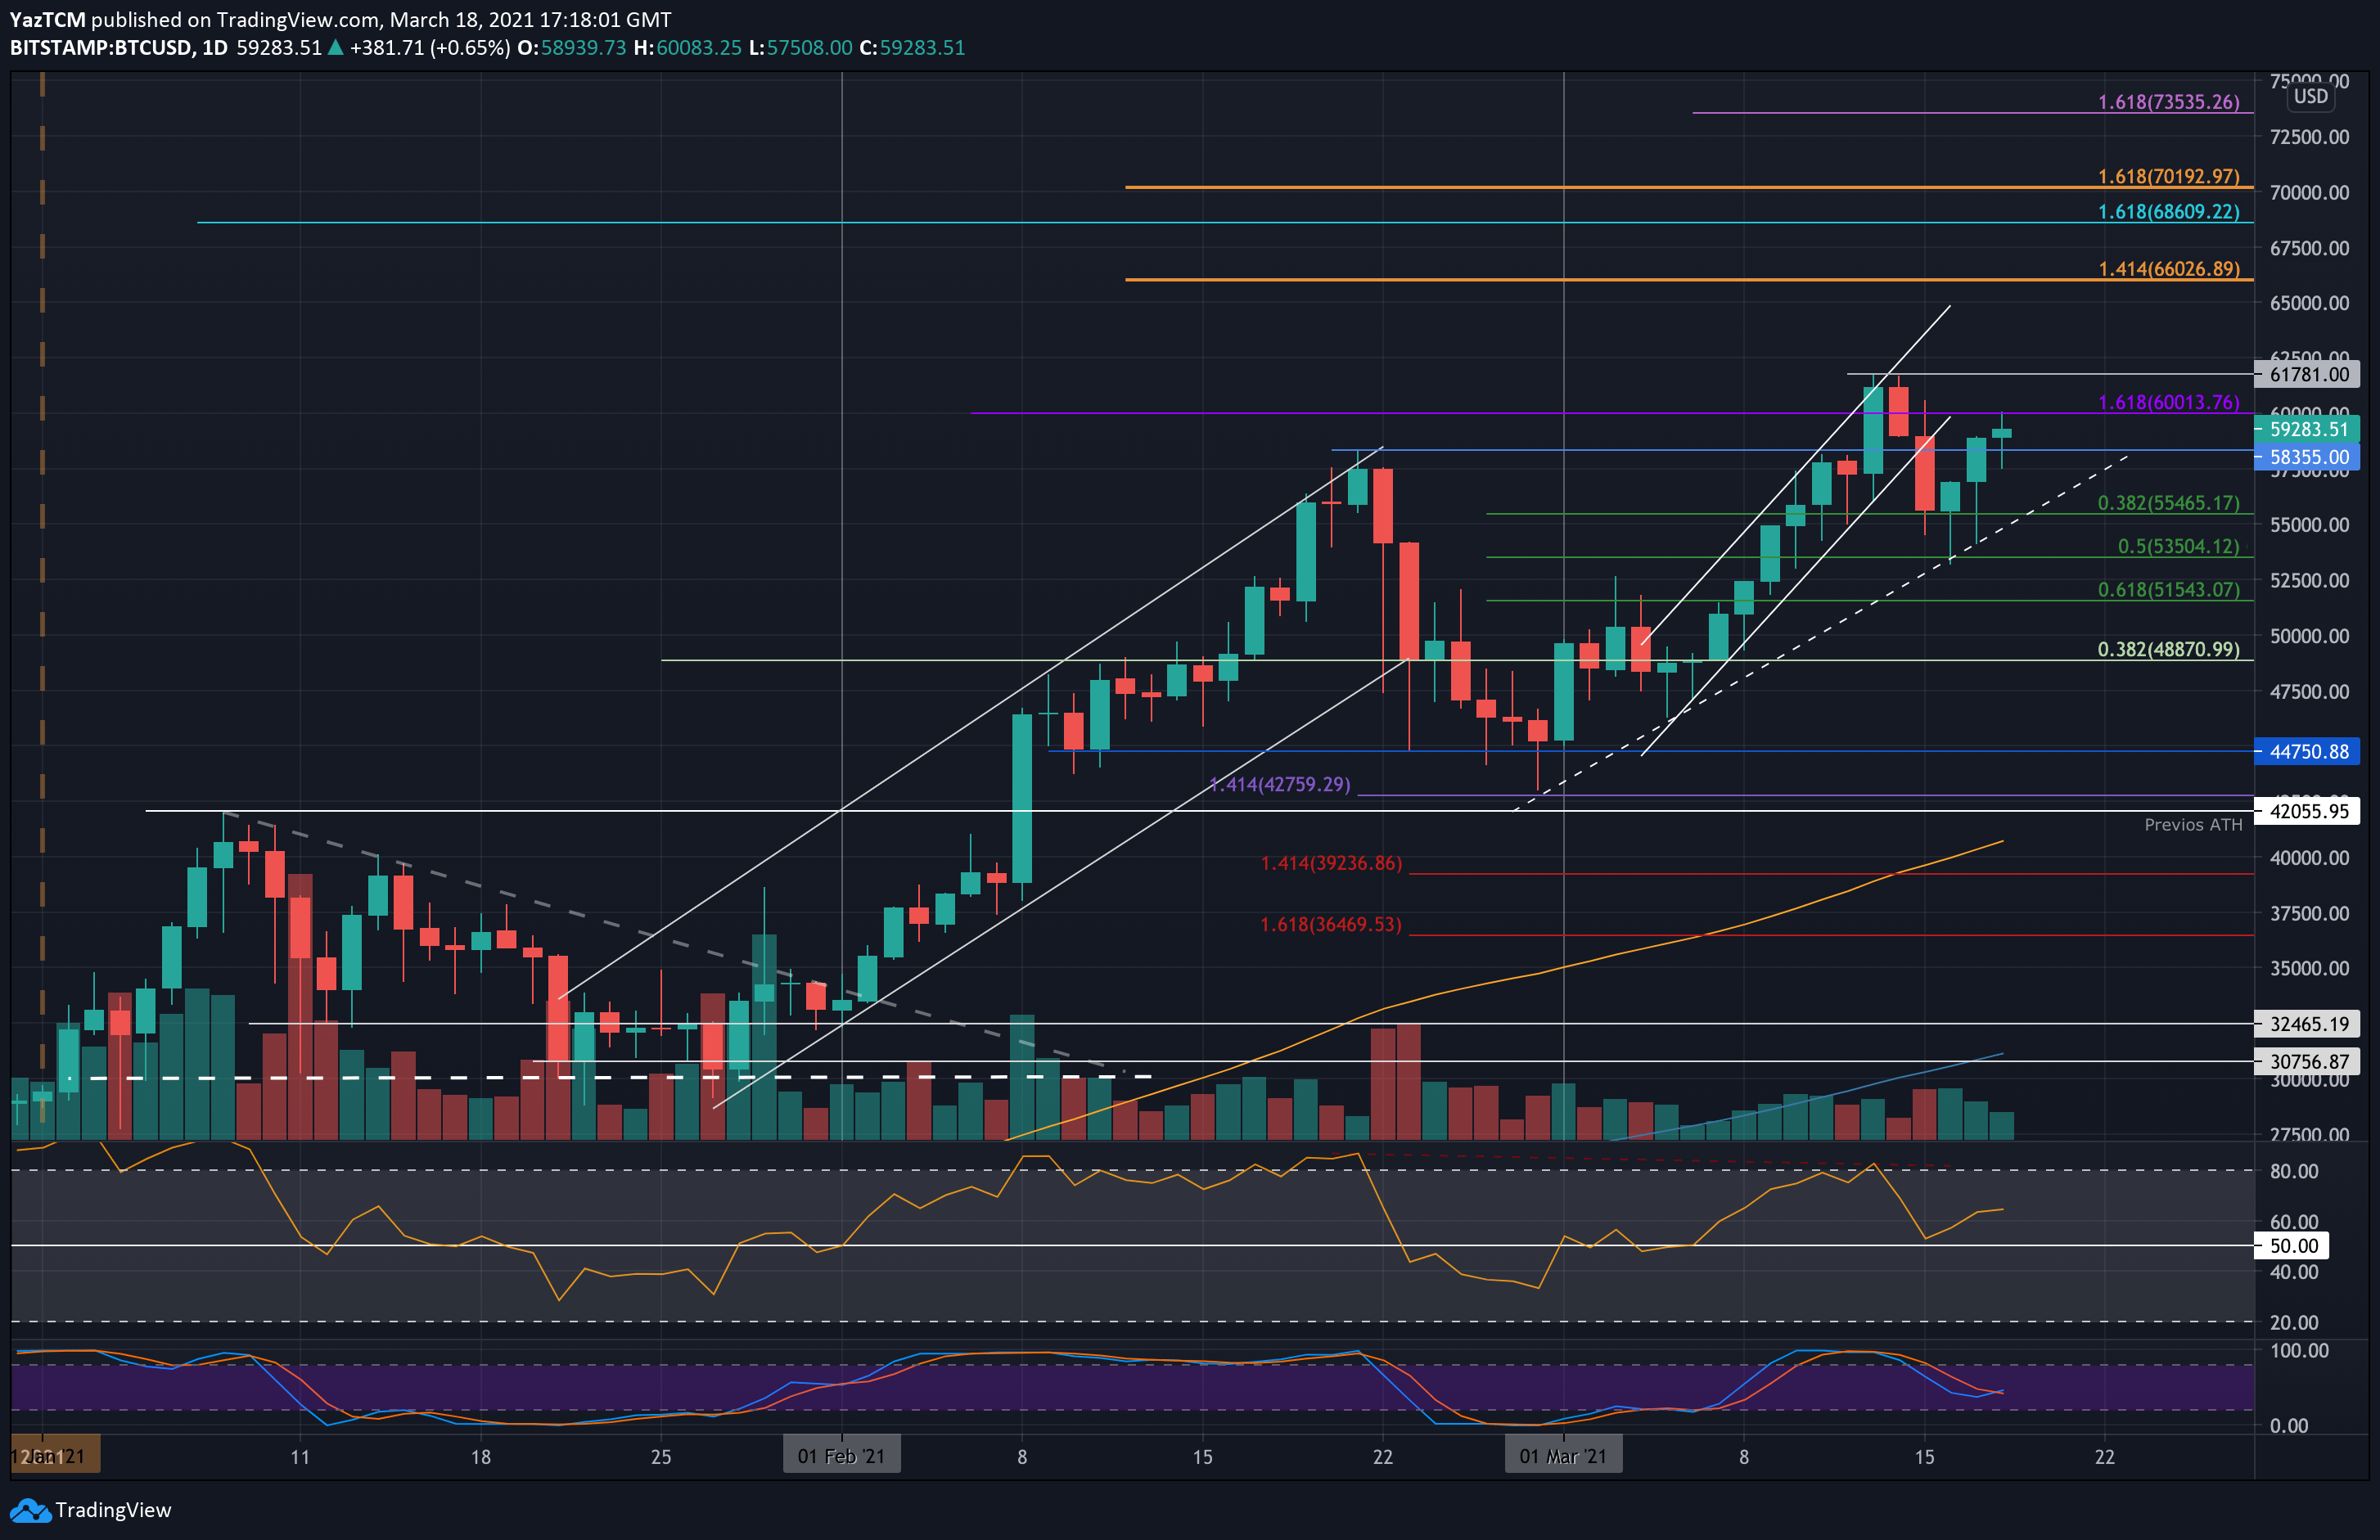
Looking ahead, the first level of resistance lies at $59,720 (short term 1.272 Fib Extension). This is closely followed by $60,000. Beyond $60,000, resistance lies at $60,735 (short term 1.414 Fib Extension), $61.2K, $61,780 (ATH), and $63,000.
On the other side, the first level of support lies at $58,355 (previous ATH). This is followed by $57,500, $55,465 (.382 Fib), the rising trend line, and $53,500 (.5 Fib). Added support lies at $52,500, $51,540 (.618 Fib), and $50,000.
The daily RSI is above the midline and is rising above 60. This indicates that the bullish momentum is picking up within the market.
Bitstamp BTC/USD Daily Chart
Bitstamp BTC/USD 1-Hour Chart