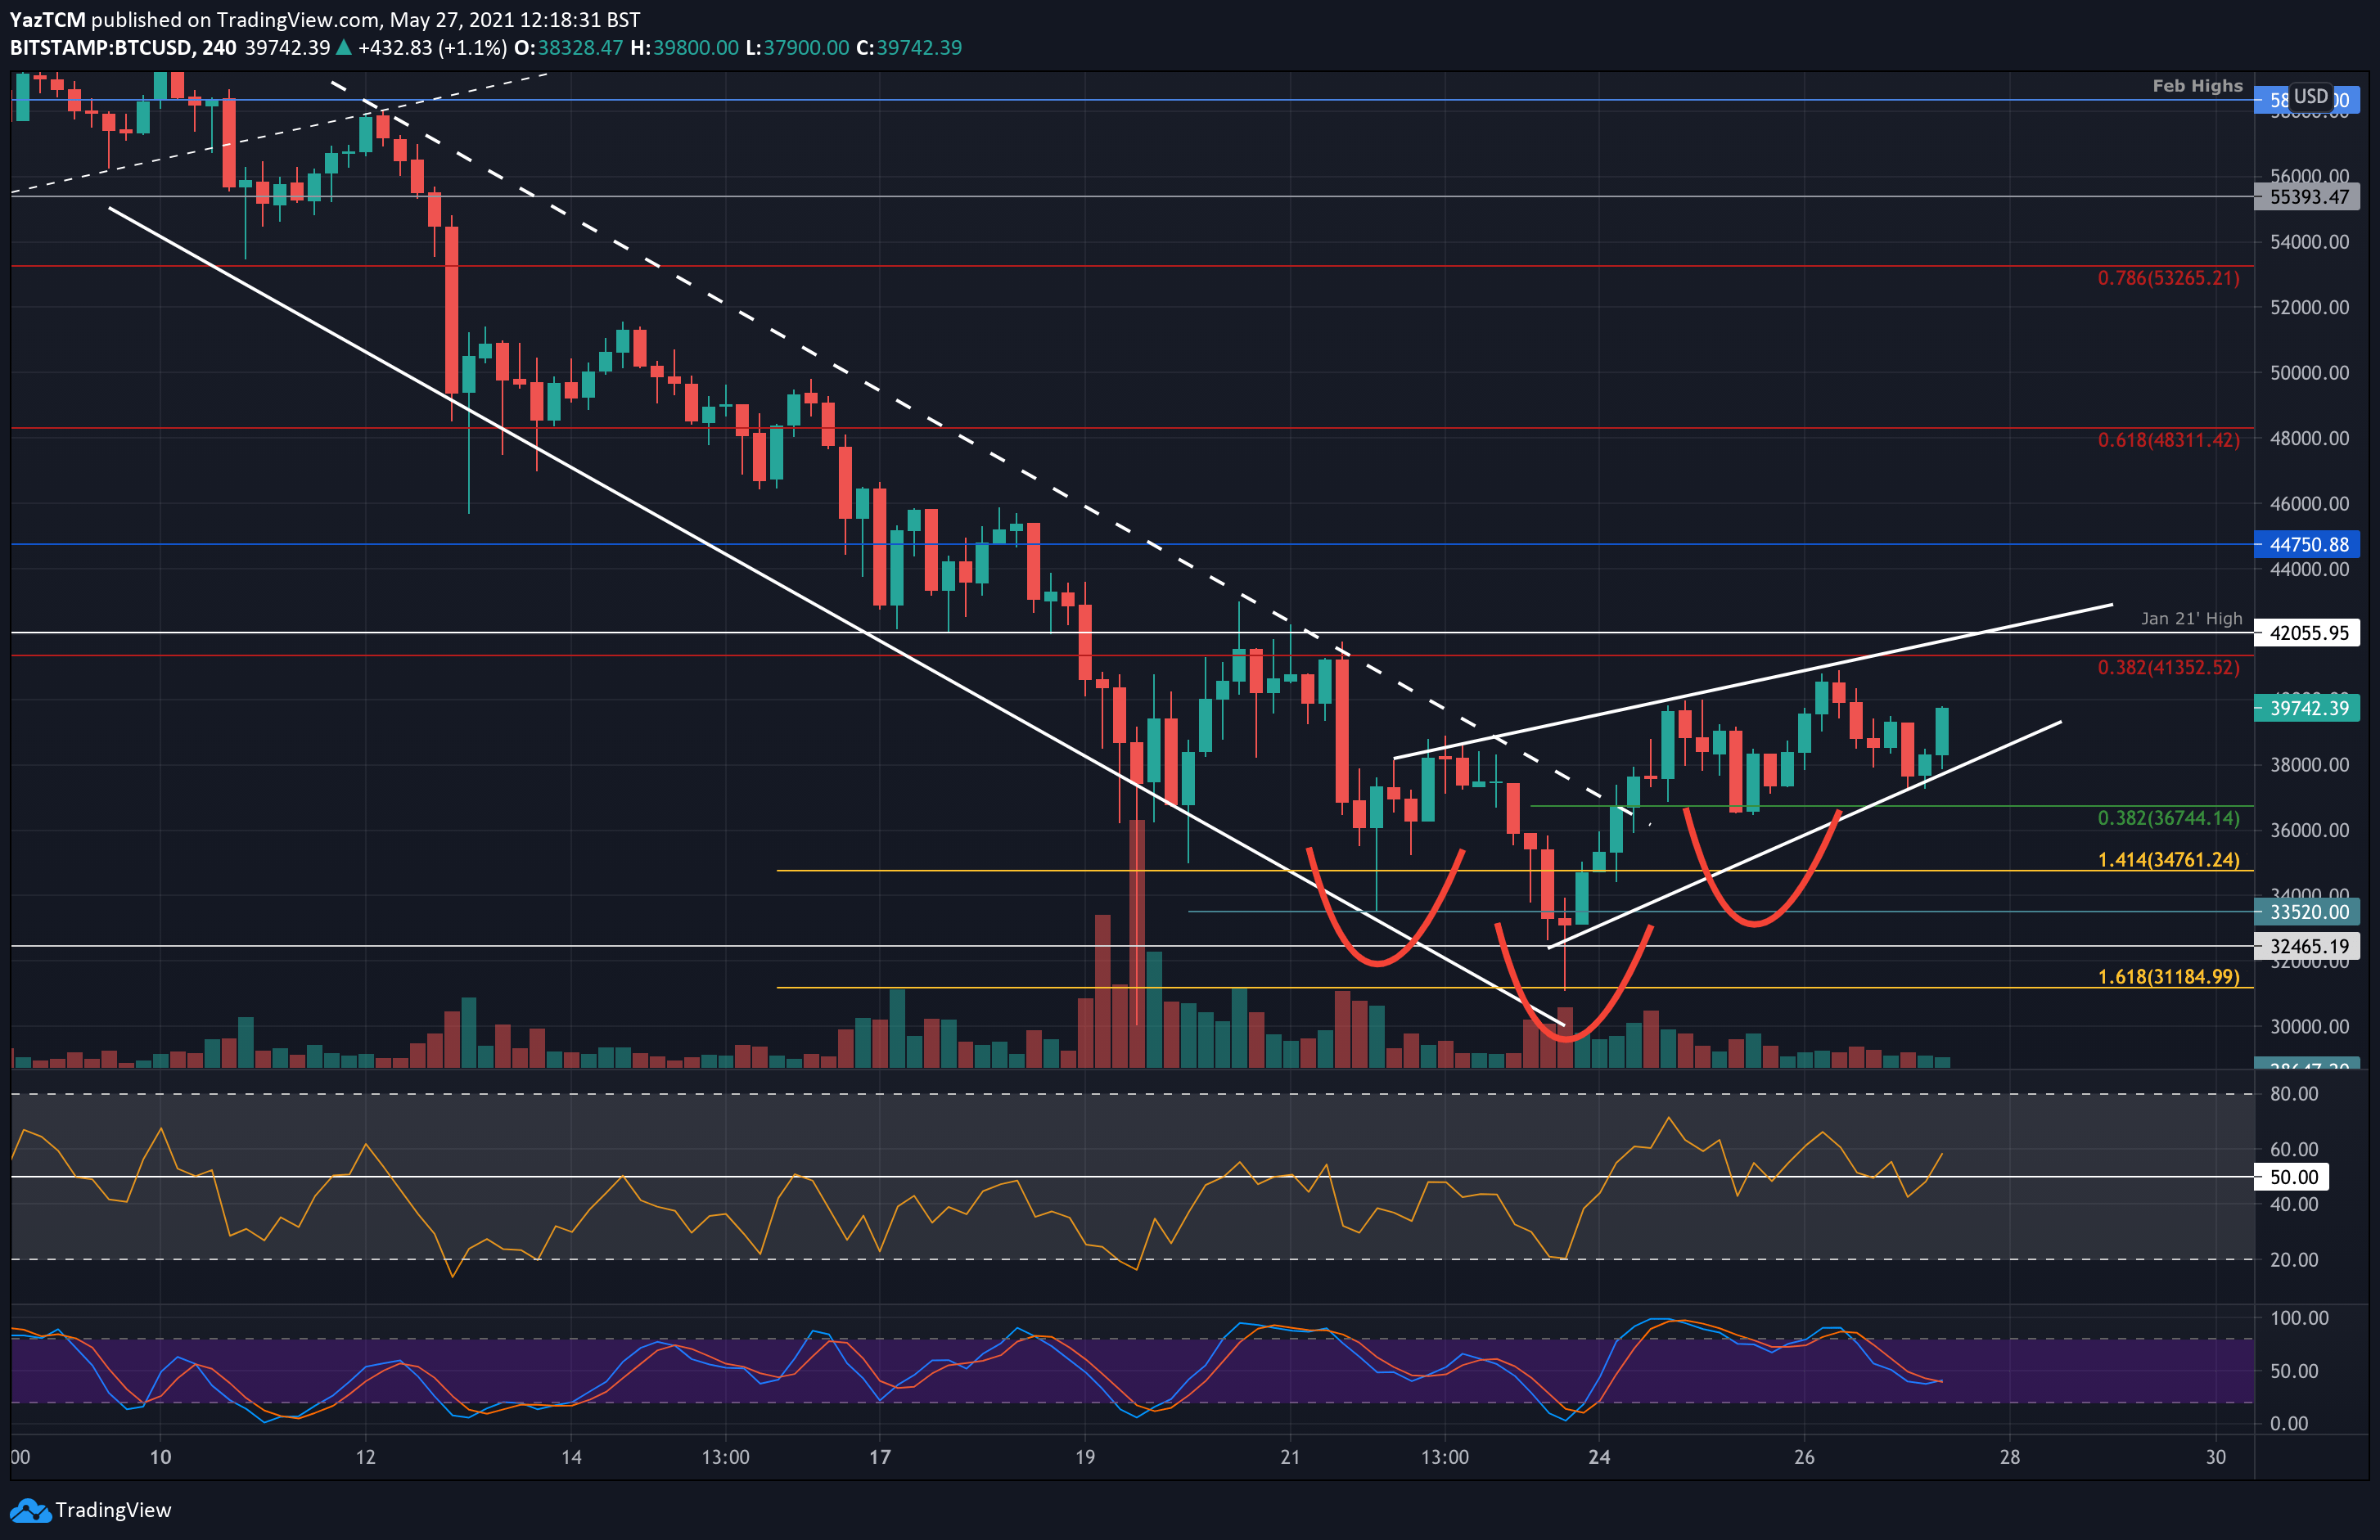
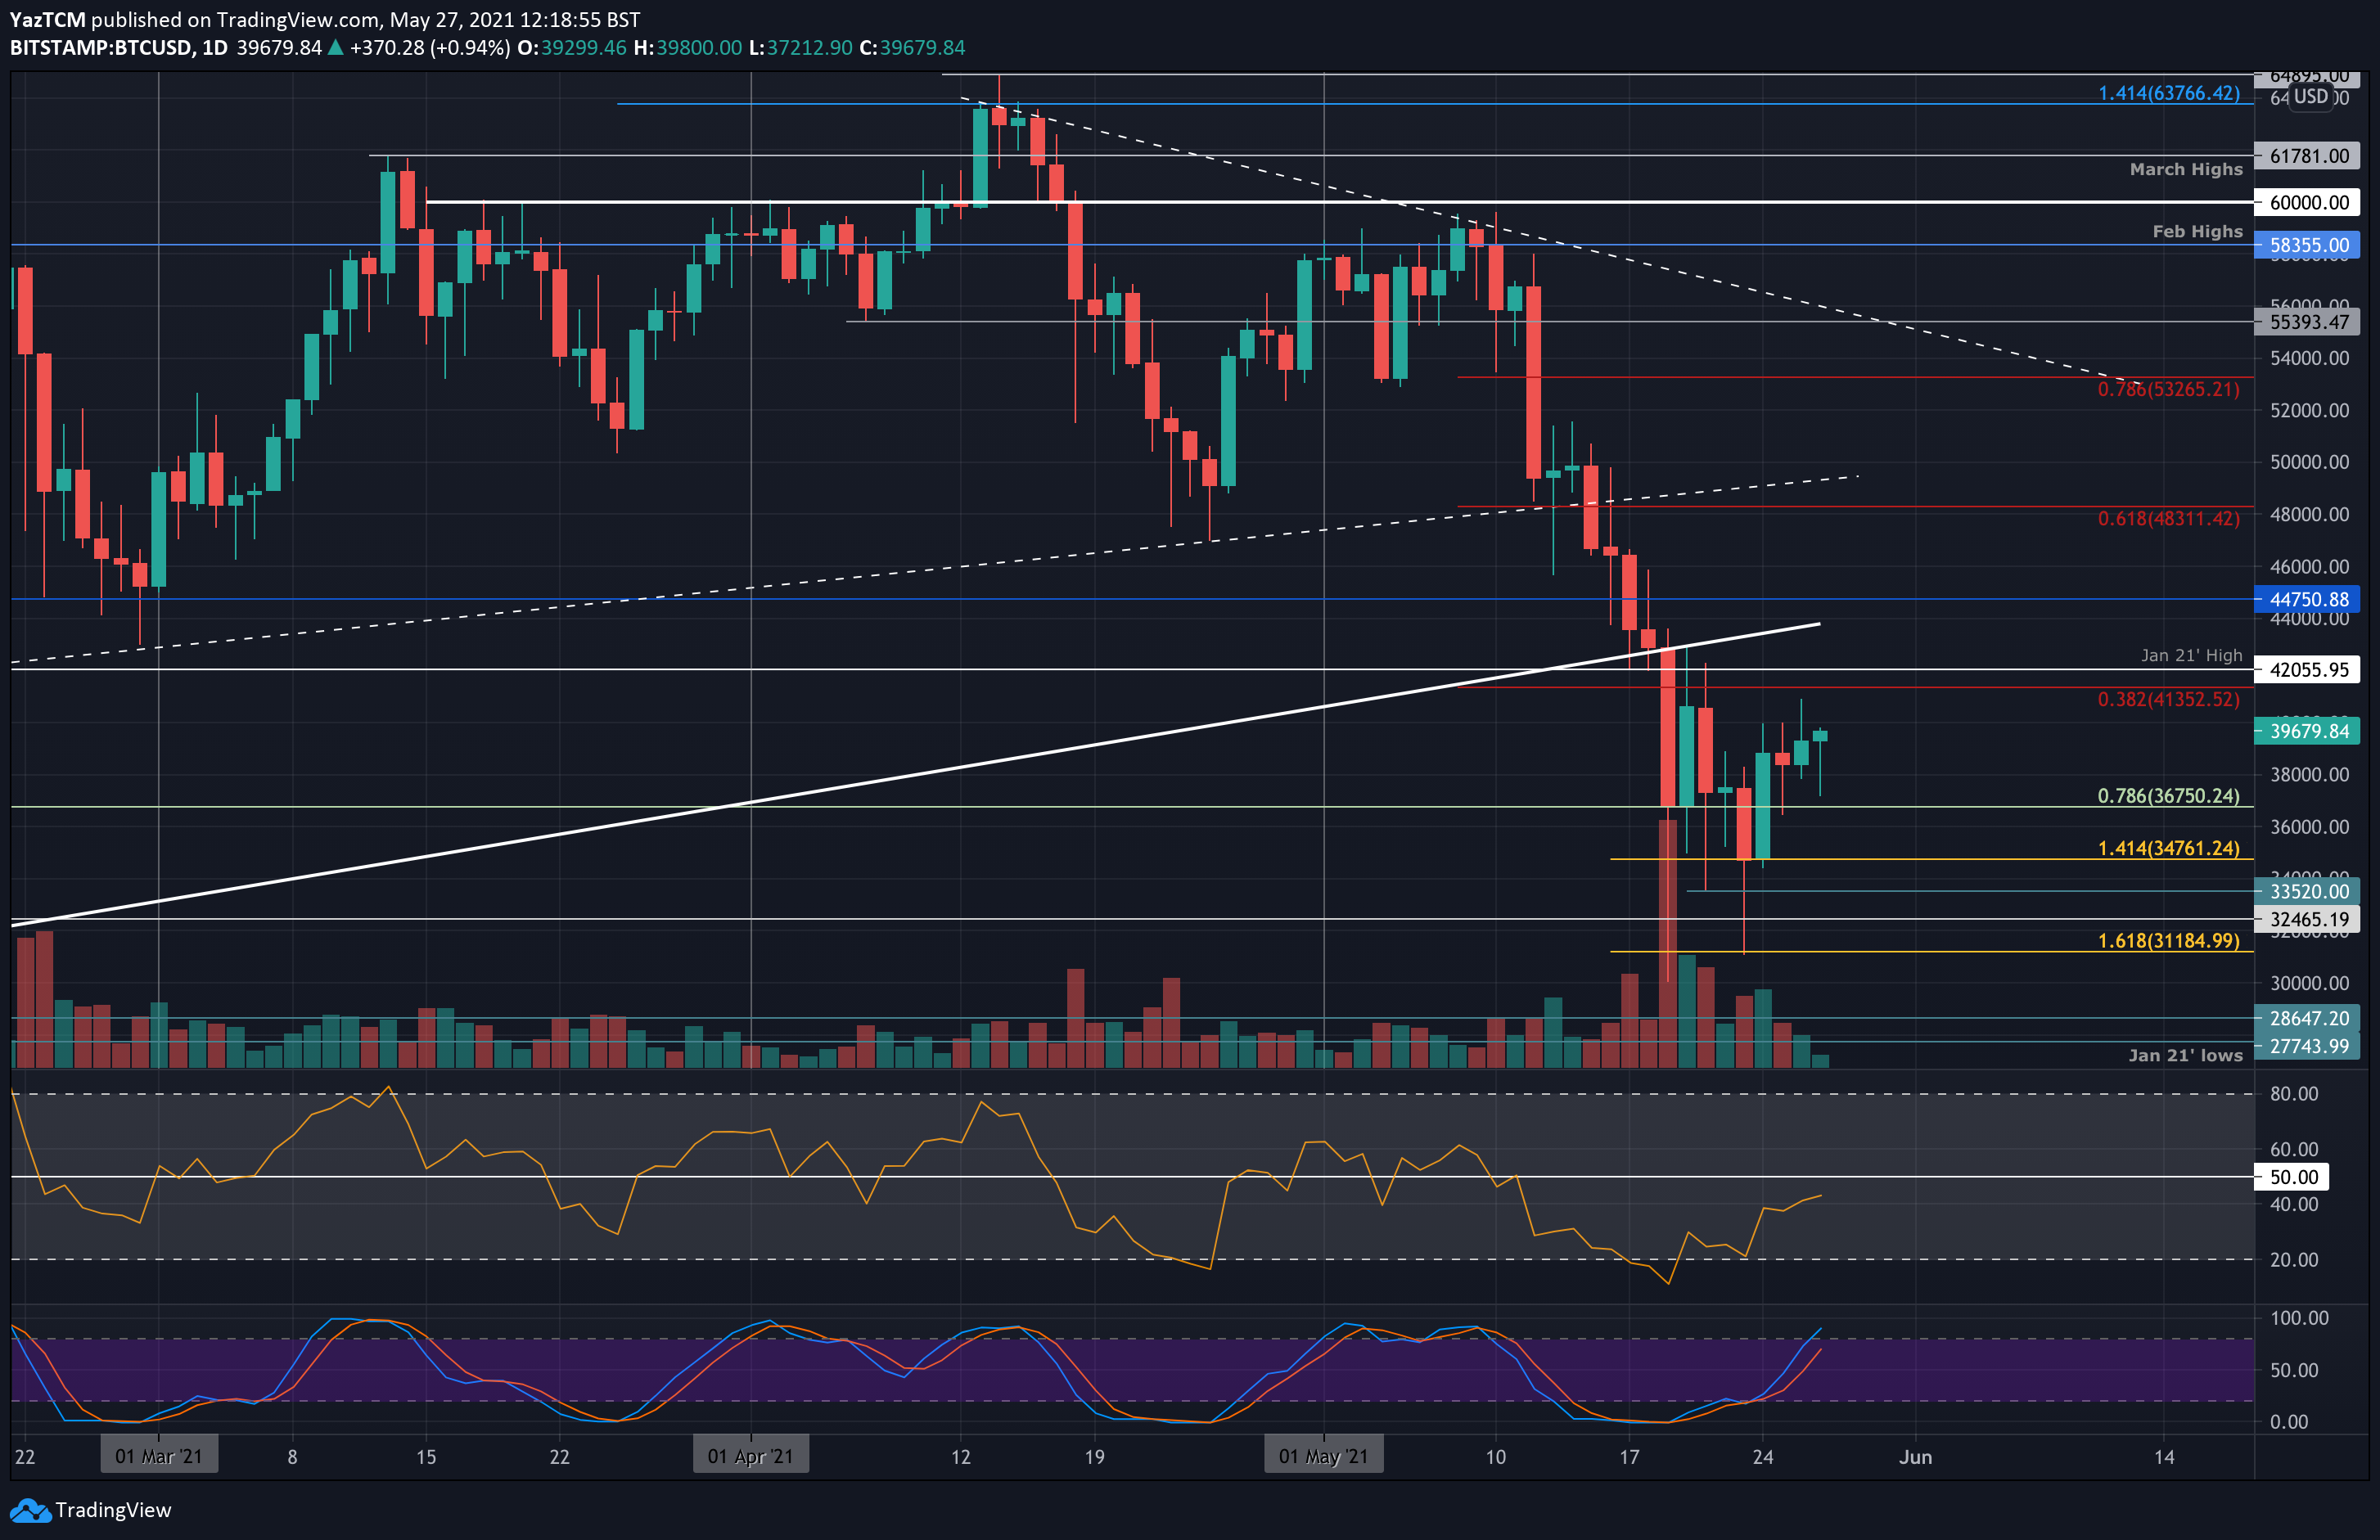
Bitcoin is now up 25% from Sunday’s low of ,100 as it is attempting to reach the K resistance level once again. Quick recap: following last Wednesday’s liquidation drop to K, the primary cryptocurrency recovered to K, just to plunge once again to ,100 on Sunday, but again – it quickly managed to recover. At the end of Sunday, it closed above ,760 (downside 1.414 Fib Extension). Since then, BTC managed to break above a descending price channel, as shown on the following 4-hour’s short-term chart. The bulls reached as high as ,000 yesterday but couldn’t sustain above, and dropped as low as ,300 earlier today. There they found support at the lower boundary of the same price channel. Looking ahead, the critical level stays the – K supply area,
Topics:
Yaz Sheikh considers the following as important: Bitcoin (BTC) Price, BTC Analysis, BTCEUR, BTCGBP, btcusd, btcusdt
This could be interesting, too:
Chayanika Deka writes XRP, SOL, and ADA Inclusion in US Crypto Reserve Pushes Traders on Edge
Chayanika Deka writes Why Arthur Hayes Is Bullish on Bitcoin Under Trump’s Economic Strategy
Mandy Williams writes Why the Bitcoin Market Is Stuck—and the Key Metric That Could Change It: CryptoQuant CEO
Wayne Jones writes Metaplanet Acquires 156 BTC, Bringing Total Holdings to 2,391
Bitcoin is now up 25% from Sunday’s low of $31,100 as it is attempting to reach the $40K resistance level once again.
Quick recap: following last Wednesday’s liquidation drop to $30K, the primary cryptocurrency recovered to $42K, just to plunge once again to $31,100 on Sunday, but again – it quickly managed to recover. At the end of Sunday, it closed above $34,760 (downside 1.414 Fib Extension).
Since then, BTC managed to break above a descending price channel, as shown on the following 4-hour’s short-term chart. The bulls reached as high as $41,000 yesterday but couldn’t sustain above, and dropped as low as $37,300 earlier today. There they found support at the lower boundary of the same price channel.
Looking ahead, the critical level stays the $40 – $42K supply area, which acts as a very strong resistance, including the 200-day moving average line (currently around $40.7K). This is the key level for the short term.
From the bullish side, the more attempts to break the latter resistance, the higher the chance it will finally break up. We had seen a few tries over the past few days.
In addition, there is an inverse head and shoulders pattern likely forming on the short-term charts that would send the market to a target of around $49,000 if the neckline is broken. The neckline is the same angle as the upper boundary of the current bullish wedge in play (shown on the following 4-hour chart).
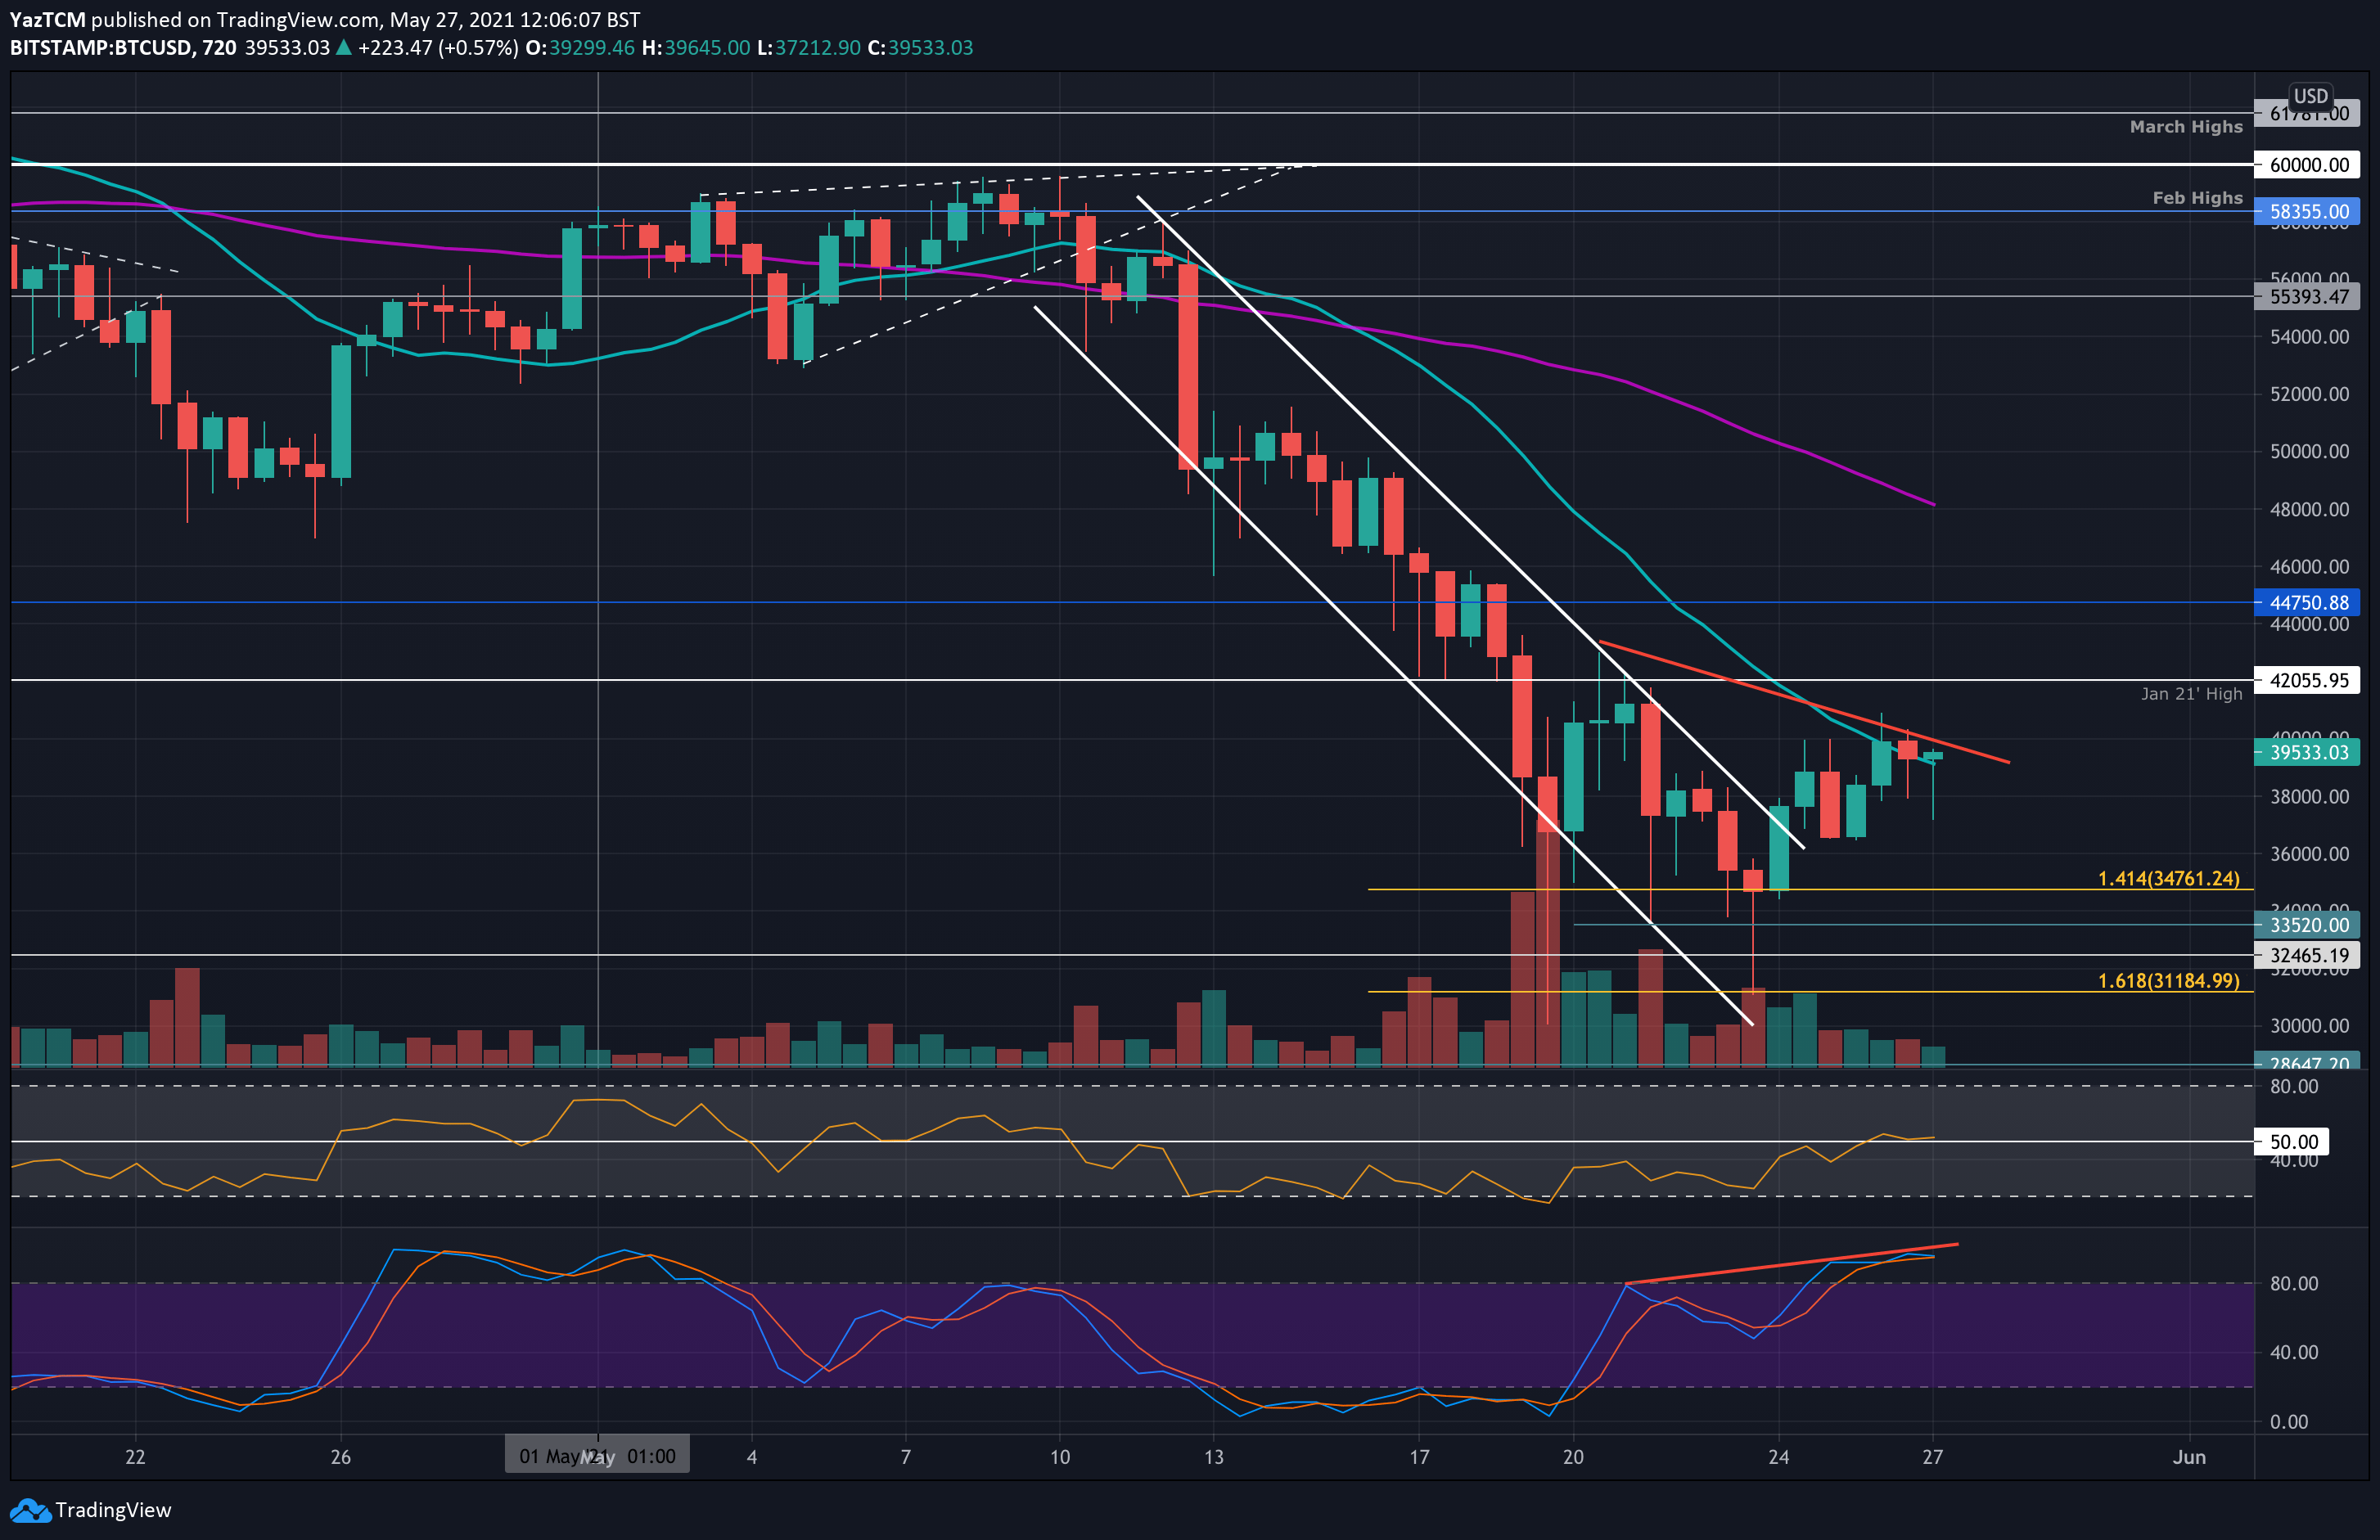
From a bearish perspective, there are hints of hidden bearish divergence that can be seen on the 12-hour chart below. The RSI is making a higher high while the price is failing to do so. If this plays out, BTC could head beneath the current short-term wedge that it is trading within. This supports the fact that Bitcoin is facing a huge level of resistance ($40-42K).
BTC Price Support and Resistance Levels to Watch
Key Support Levels: $38,000, $36,750, $34,760, $33,520, $32,465.
Key Resistance Levels: $40,000, $41,000-$41,350, $42,000, $44,750, $46,815.
Looking ahead, the first resistance lies at $40,000. This is followed by $41,000-$41,350 (200-day MA & bearish .382 Fib) and $42,000 (Jan 2021 highs & upper boundary of the short term wedge. If the buyers break above the wedge, additional resistance lies at $44,750, $46,815 (100-day MA), and $48,310 (bearish .618 Fib).
On the other side, the first support lies at $38,000 (lower boundary of short-term wedge). This is followed by $36,750 (.786 Fib), $34,760 (downside 1.414 Fib Extension), $33,520, and $32,465.
The RSI is slowly grinding higher, indicating the extreme bearish momentum seen last week is starting to fade as buyers enter the market.
However, as mentioned above, there is a hint of hidden bearish divergence that is starting to form as the RSI makes higher highs with prices not following. The hidden bearish divergence might lead to a break back toward the Sunday closing price if this plays out.
Bitstamp BTC/USD Daily Chart
Bitstamp BTC/USD 12-Hour Chart
Bitstamp BTC/USD 4-Hour Chart