The Bitcoin whipsaw continues as it failed to break the marked bearish triangle’s upper angle and immediately dropped by 00 to hit the ,500 support, provided by a .382 Fibonacci Retracement level.The outlook for Bitcoin looked promising on Friday following the tweet by Elon Musk. BTC price managed to break out to the bullish side of the descending triangle pattern. However, this breakout was short-lived and turned into a fake-out as the coin failed to close a 4-hour candle above ,200. This sent Bitcoin crashing back into the triangle yesterday.Today, the momentum hadn’t changed, as Bitcoin started the day by attempting to break the triangle’s upper angle, at around ,200, but could not sustain. As a result, Bitcoin went on to drop beneath the ,000 level and continued as low
Topics:
Yaz Sheikh considers the following as important: Bitcoin (BTC) Price, BTC Analysis, BTCEUR, BTCGBP, btcusd, btcusdt
This could be interesting, too:
Chayanika Deka writes XRP, SOL, and ADA Inclusion in US Crypto Reserve Pushes Traders on Edge
Chayanika Deka writes Why Arthur Hayes Is Bullish on Bitcoin Under Trump’s Economic Strategy
Mandy Williams writes Why the Bitcoin Market Is Stuck—and the Key Metric That Could Change It: CryptoQuant CEO
Wayne Jones writes Metaplanet Acquires 156 BTC, Bringing Total Holdings to 2,391
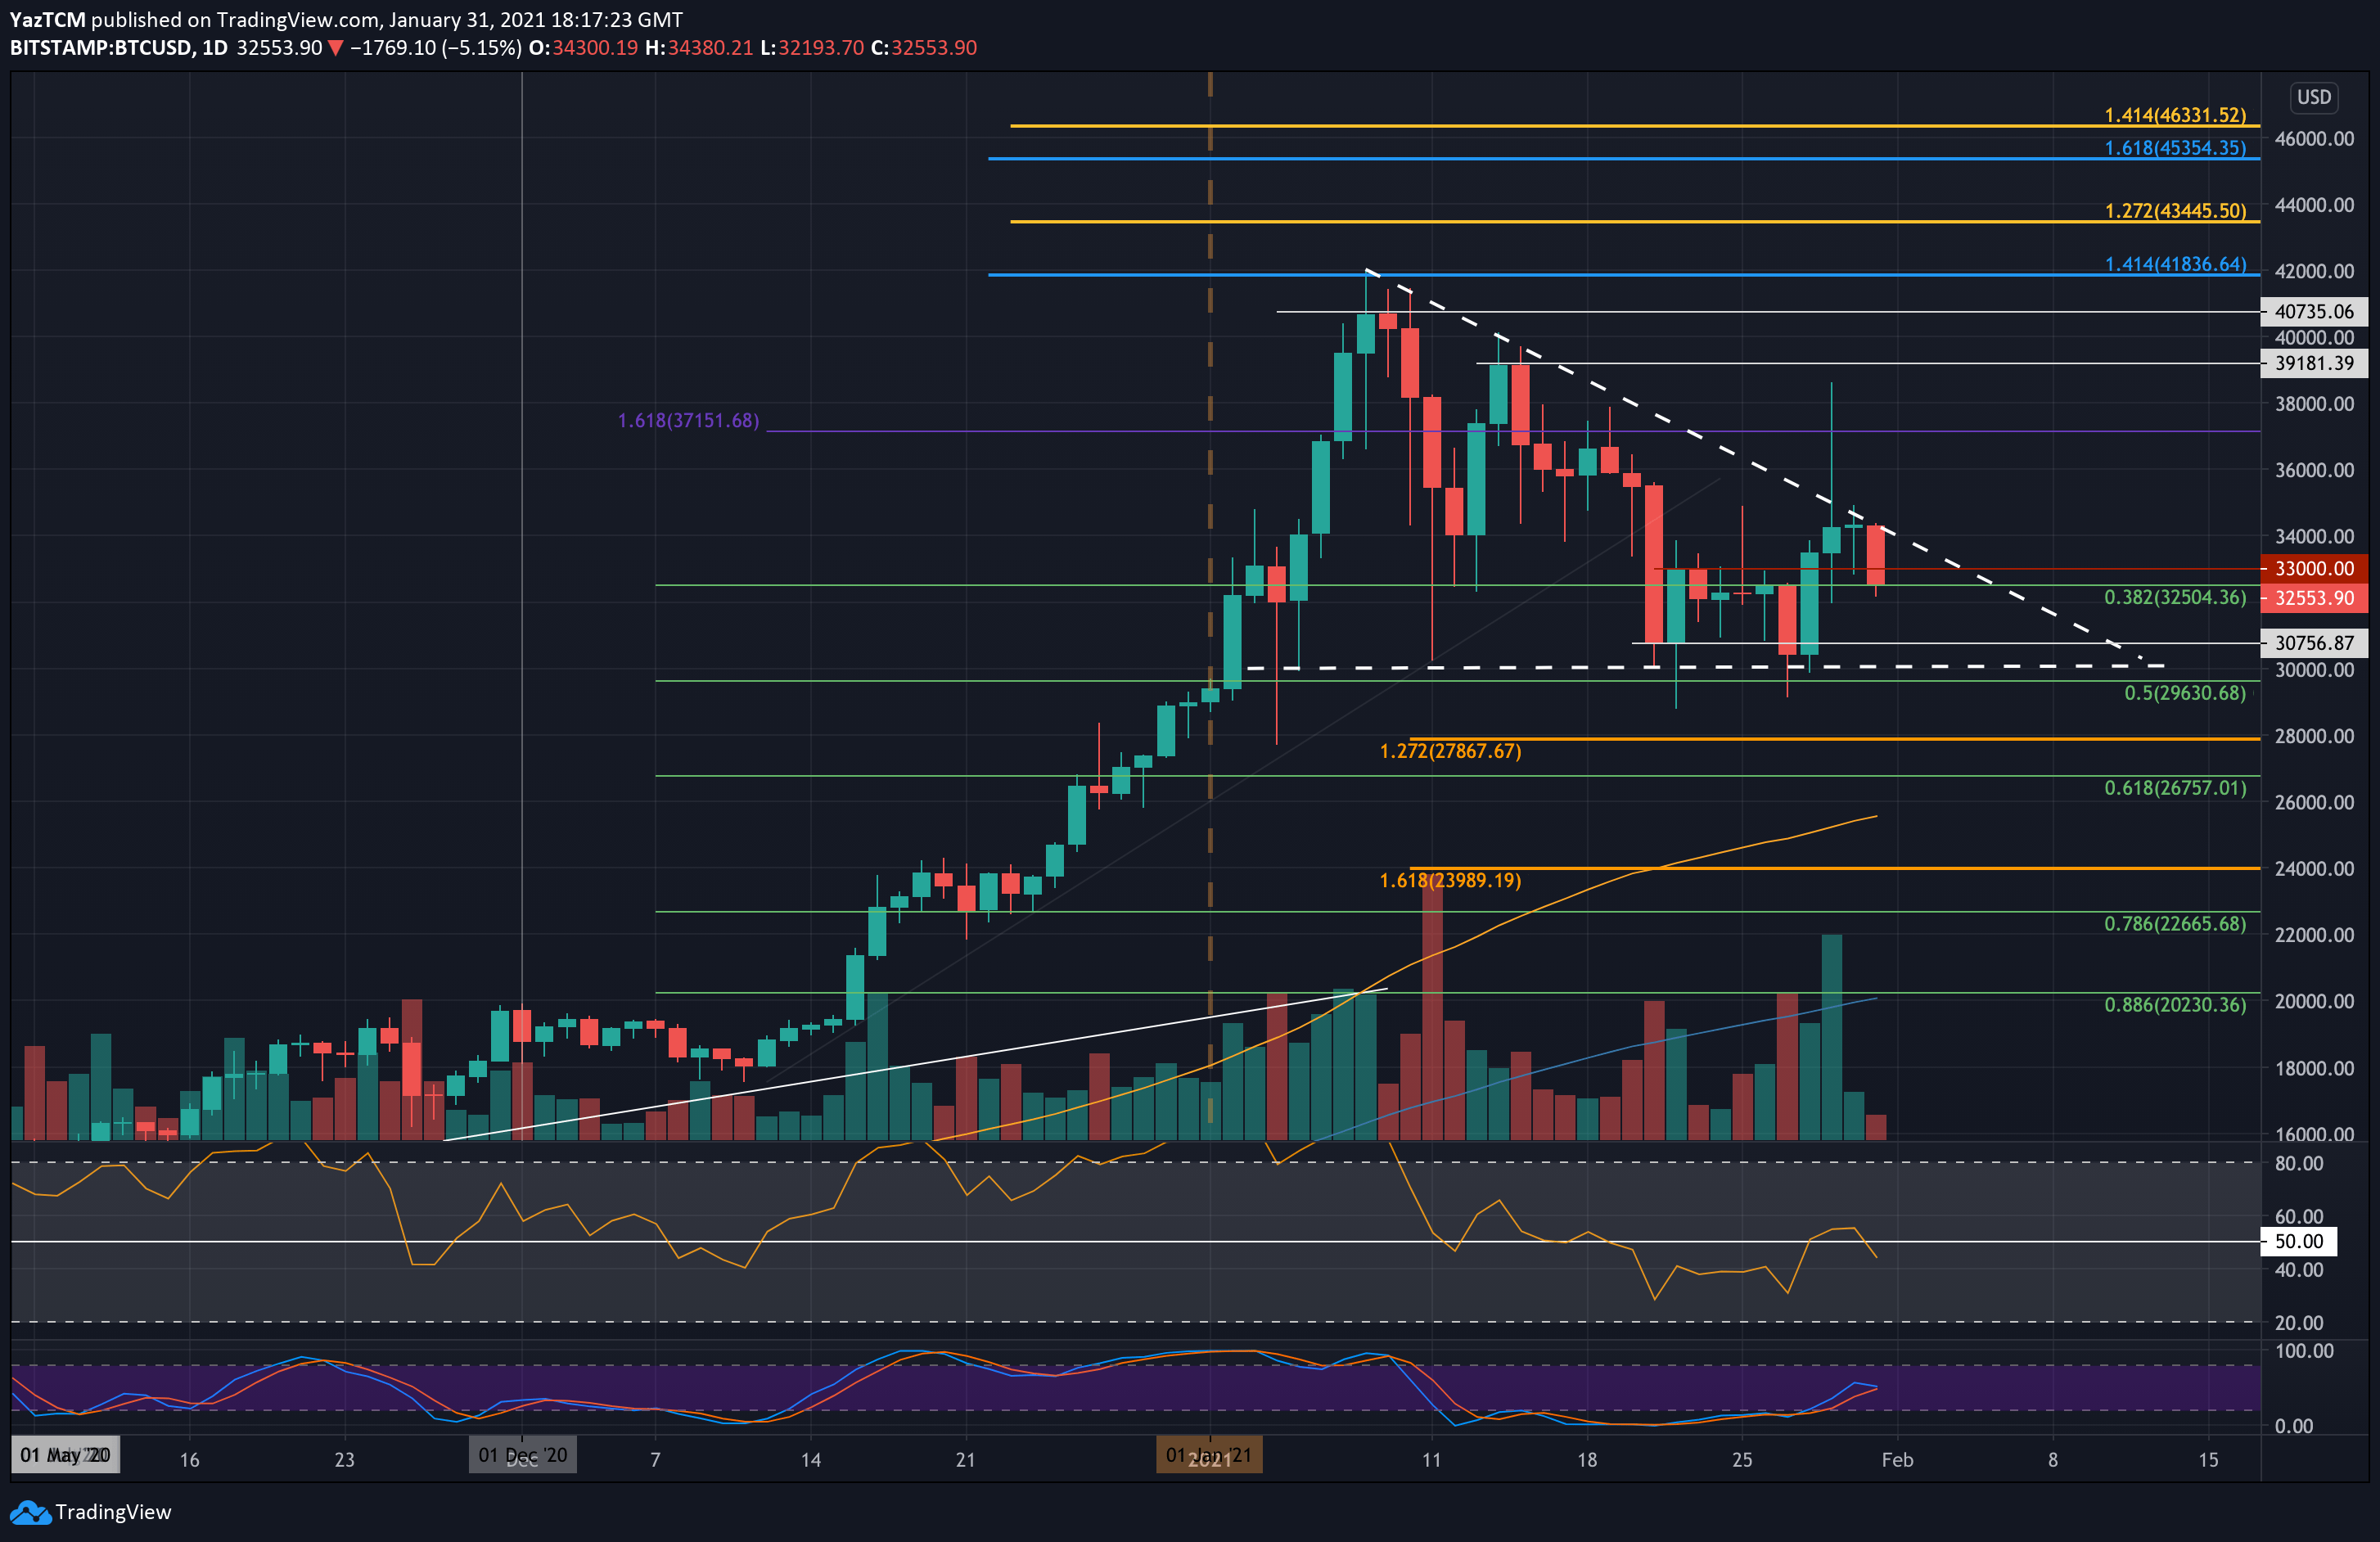
The Bitcoin whipsaw continues as it failed to break the marked bearish triangle’s upper angle and immediately dropped by $2000 to hit the $32,500 support, provided by a .382 Fibonacci Retracement level.
The outlook for Bitcoin looked promising on Friday following the tweet by Elon Musk. BTC price managed to break out to the bullish side of the descending triangle pattern. However, this breakout was short-lived and turned into a fake-out as the coin failed to close a 4-hour candle above $37,200. This sent Bitcoin crashing back into the triangle yesterday.
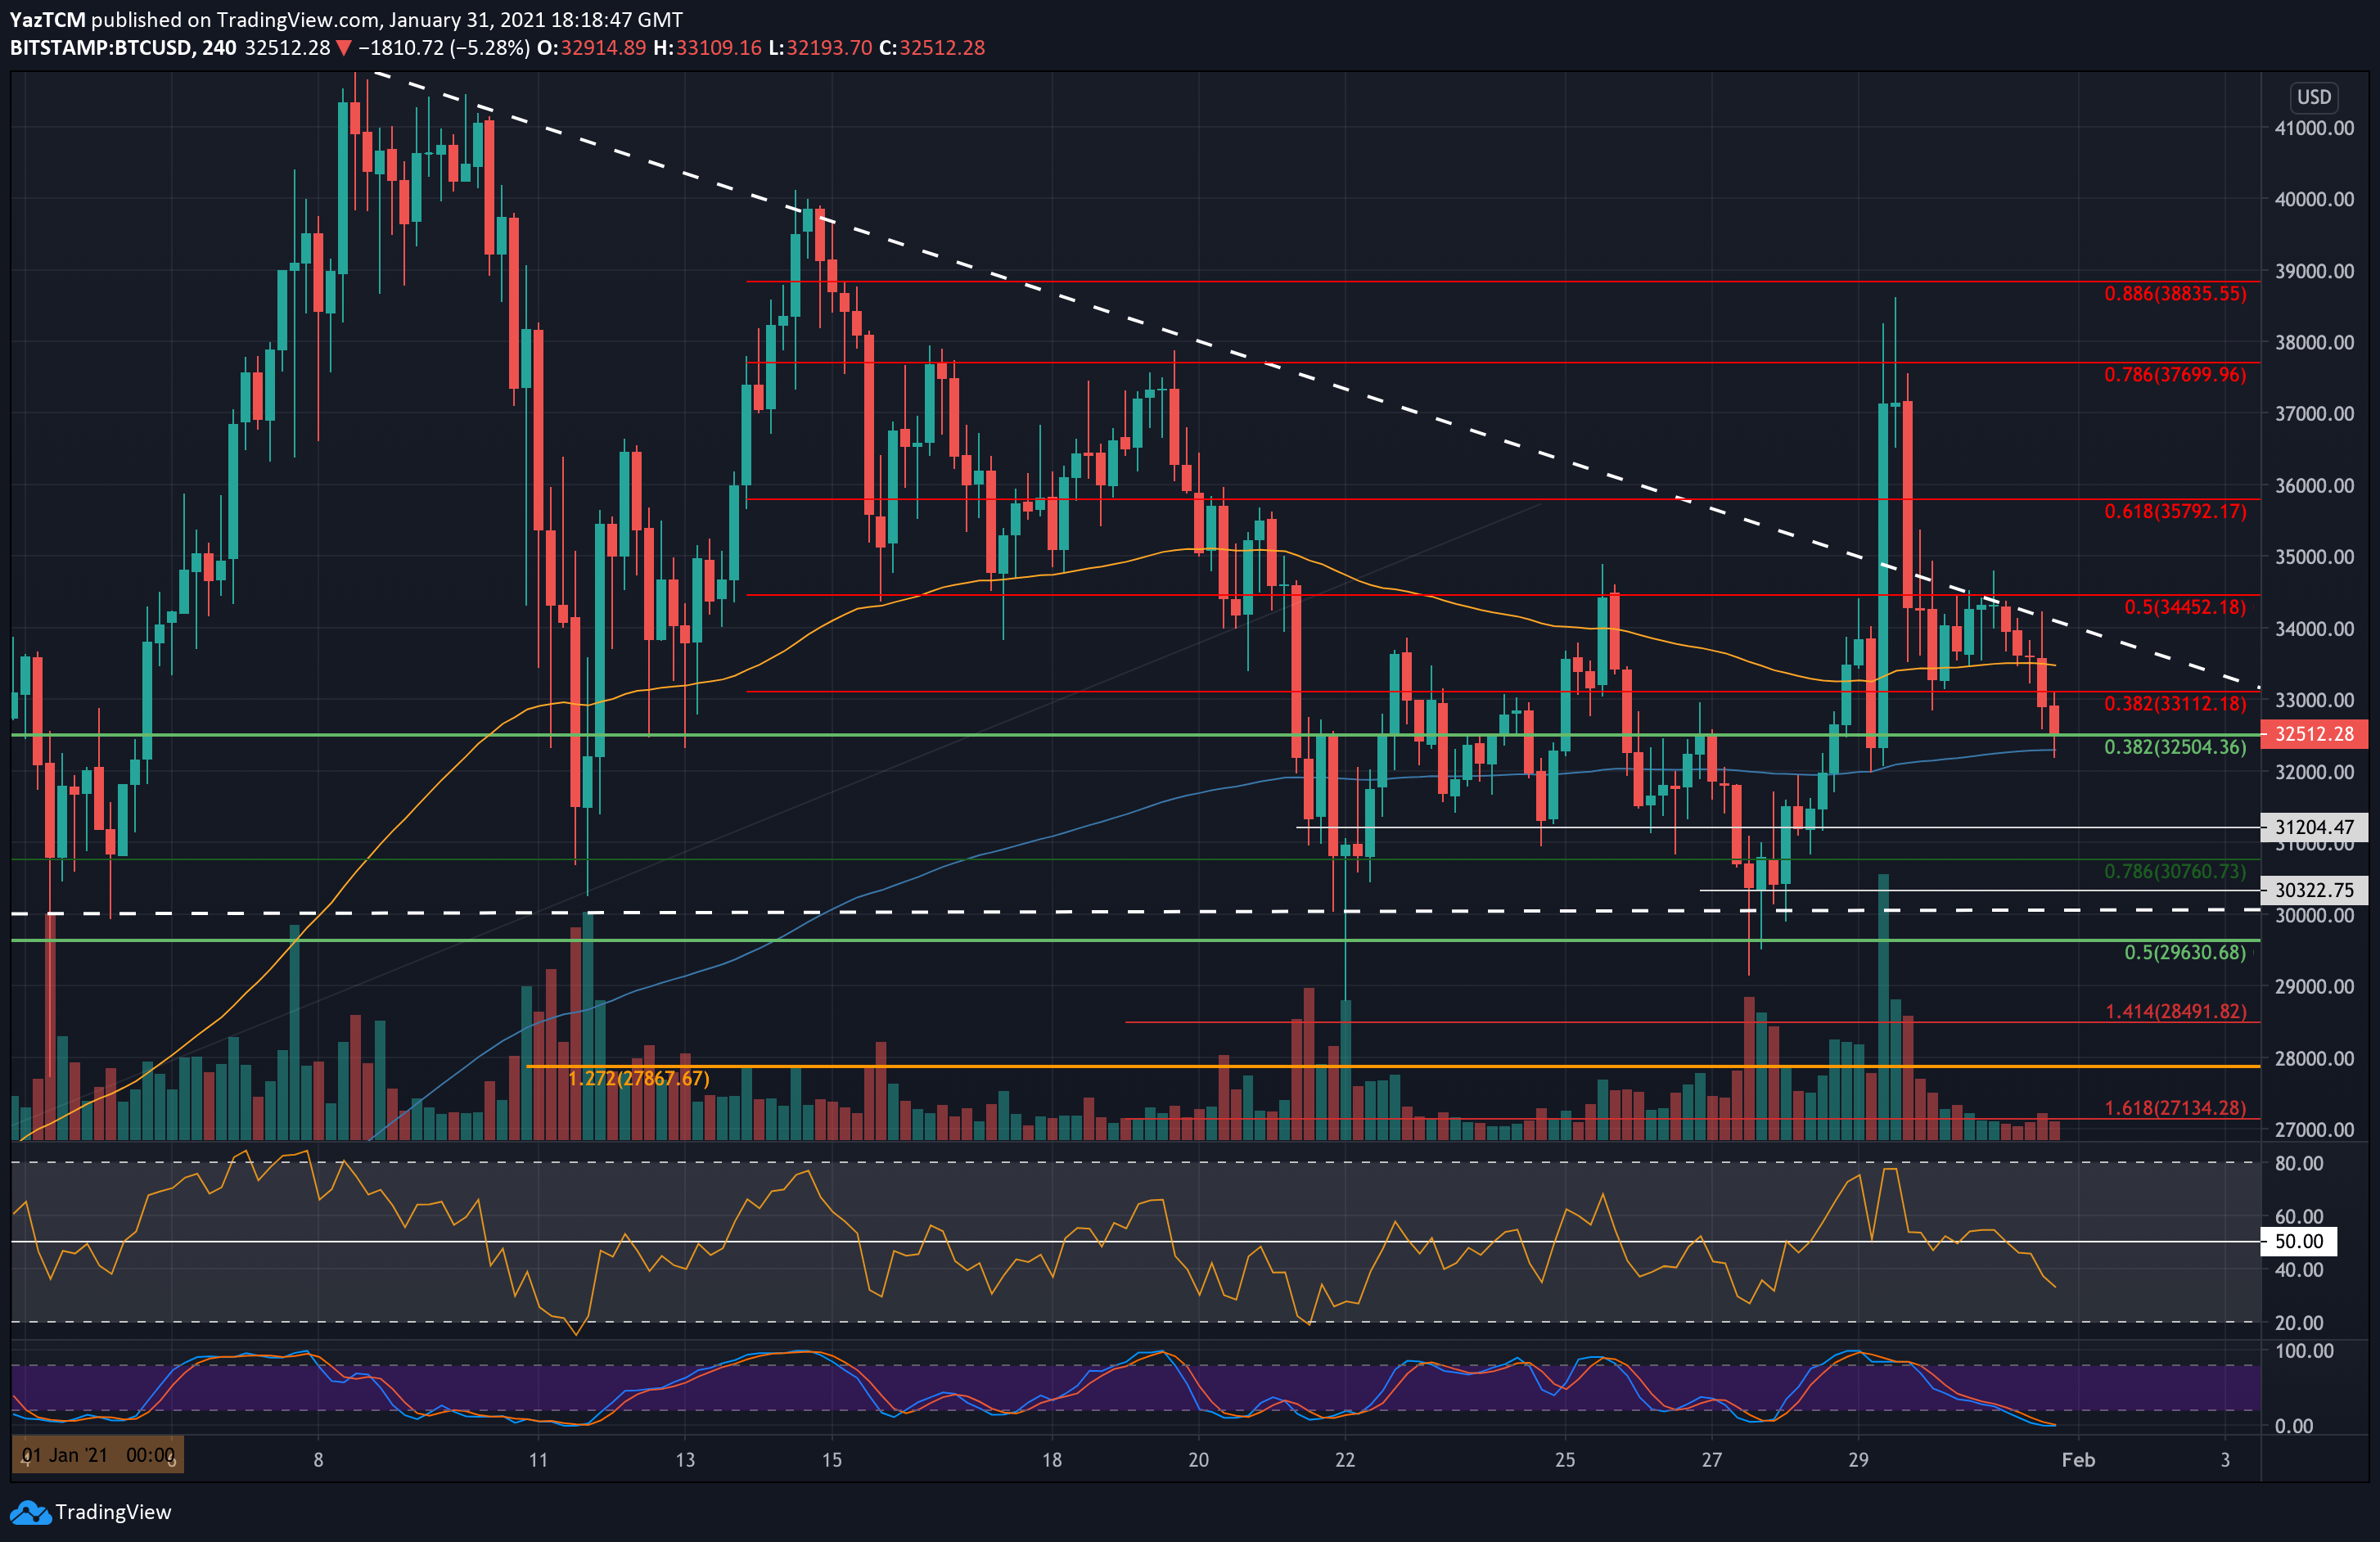
Today, the momentum hadn’t changed, as Bitcoin started the day by attempting to break the triangle’s upper angle, at around $34,200, but could not sustain. As a result, Bitcoin went on to drop beneath the $33,000 level and continued as low as $32,190, as of writing these lines.
BTC Price Support and Resistance Levels to Watch
Key Support Levels: $32,500, $32,000, $31,200, $30,760, $30,322.
Key Resistance Levels: $33,110, $34,000, $34,450, $35,000, $35,790.
Moving forward, if the selling continues beneath $32,500, the first support lies at $32,000. This is followed by $31,200, $30,760 (short term .786 Fib and the 50-day moving average line), $30,322, and $30,000 (the base of the triangle).
On the other side, the first resistance now lies at $33,110 (bearish .382 Fib). This is followed by $34,000 (upper angle of the triangle, where Bitcoin failed to break today along with 4-hour’s MA-200), $34,450 (bearish .5 Fib), and $35,000.
Targets above $35,000 lie at $35,790 (bearish .618 Fib), $36,000, and $37,1000.
The daily RSI has continued beneath the midline, indicating that the bearish momentum is starting to gain momentum. If it continues lower, Bitcoin can easily find itself retesting the triangle’s lower angle at around $30K.
Bitstamp BTC/USD Daily Chart
Bitstamp BTC/USD 4-Hour Chart