Bitcoin price is up by another 6% today, as the cryptocurrency finally reclaims ,000. Earlier today the cryptocurrency reached over ,300 (Bitstamp), but quickly retraced from there down to the K area. So far, this reflects a 2-day price gain of over 00 since Friday’s low of ,400.Quick recap: Bitcoin price started to scale at the beginning of March but couldn’t overcome the resistance around ,500 at the Golden Ratio (bearish .618 Fib) earlier this week. From there, it started to lose momentum until support was met at ,200 (.382 Fib) on Friday.Not a coincidence, there seems to be increased demand from institutions beneath ,000. Data shows massive outflows from Coinbase when the price action was around K – K, indicating that institutions are doubling down on
Topics:
Yaz Sheikh considers the following as important: Bitcoin (BTC) Price, BTC Analysis, BTCEUR, BTCGBP, btcusd, btcusdt
This could be interesting, too:
Chayanika Deka writes XRP, SOL, and ADA Inclusion in US Crypto Reserve Pushes Traders on Edge
Chayanika Deka writes Why Arthur Hayes Is Bullish on Bitcoin Under Trump’s Economic Strategy
Mandy Williams writes Why the Bitcoin Market Is Stuck—and the Key Metric That Could Change It: CryptoQuant CEO
Wayne Jones writes Metaplanet Acquires 156 BTC, Bringing Total Holdings to 2,391
Bitcoin price is up by another 6% today, as the cryptocurrency finally reclaims $50,000. Earlier today the cryptocurrency reached over $51,300 (Bitstamp), but quickly retraced from there down to the $50K area. So far, this reflects a 2-day price gain of over $4000 since Friday’s low of $46,400.
Quick recap: Bitcoin price started to scale at the beginning of March but couldn’t overcome the resistance around $52,500 at the Golden Ratio (bearish .618 Fib) earlier this week. From there, it started to lose momentum until support was met at $47,200 (.382 Fib) on Friday.
Not a coincidence, there seems to be increased demand from institutions beneath $50,000. Data shows massive outflows from Coinbase when the price action was around $47K – $48K, indicating that institutions are doubling down on Bitcoin.
The Key Level
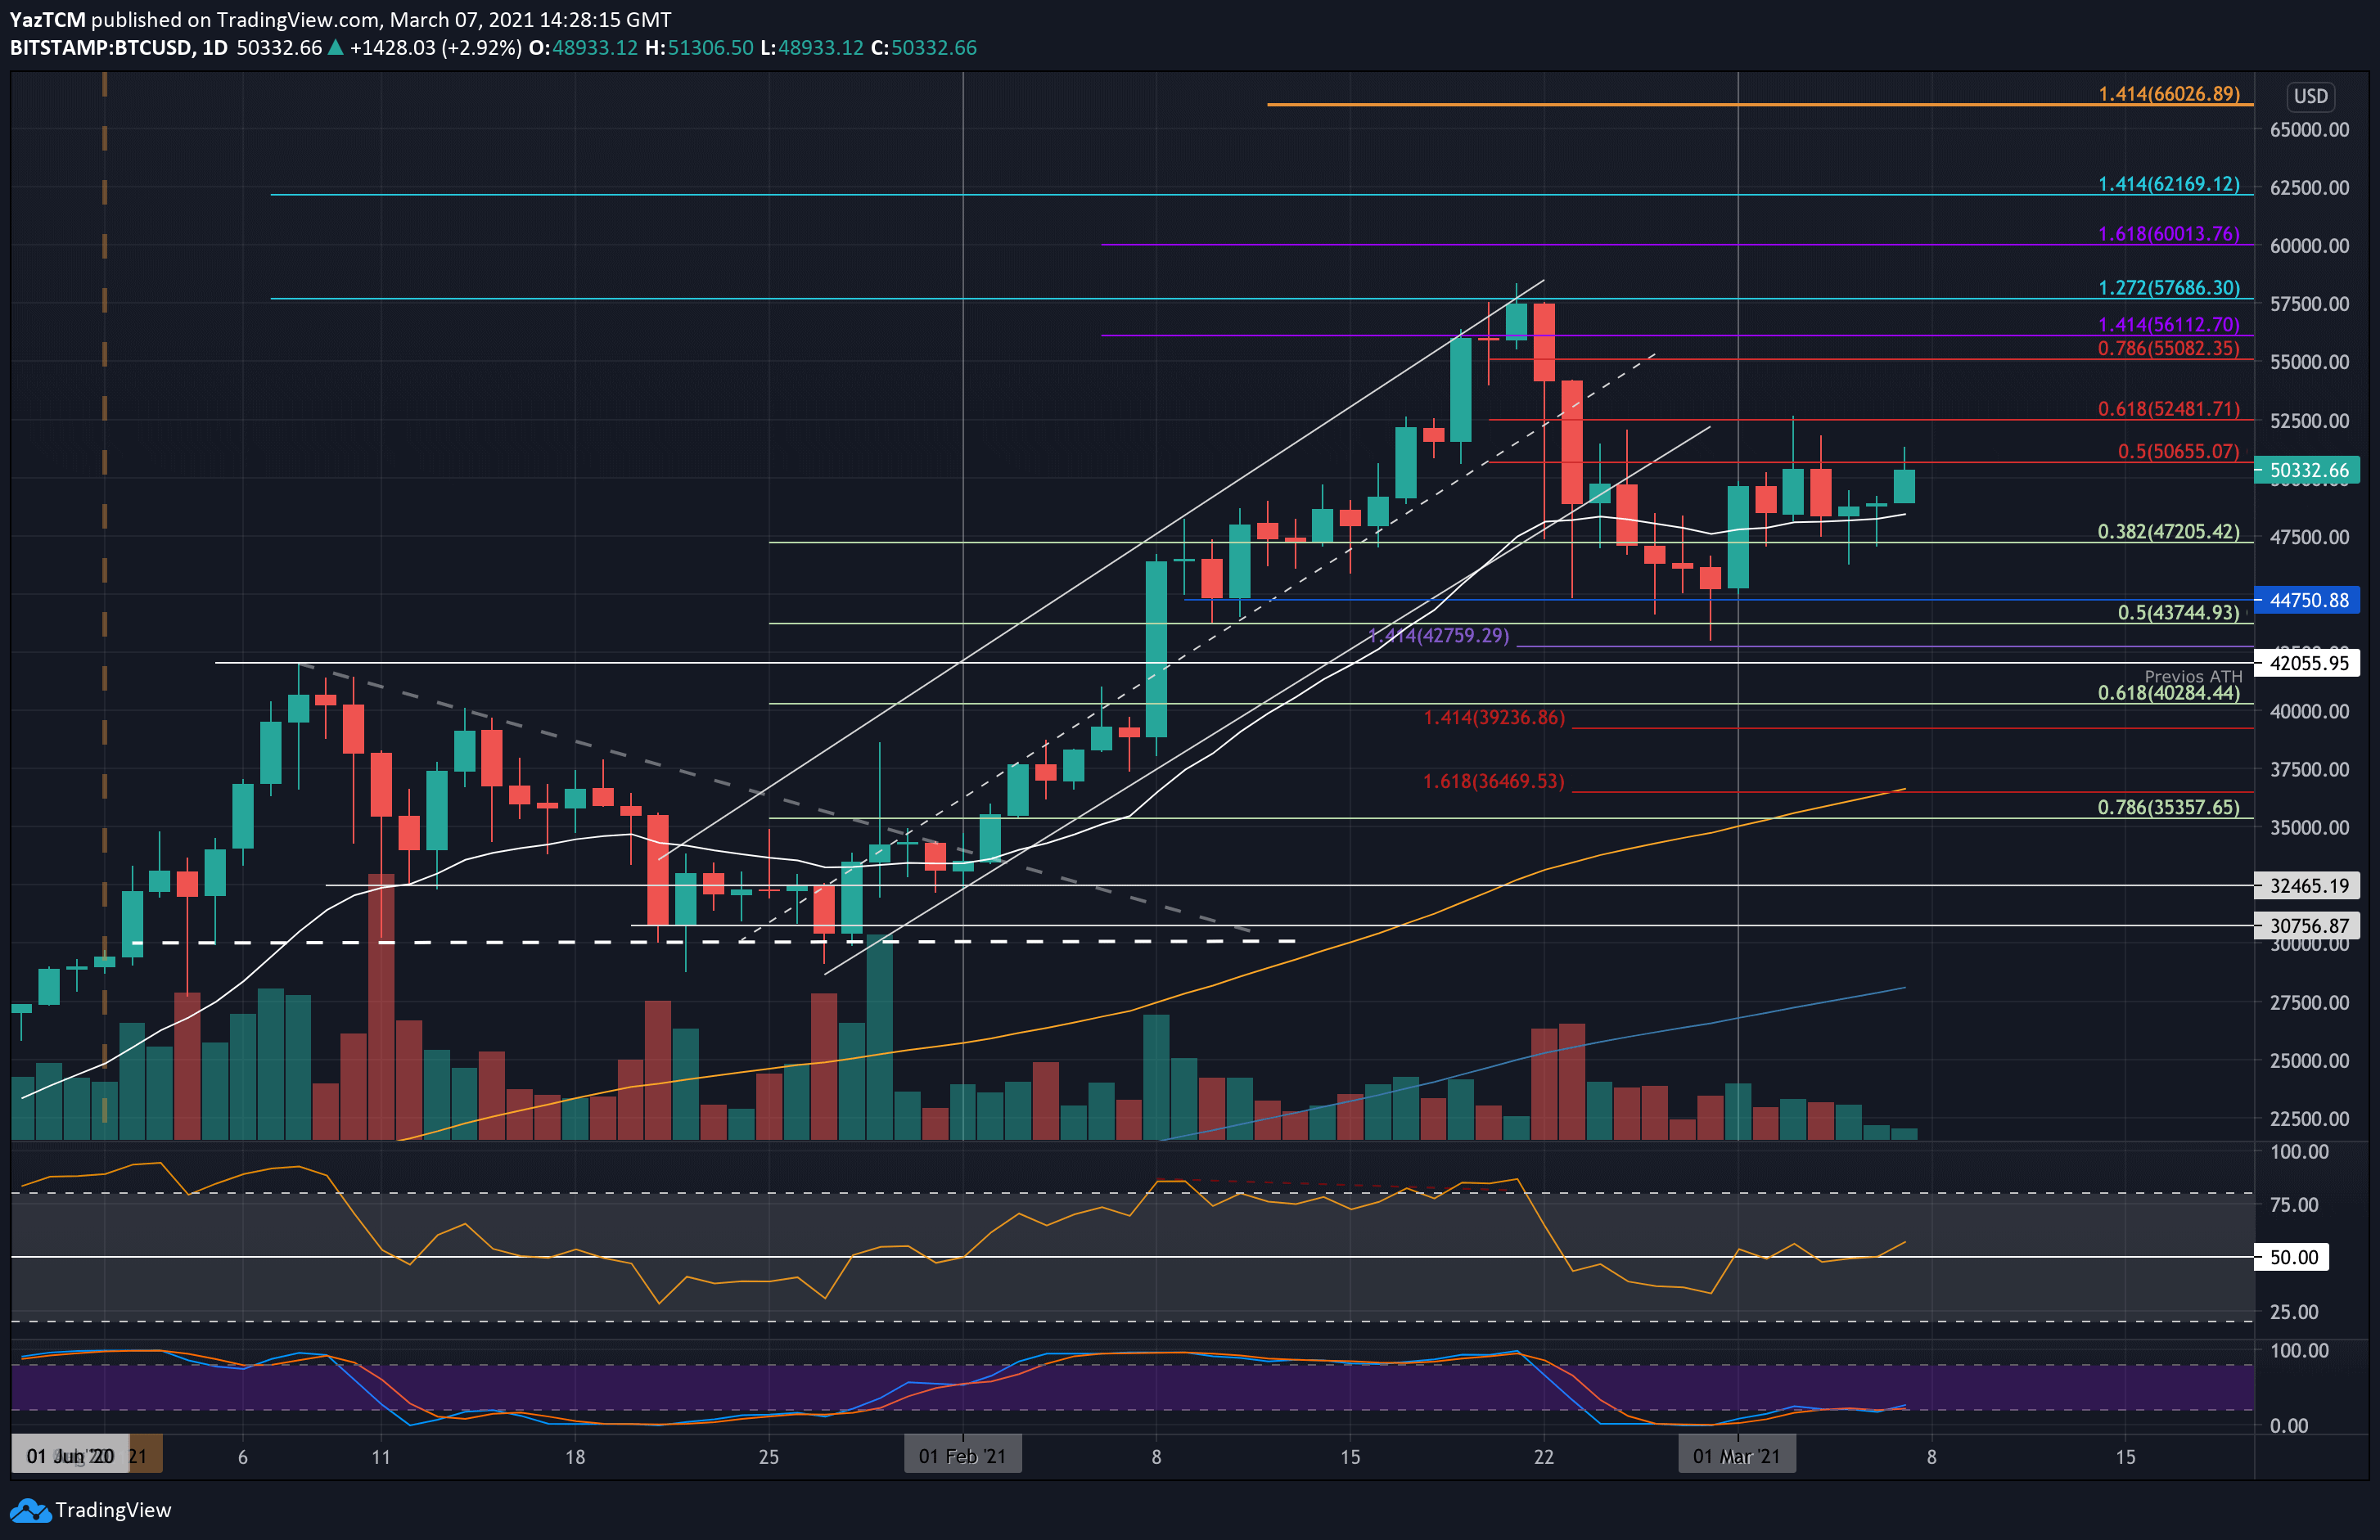
Following the bullish reversal on Wall Street’s Friday session, which included the new stimulus package approval, Bitcoin was able to reclaim the $50k price area, as of now.
However, the primary cryptocurrency is now facing resistance at $50,655, provided by a bearish .5 Fib Retracement. It had seen no success in closing a daily candle above this resistance so far during March 2021. The break above $50,000 is critical for the bulls moving forward. It will be essential that today’s daily candle closes above $50,000, the least, as the previous candles all close beneath the benchmark level.
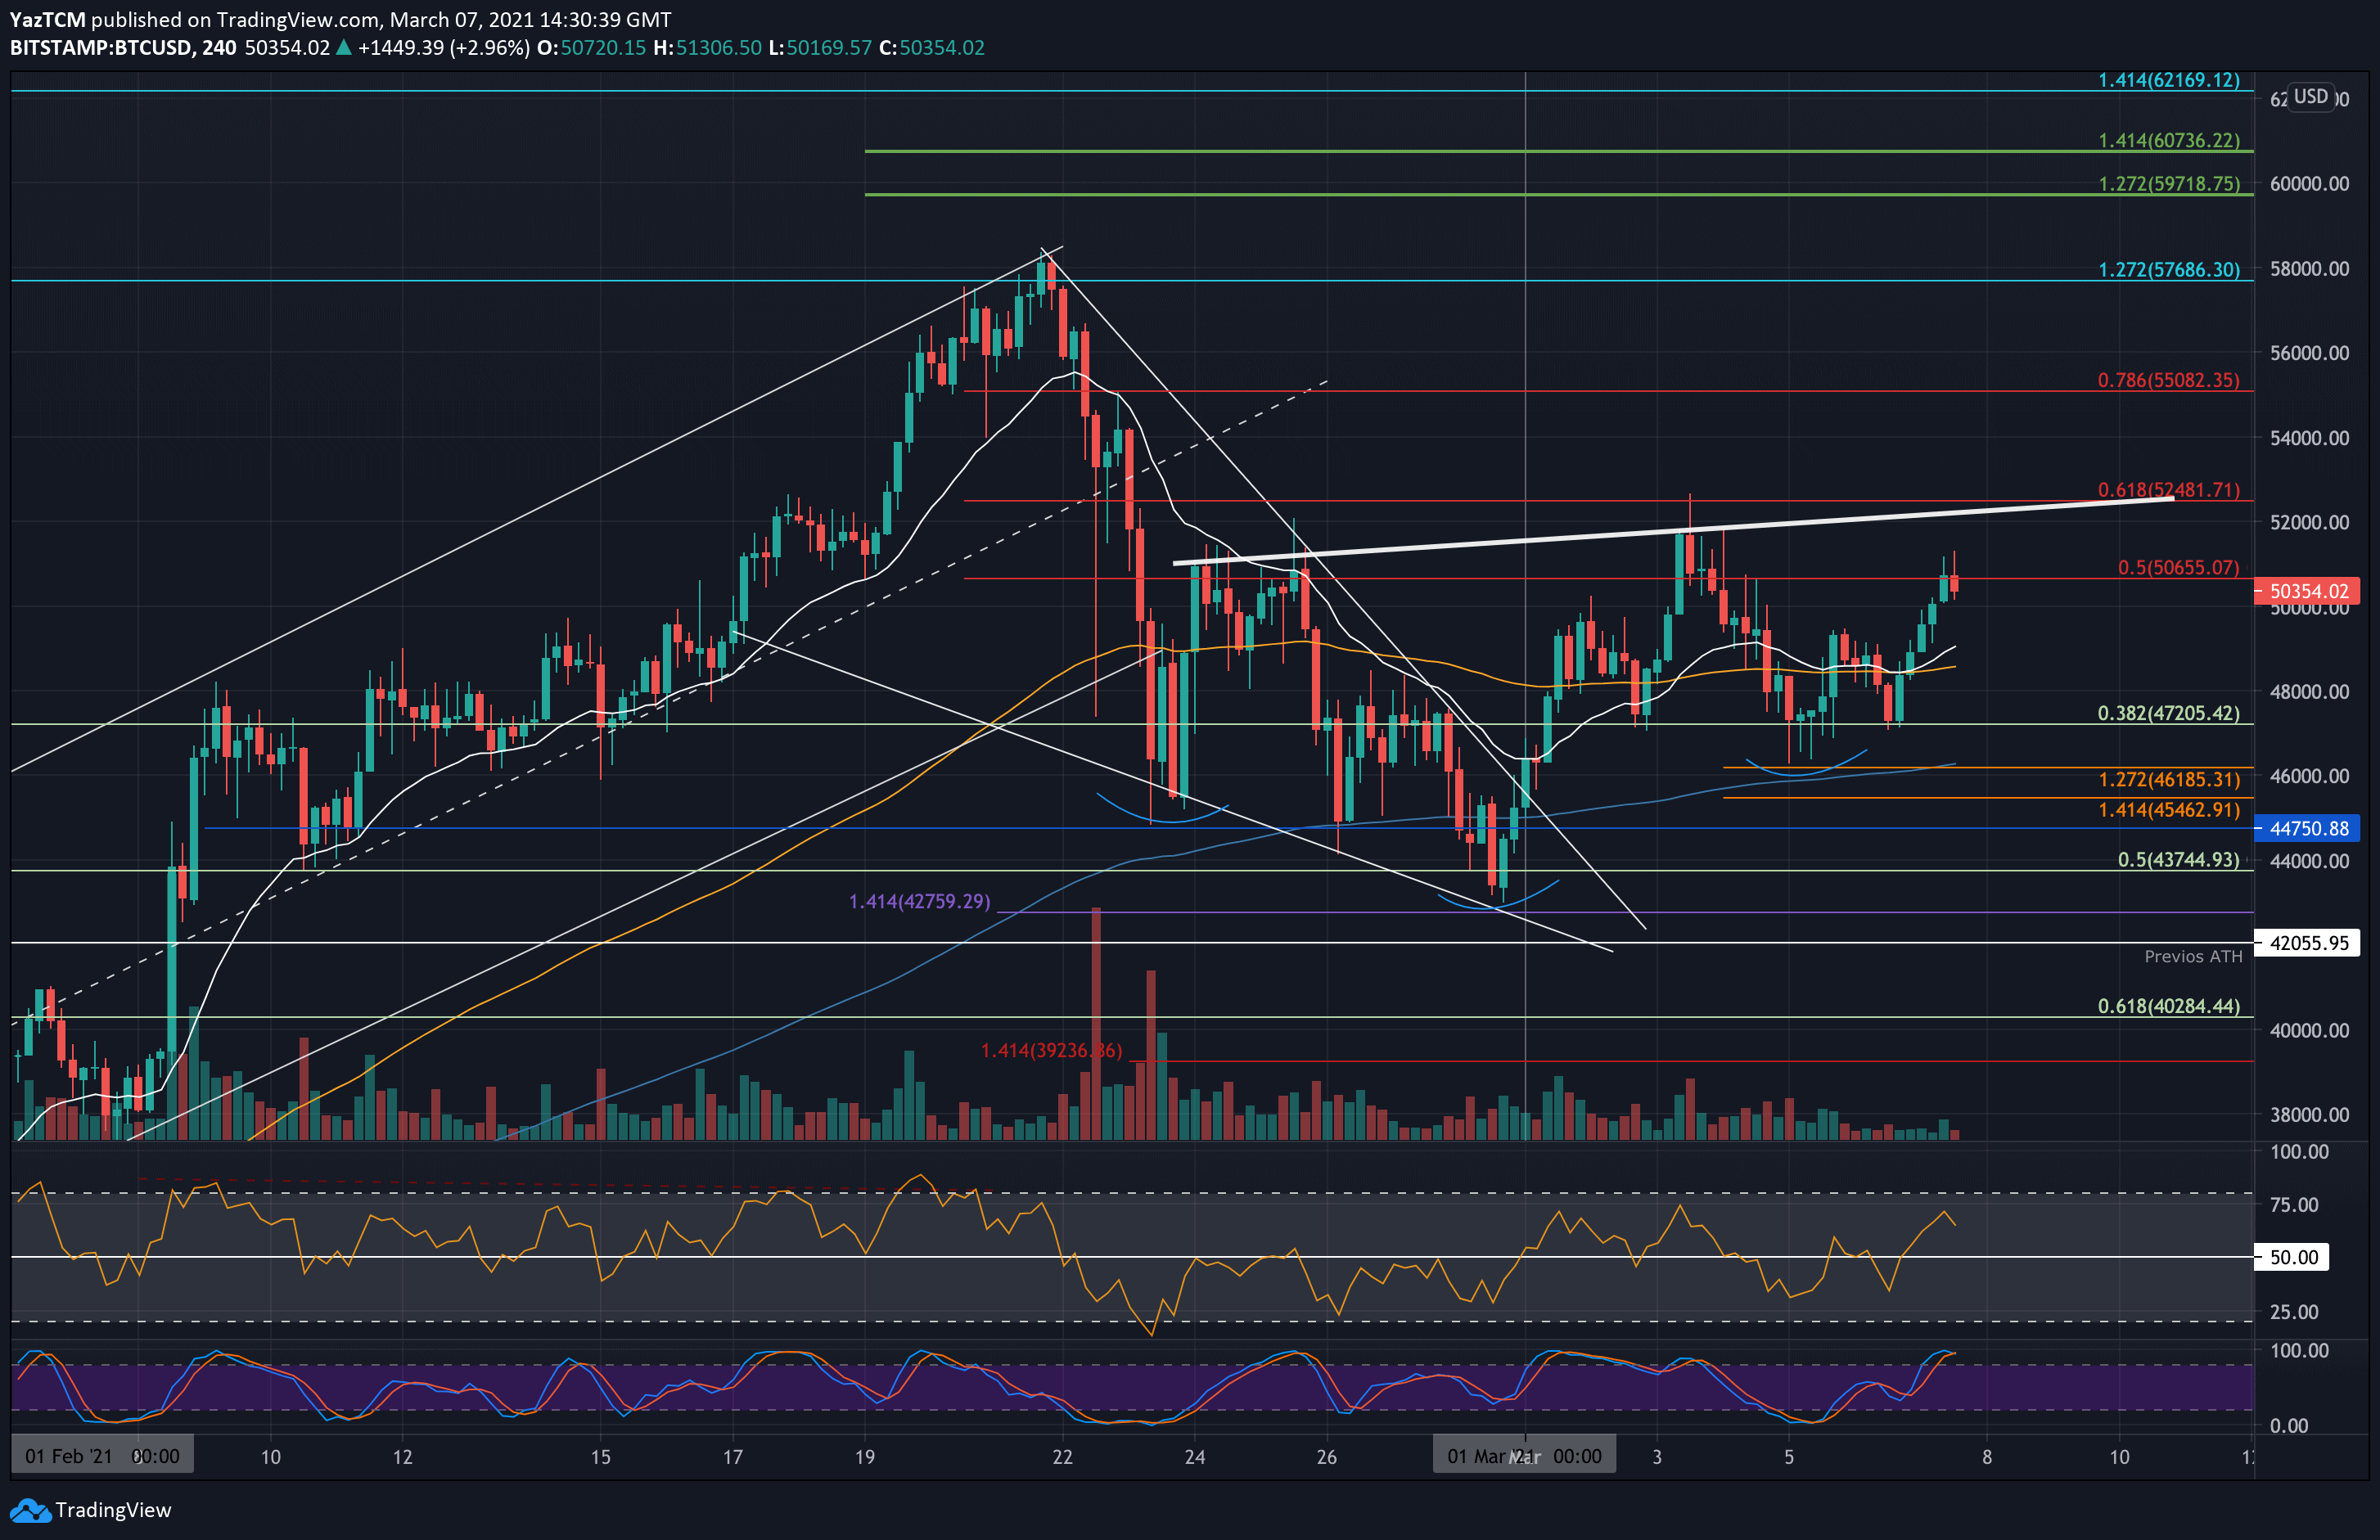
Looking at the following 4-hour chart, there is a potential of an inverse head and shoulders pattern forming on the short-term chart, highlighted by the blue curves with the neckline represented by the white line. For this pattern to play out, Bitcoin must surge above the neckline and clear resistance at $52,500, which is also the weekly high.
BTC Price Support and Resistance Levels to Watch
Key Support Levels: $50,000, $48,000, $47,200, $46,185, $44,750.
Key Resistance Levels: $50,655, $52,000, $52,500, $54,000, $55,000.
Looking ahead, the first level of resistance to overcome lies at $50,655 (bearish .5 Fib). This is followed by $52,000 (H&S neckline), $52,500 (bearish .618 Fib, the weekly high), $54,000, and $55,000 (bearish .786 Fib).
On the other other side, the first level of significant support lies at $50,000 (daily MA-20). This is followed by $48,000, $47,200 (.382 Fib), $46,185 (downside 1.272 Fib Extension), and $44,750.
The RSI has now bounced higher from the midline, indicating that the bulls are attempting to control the market momentum moving forward. If it can continue to rise, BTC can be expected to continue higher beyond $50,655.
Bitstamp BTC/USD Daily Chart
Bitstamp BTC/USD 4-Hour Chart