The BTC ongoing bull run is still intact as the primary cryptocurrency records an unbelievable 75% price explosion over the past month alone.During the past 24 hours, the Bitcoin price saw another 6% increase and is currently trading around ,500. Like the past days, Bitcoin recorded another fresh all-time at ,810 (Coinbase price).As mentioned here yesterday, BTC went extremely parabolic after breaking above the upper boundary of a 3-week long ascending price channel.Despite the excitement, the ATH was followed by a quick retracement, as BTC wasn’t able to close the 4-hour candle above resistance at ,615 – provided by a short term 1.414 Fib Extension level.As a result, Bitcoin corrected sharply to ,700 (Bitstamp), dropping precisely into support at ,680 (short term .236 Fib
Topics:
Yaz Sheikh considers the following as important: Bitcoin (BTC) Price, BTC Analysis, BTCEUR, BTCGBP, btcusd, btcusdt
This could be interesting, too:
Chayanika Deka writes XRP, SOL, and ADA Inclusion in US Crypto Reserve Pushes Traders on Edge
Chayanika Deka writes Why Arthur Hayes Is Bullish on Bitcoin Under Trump’s Economic Strategy
Mandy Williams writes Why the Bitcoin Market Is Stuck—and the Key Metric That Could Change It: CryptoQuant CEO
Wayne Jones writes Metaplanet Acquires 156 BTC, Bringing Total Holdings to 2,391
The BTC ongoing bull run is still intact as the primary cryptocurrency records an unbelievable 75% price explosion over the past month alone.
During the past 24 hours, the Bitcoin price saw another 6% increase and is currently trading around $33,500. Like the past days, Bitcoin recorded another fresh all-time at $34,810 (Coinbase price).
As mentioned here yesterday, BTC went extremely parabolic after breaking above the upper boundary of a 3-week long ascending price channel.
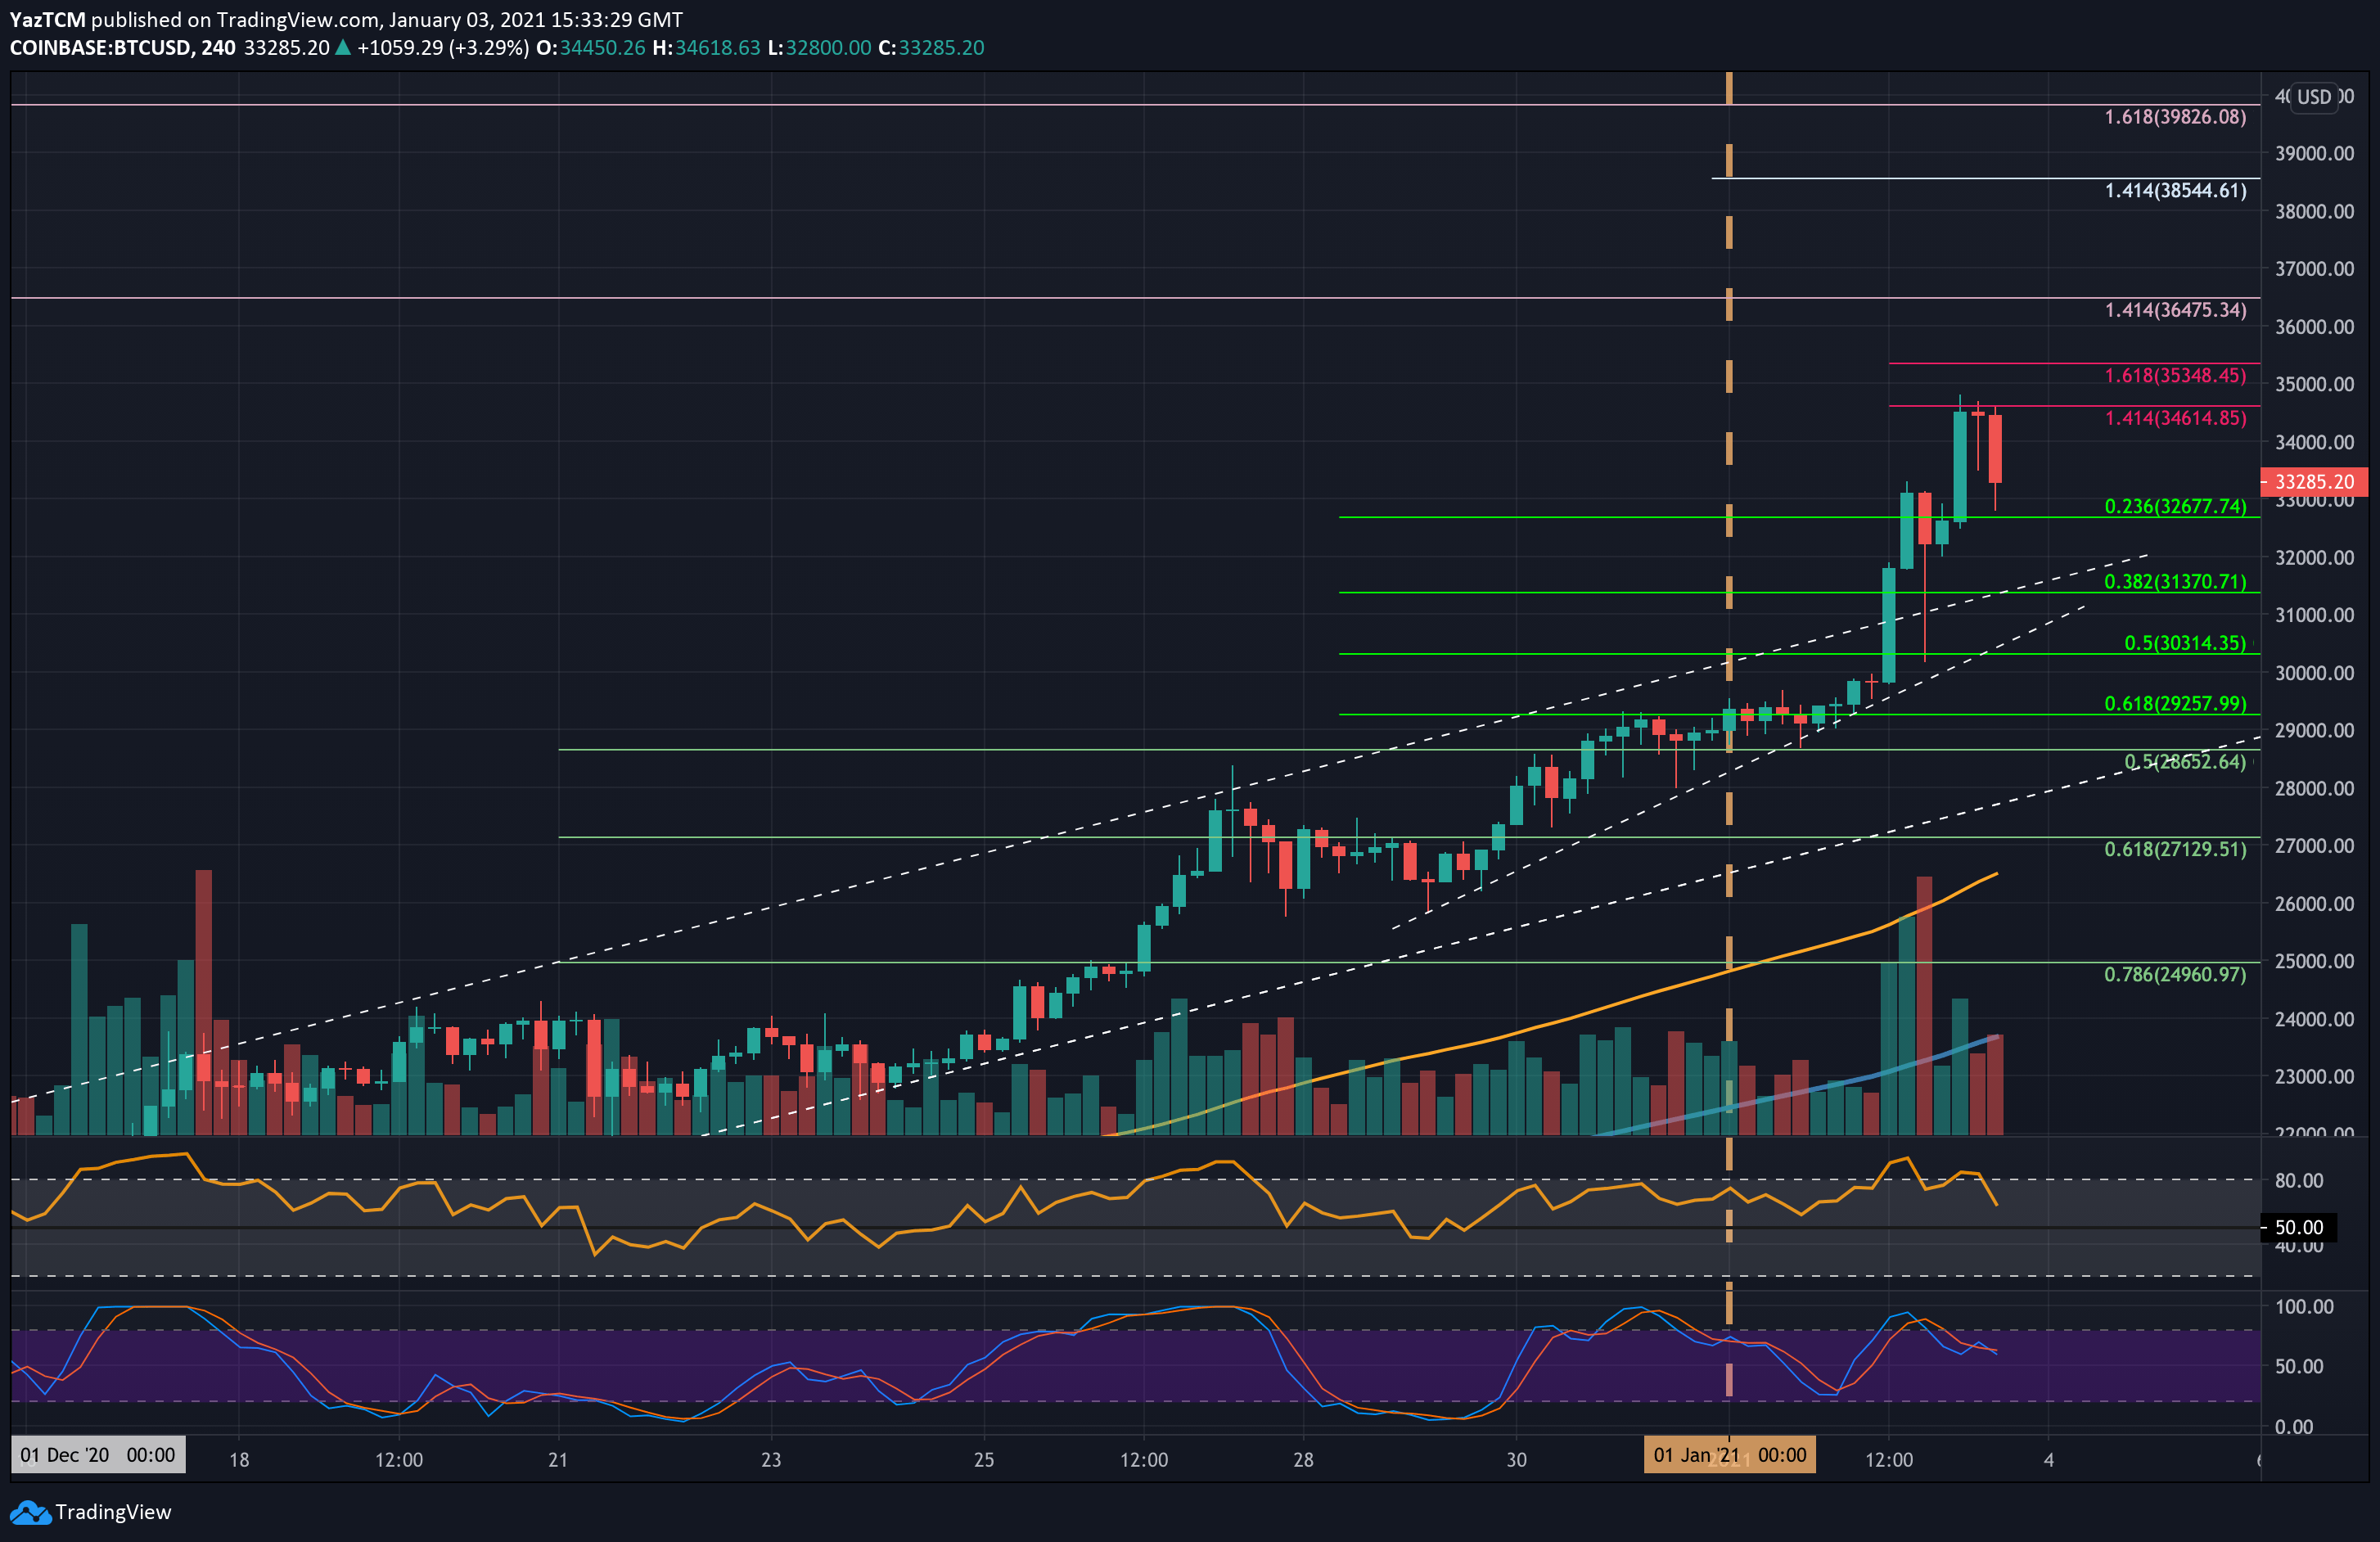
Despite the excitement, the ATH was followed by a quick retracement, as BTC wasn’t able to close the 4-hour candle above resistance at $34,615 – provided by a short term 1.414 Fib Extension level.
As a result, Bitcoin corrected sharply to $32,700 (Bitstamp), dropping precisely into support at $32,680 (short term .236 Fib Retracement). It has since rebounded to trade at $33,350.
The total crypto market cap now sits at $881.9 billion, with Bitcoin dominance at 70%, decreasing from yesterday’s high.
BTC Price Support and Resistance Levels to Watch
Key Support Levels: $32,700, $32,000, $31,400, $31,000.
Key Resistance Levels: $34,000, $34,615, $34,800 – $35,000, $35,350.
As of now, the first major level of resistance lies at $34,000. This is followed by resistance at $34,142 (1.272 Fib Extension). Further above lies $34,615 (short term 1.414 Fib Extension – purple), and the current ATH at $34,800 – $35,000. Next is the $35,350 resistance (short term 1.618 Fib Extension -purple) and $36K.
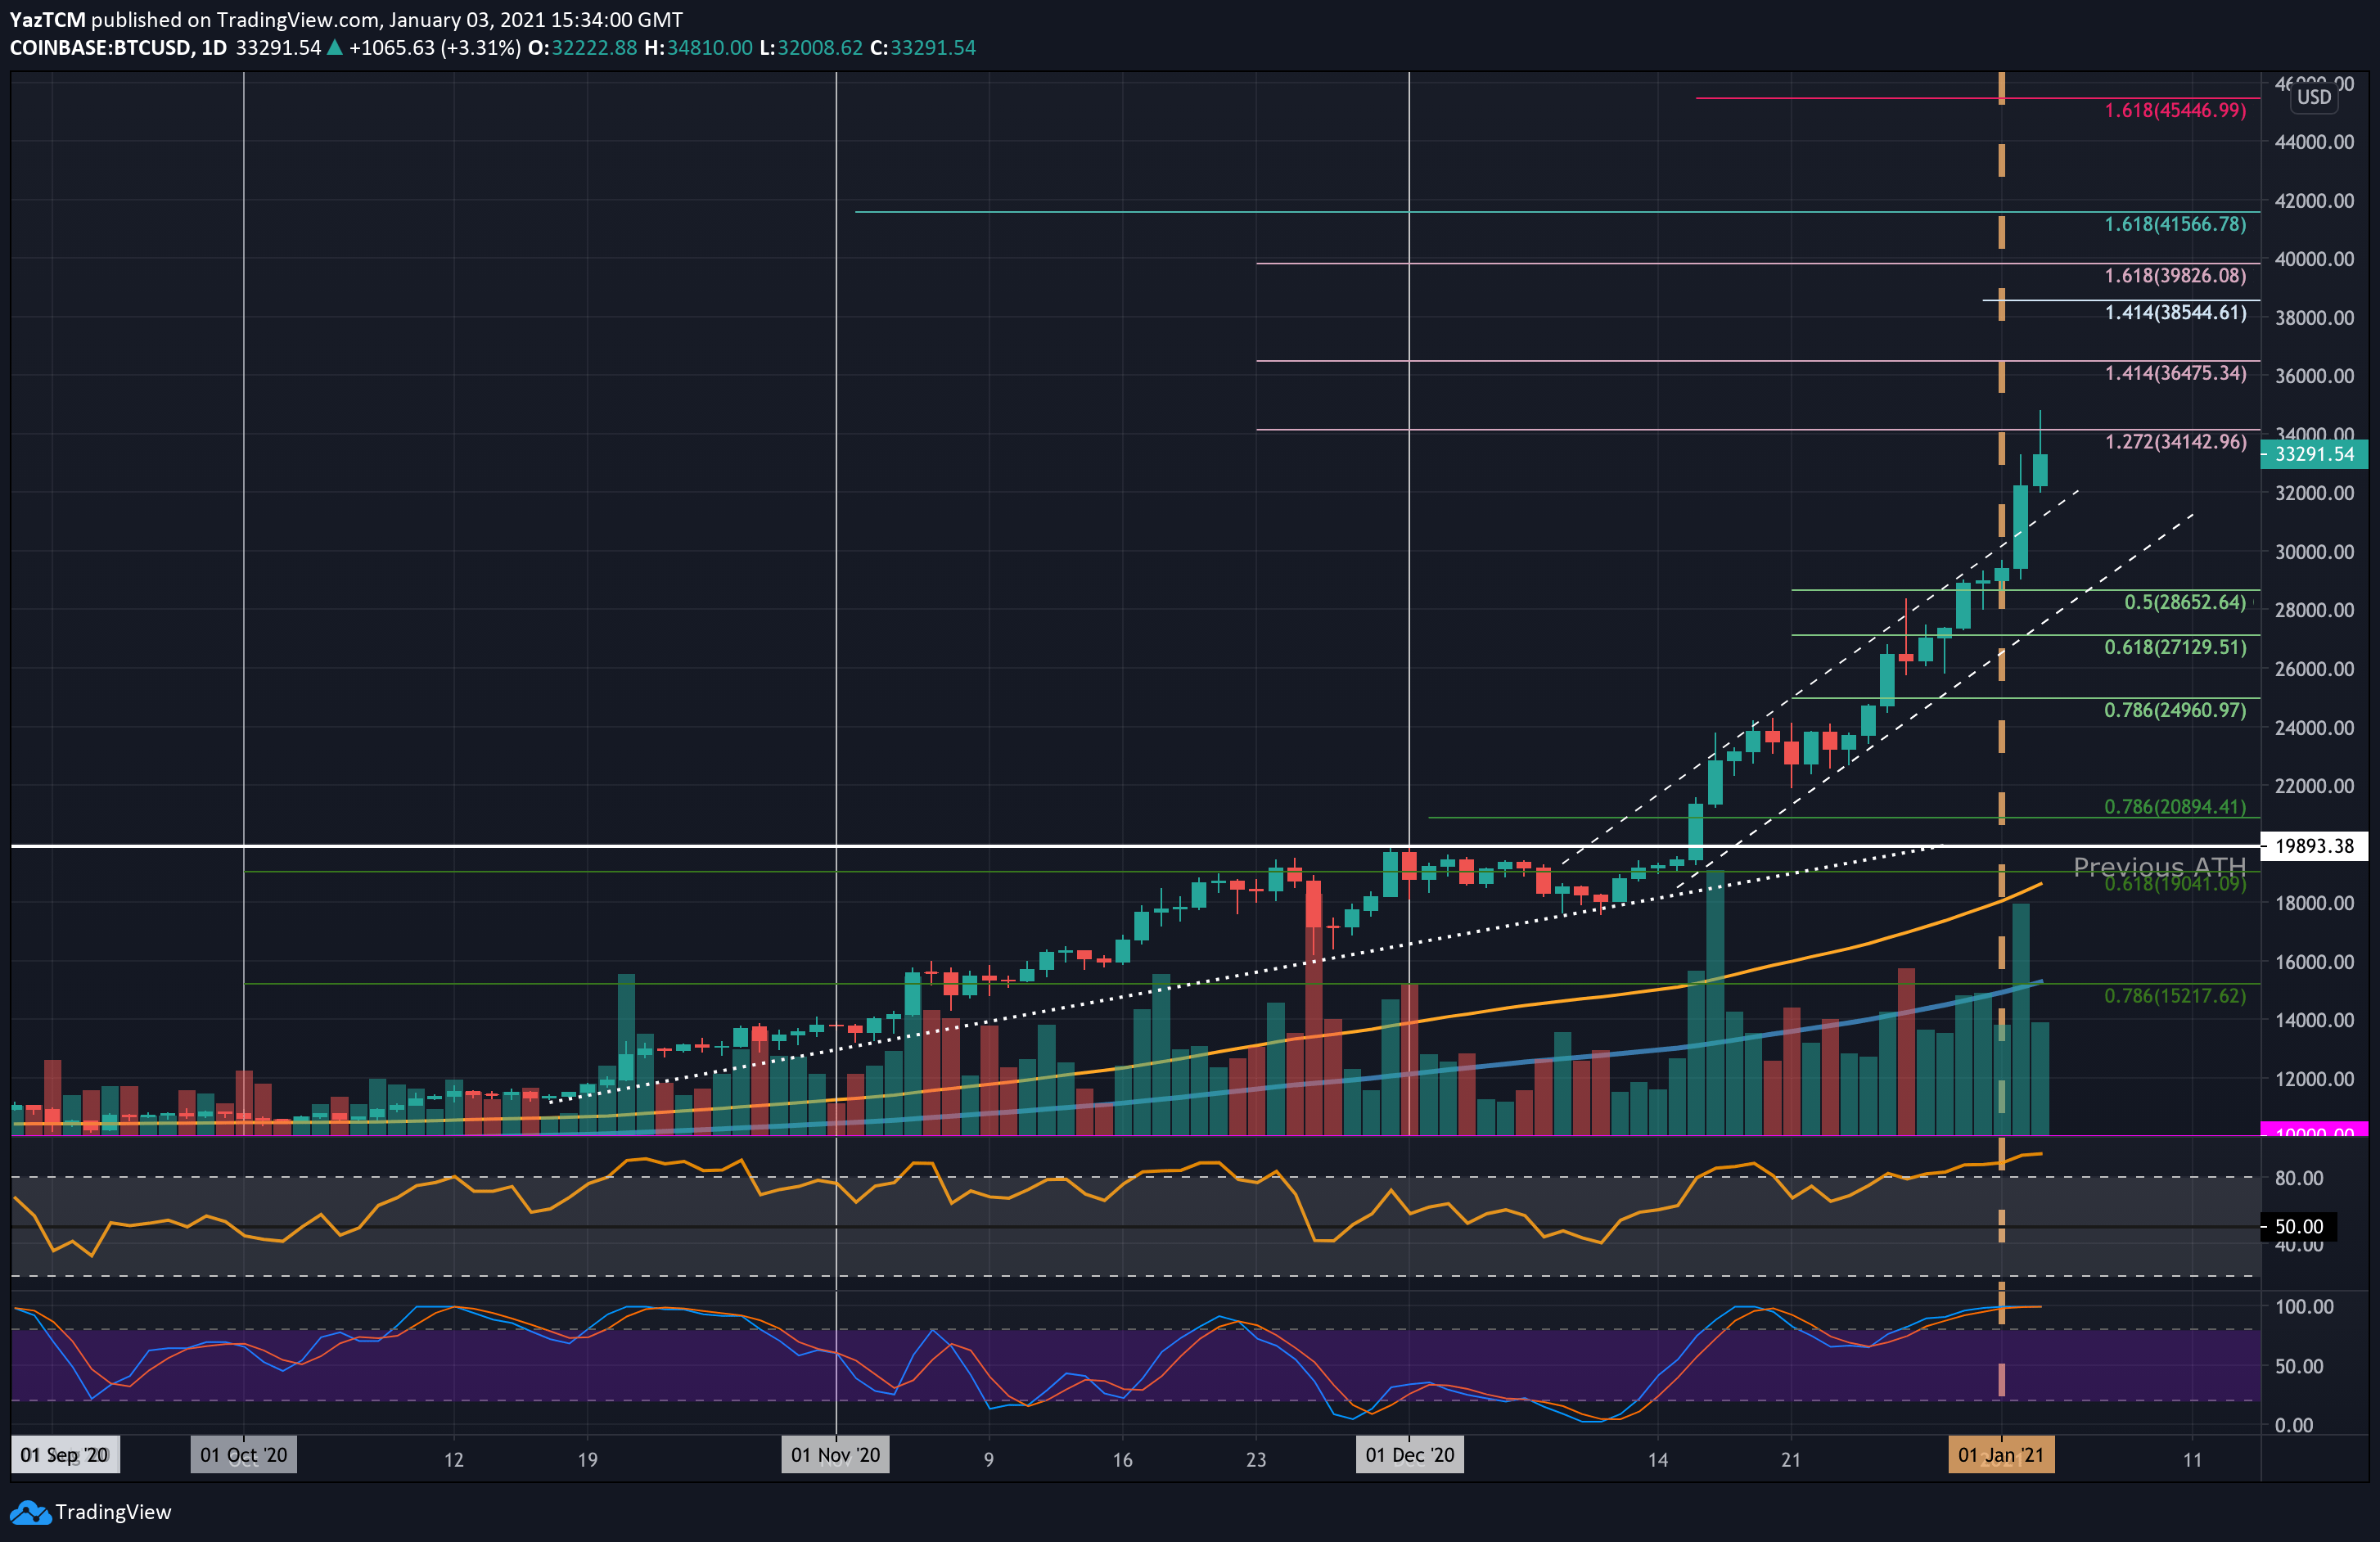
On the other side, if a correction occurs, we can expect the first support beyond $33K to be $32,700 (the low from past hours, also a .236 Fib level). Further below lies $32,000, as well as the upper boundary of the marked ascending channel on the following daily chart, $31,370 (.382 Fib), $31,000, and $30,315 (.5 Fib).
The daily RSI signals a possible cool-off. The indicator is recording its highest level since July 2020 and has only been this overbought twice throughout 2020. Furthermore, the 4-hour RSI hints of bearish divergence for the first time since mid-December, which could indicate an imminent short-term retracement. Despite the above, the market is very volatile, and the BTC parabolic bullish move is ongoing until proved else.
Coinbase BTC/USD Daily Chart
Coinbase BTC/USD 4HR Chart