Bitcoin saw a strong rebound today as it recovered from yesterday’s low at ,000 to over K, where it is trading as of writing these lines.The cryptocurrency had been in a downtrend for the previous week as it dropped by over 25% to reach its weekly low yesterday, at the mentioned-above level of K (according to Bitstamp).During the correction, Bitcoin had broken beneath an ascending price channel that it was trading within throughout February. However, over the past days, BTC was forming a falling wedge which is a textbook bullish formation. The wedge can be seen on the following 4-hour chart.Alongside the pennant, there were hints of bullish divergence on the short-term timeframes, including the 4-hour, that we highlighted yesterday. After closing the daily candles for the previous
Topics:
Yaz Sheikh considers the following as important: Bitcoin (BTC) Price, BTC Analysis, BTCEUR, BTCGBP, btcusd, btcusdt
This could be interesting, too:
Chayanika Deka writes XRP, SOL, and ADA Inclusion in US Crypto Reserve Pushes Traders on Edge
Chayanika Deka writes Why Arthur Hayes Is Bullish on Bitcoin Under Trump’s Economic Strategy
Mandy Williams writes Why the Bitcoin Market Is Stuck—and the Key Metric That Could Change It: CryptoQuant CEO
Wayne Jones writes Metaplanet Acquires 156 BTC, Bringing Total Holdings to 2,391
Bitcoin saw a strong rebound today as it recovered from yesterday’s low at $43,000 to over $48K, where it is trading as of writing these lines.
The cryptocurrency had been in a downtrend for the previous week as it dropped by over 25% to reach its weekly low yesterday, at the mentioned-above level of $43K (according to Bitstamp).
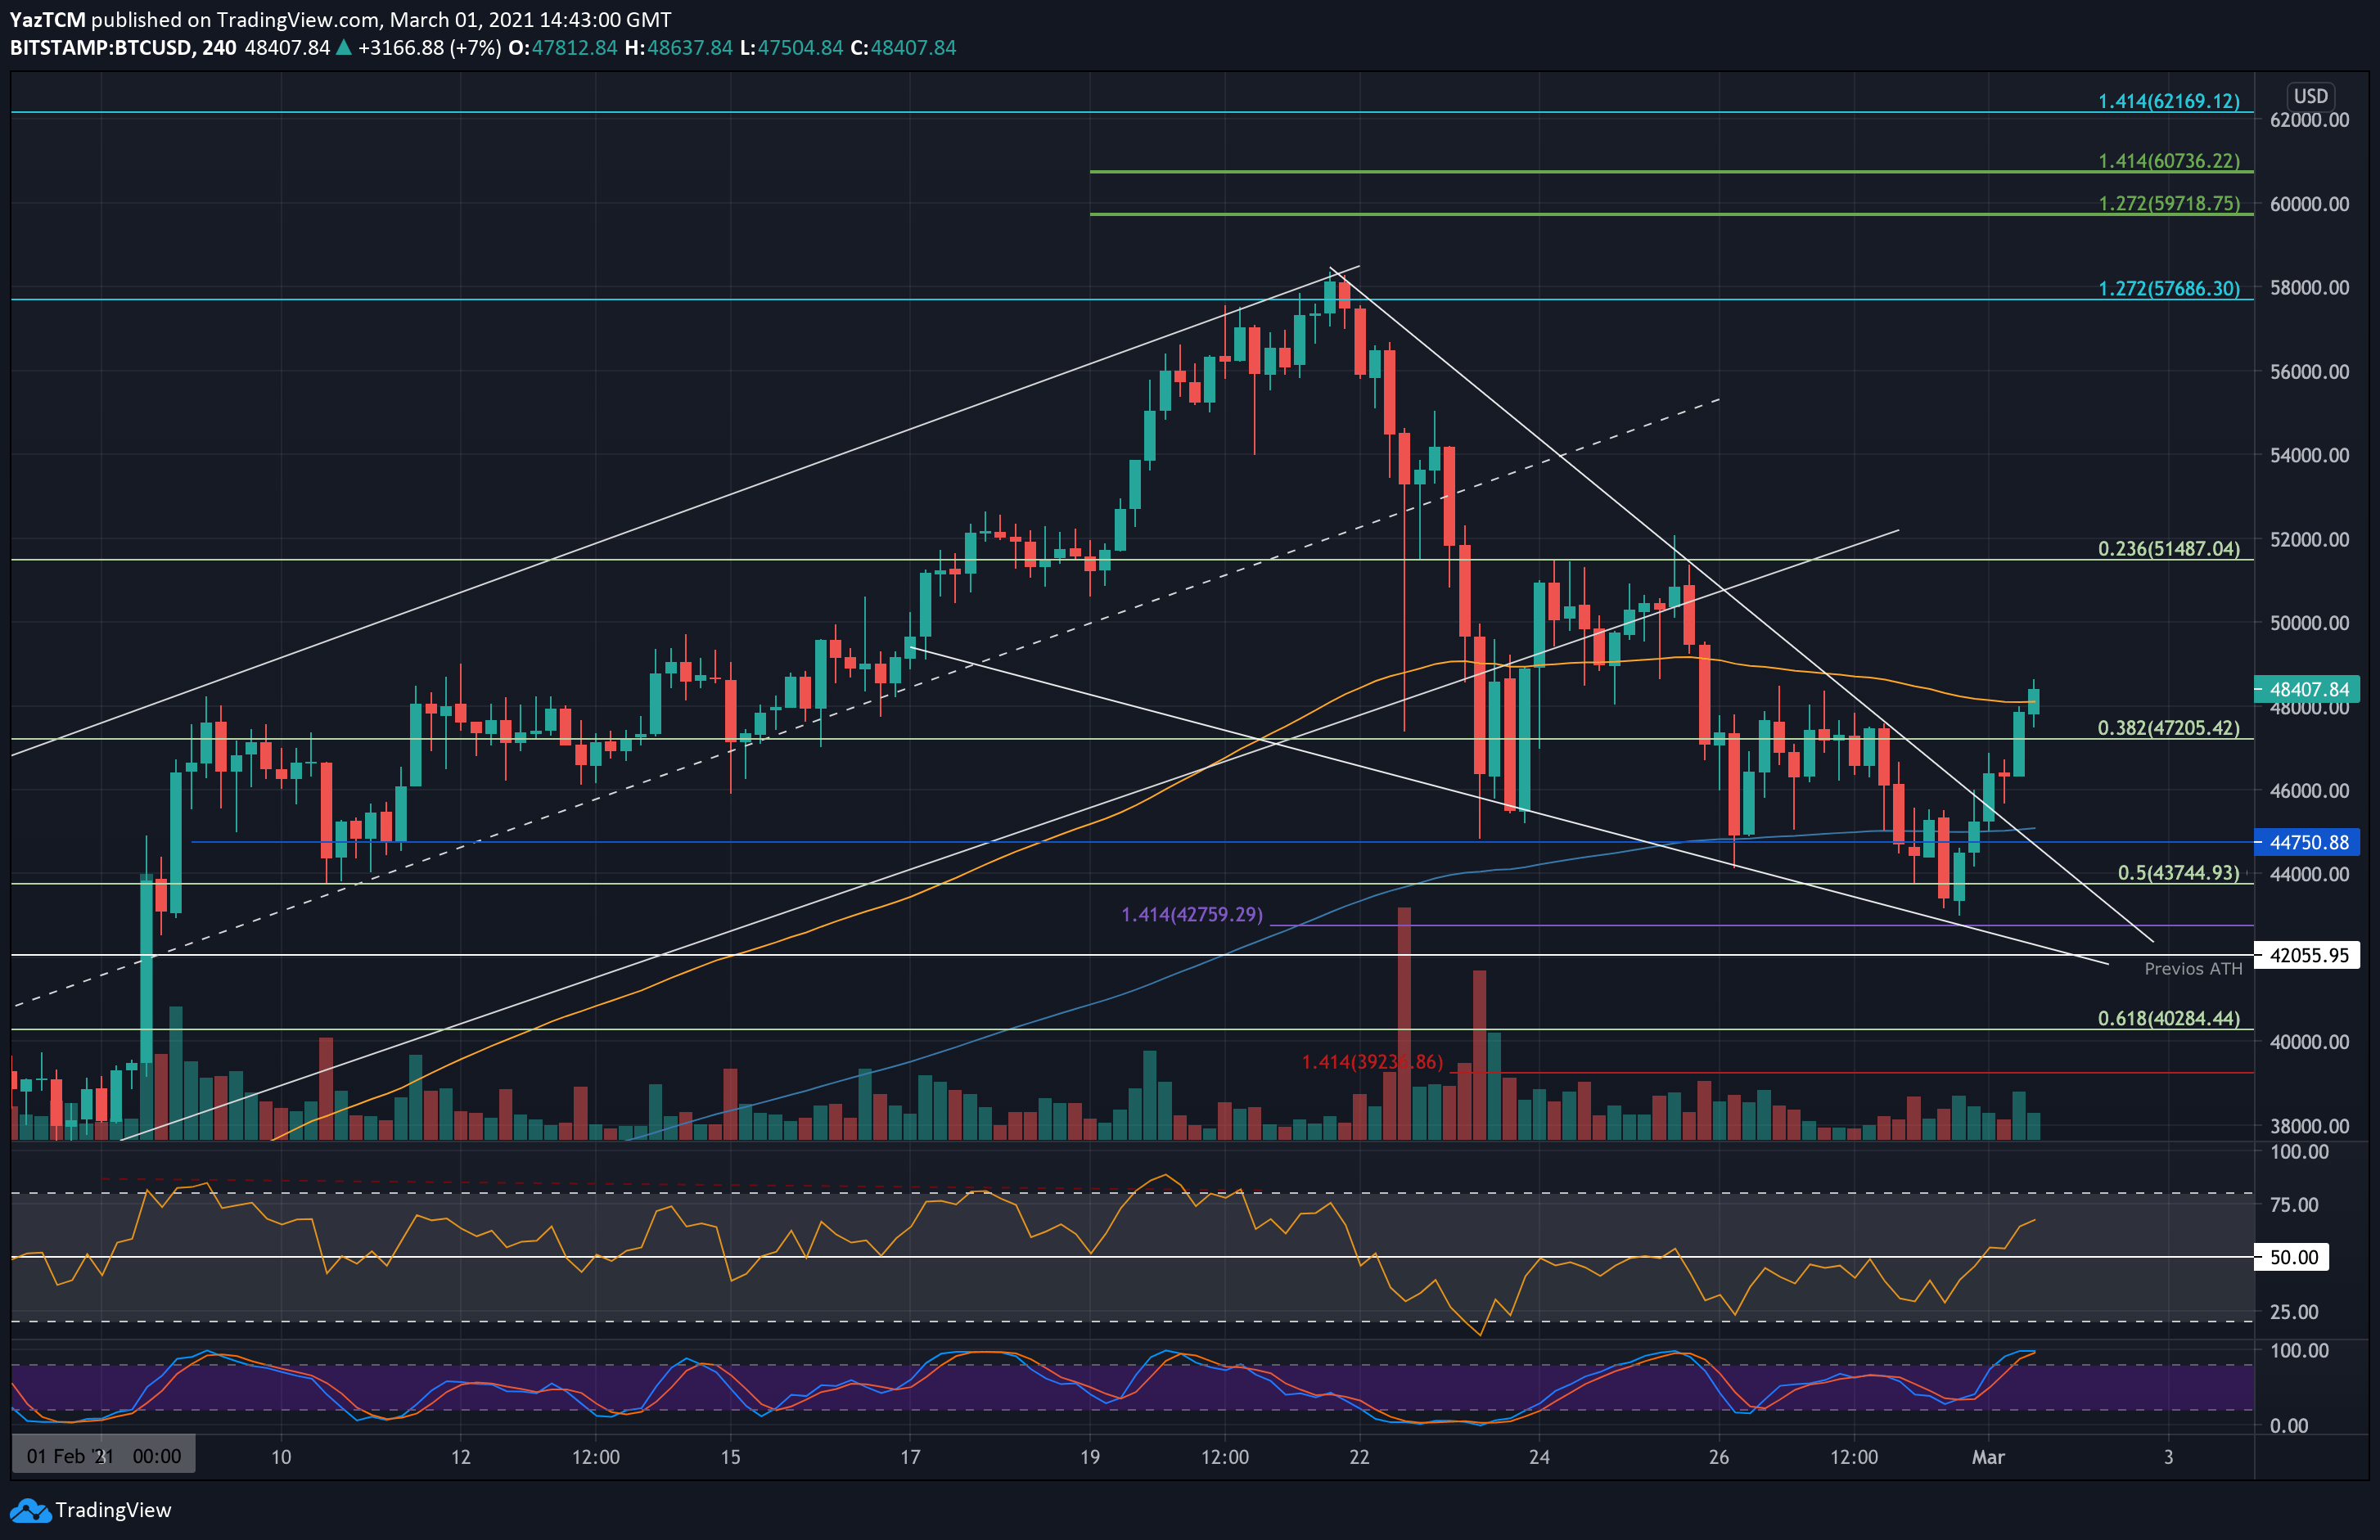
During the correction, Bitcoin had broken beneath an ascending price channel that it was trading within throughout February. However, over the past days, BTC was forming a falling wedge which is a textbook bullish formation. The wedge can be seen on the following 4-hour chart.
Alongside the pennant, there were hints of bullish divergence on the short-term timeframes, including the 4-hour, that we highlighted yesterday. After closing the daily candles for the previous two days at $44,750, the bullish divergence played out nicely today – allowing Bitcoin to break the wedge’s upper boundary, penetrate beyond the 4-Hour 20-EMA, and sharply climb above the $48,000 mark.
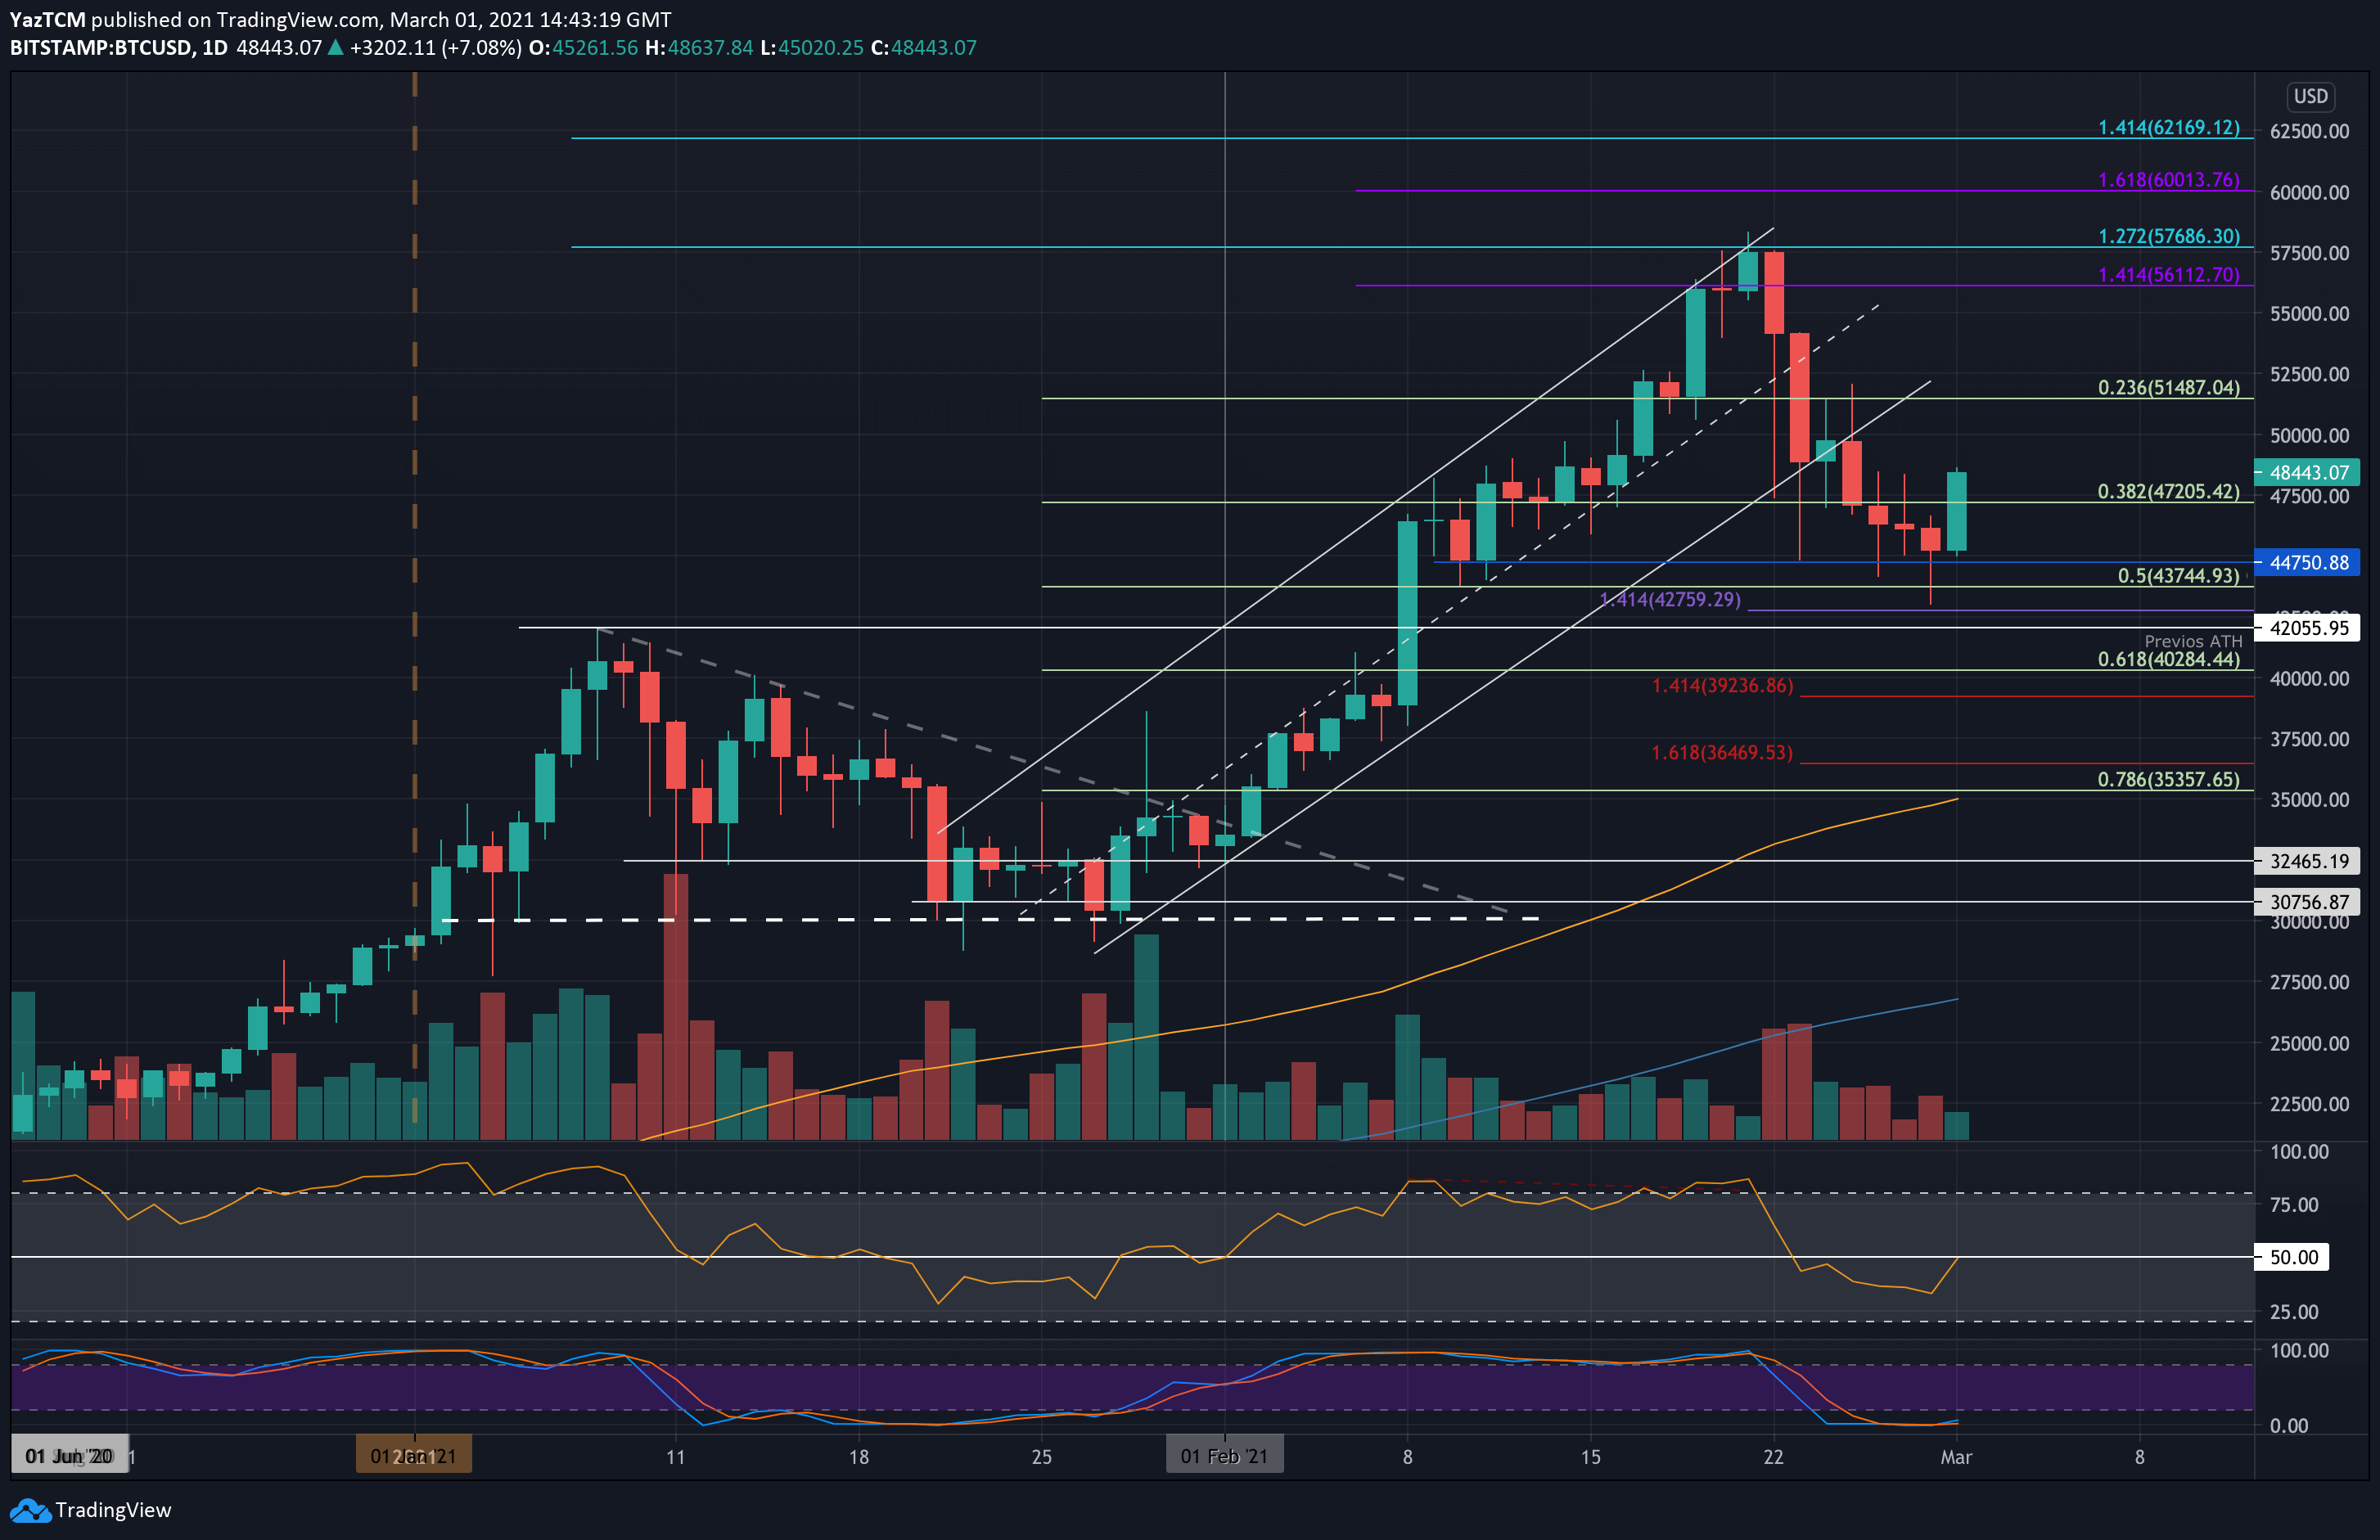
Now, the question is, whether Bitcoin will have enough power to penetrate the $50K psychological resistance level, and maybe aim at the current all-time high level of $58K, set just days ago on February 21, 2021.
BTC Price Support and Resistance Levels to Watch
Key Support Levels: $47,200, $46,600, $44,750, $43,745, $42,760, $42,000.
Key Resistance Levels: $50,000, $52,500, $55,000, $56,112, $57,960.
Moving forward, the first level of resistance lies at the benchmark level of $50,000. This is followed by $52,500 – the target of the wedge’s breakout, $55,000, $56,112 (1.414 Fib Extension – purple), and $57,690 (1.272 Fib extension – blue).
On the other side, the first support is now found at $47,200 (.382 Fib). This is followed by $46,600 (4-hour’s EMA-20), $44,750, $43,745 (.5 Fib), $42,760 (downside 1.414 Fib Extension), and $42,000 (previous ATH).
The daily RSI has now returned to the midline, indicating the previous bearish momentum has dissipated. The RSI is now above the midline on the short-term charts, indicating short-term bullish momentum is now present.
Bitstamp BTC/USD Daily Chart
Bitstamp BTC/USD 4-Hour Chart