While the crypto market is celebrating a new all-time high to the second-largest crypto, Ethereum, Bitcoin saw a minor 3% price spike over the past 24 hours as it trades slightly below K. On a larger scale, BTC has been trading sideways for the past 12 days after nailing its ATH level at ,000 On January 8, 2020.From there, Bitcoin started to consolidate as it forms a giant symmetrical triangle pattern, as can be seen on the following 4-hour chart. Over the weekend, Bitcoin fell from the resistance at ,940 – K (short term bearish .618 Fib) and headed to the support at ,800 (.5 Fib Retracement) – the lower ascending angle of the triangle.Yesterday, BTC re-tested that support line again and after breaking out from a short-term rising channel during the time of this writing,
Topics:
Yaz Sheikh considers the following as important: Bitcoin (BTC) Price, BTC Analysis, BTCEUR, BTCGBP, btcusd, btcusdt
This could be interesting, too:
Chayanika Deka writes XRP, SOL, and ADA Inclusion in US Crypto Reserve Pushes Traders on Edge
Chayanika Deka writes Why Arthur Hayes Is Bullish on Bitcoin Under Trump’s Economic Strategy
Mandy Williams writes Why the Bitcoin Market Is Stuck—and the Key Metric That Could Change It: CryptoQuant CEO
Wayne Jones writes Metaplanet Acquires 156 BTC, Bringing Total Holdings to 2,391
While the crypto market is celebrating a new all-time high to the second-largest crypto, Ethereum, Bitcoin saw a minor 3% price spike over the past 24 hours as it trades slightly below $38K. On a larger scale, BTC has been trading sideways for the past 12 days after nailing its ATH level at $42,000 On January 8, 2020.
From there, Bitcoin started to consolidate as it forms a giant symmetrical triangle pattern, as can be seen on the following 4-hour chart. Over the weekend, Bitcoin fell from the resistance at $37,940 – $38K (short term bearish .618 Fib) and headed to the support at $34,800 (.5 Fib Retracement) – the lower ascending angle of the triangle.
Yesterday, BTC re-tested that support line again and after breaking out from a short-term rising channel during the time of this writing, made its way back towards $38K and the upper boundary of the symmetrical triangle, at around $38,300.
In case Bitcoin breaks out of the triangle to the bullish side, we can definitely expect a retest of $40K, followed by the ATH levels.
BTC Price Support and Resistance Levels to Watch
Key Support Levels: $37,000, $36,000, $34,800, $34,000, $33,135.
Key Resistance Levels: $37,940 – $39,000, $38,300, $30,000, $39,720, $40,000.
The first level of resistance lies in the range of $37,940 (bearish .618 Fib Retracement) and $38,000. This is closely followed by resistance at the upper boundary of the triangle at $38,300.
The next targets would be $39,000, $39,720 (bearish .786 Fib Retracement), $40,000, and $40,775 (bearish .886 Fib Retracement).
On the other side, the first level of support lies at $37,000. This is followed by $36,000 (.236 Fib Retracement), $34,800 (.5 Fib Retracement & the lower boundary of triangle). Further support lies at $34,000, followed by $33,130 (short term .618 Fib) and $32,500 (.382 Fib).
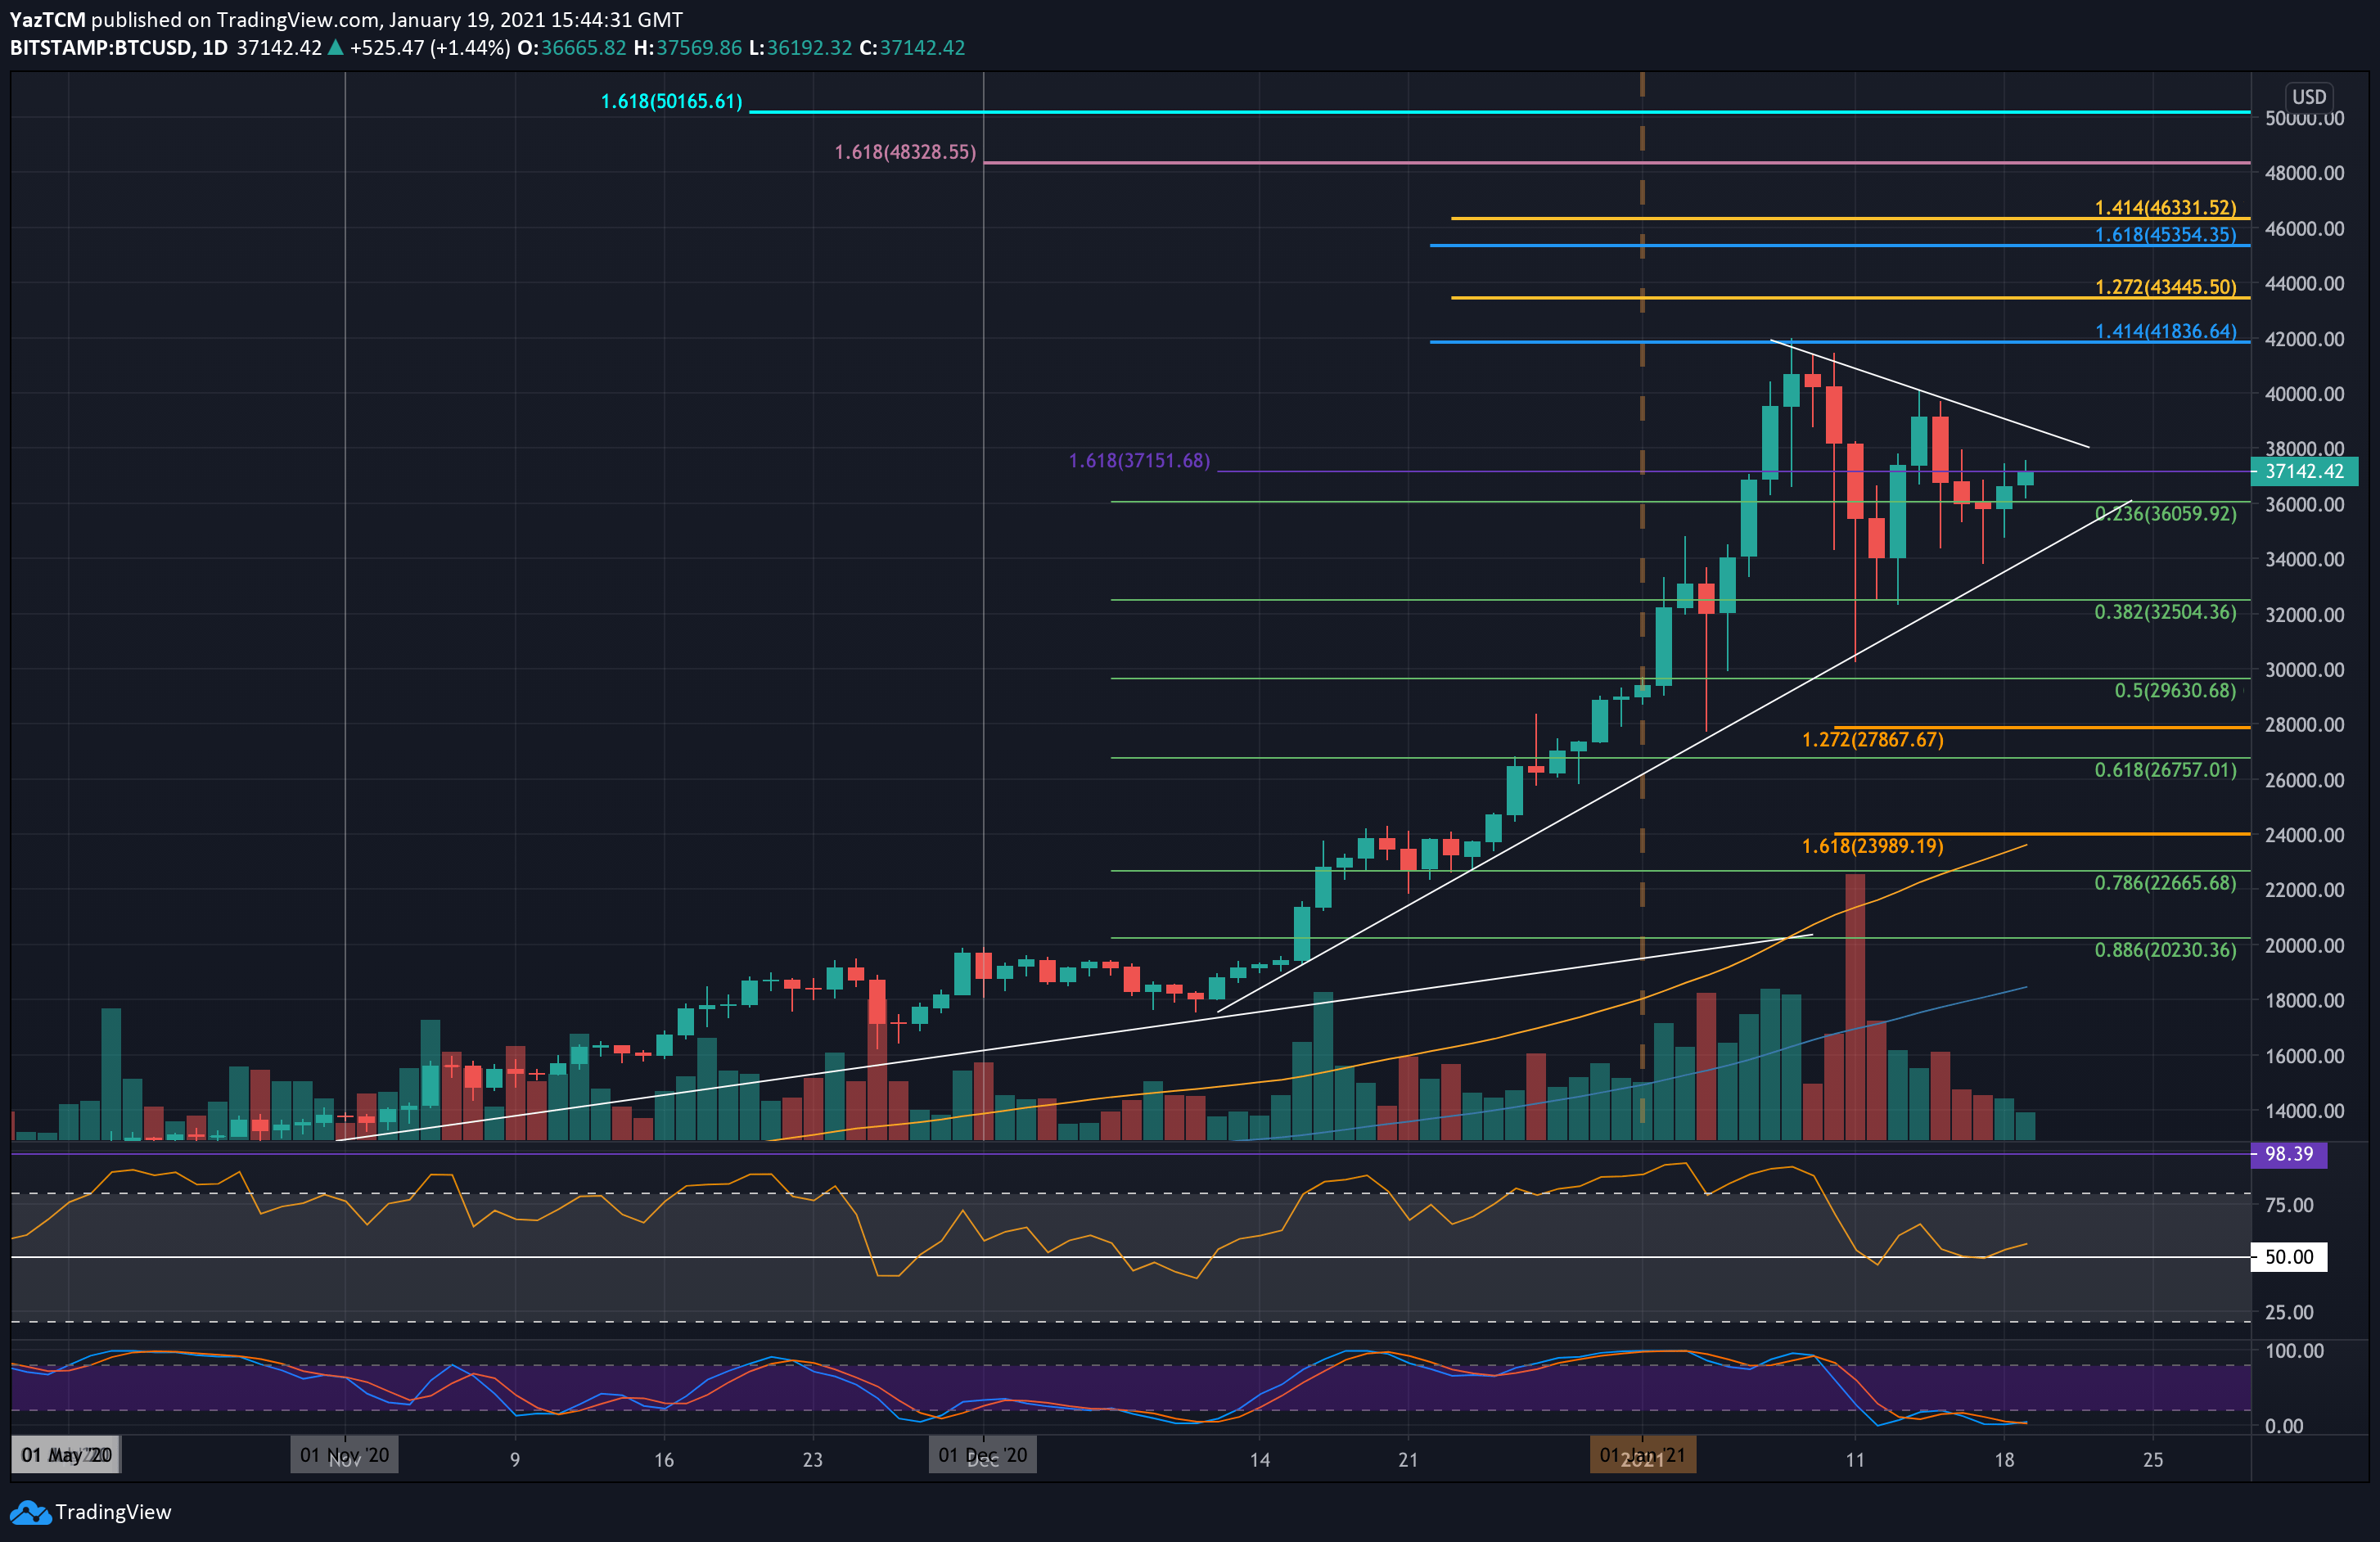
The daily RSI rebounded from the mid-line, which is in favor of the bulls.
Bitstamp BTC/USD Daily Chart
Bitstamp BTC/USD 4-Hour Chart
