After reaching today’s high of ,600 according to bitstamp, Bitcoin reversed back into the rising wedge it is currently trading inside as can be seen on the following 4-hour chart. BTC performed well over the weekend as it broke above a descending trend line on Saturday, and climbed above the Feb 2021 highs of ,355, however, yesterday’s daily close was below the significant resistance area. As mentioned above, today’s current high is the upper boundary of an ascending wedge pattern – best seen on the short-term 4 hours chart below. The current short-term wedge will need to be resolved in the next few days, however, a breakout toward the upside hands BTC a target price of the pole’s size, which will be around the current all-time high level of ,720. On the other
Topics:
Yaz Sheikh considers the following as important: Bitcoin (BTC) Price, BTC Analysis, BTCEUR, BTCGBP, btcusd, btcusdt
This could be interesting, too:
Chayanika Deka writes XRP, SOL, and ADA Inclusion in US Crypto Reserve Pushes Traders on Edge
Chayanika Deka writes Why Arthur Hayes Is Bullish on Bitcoin Under Trump’s Economic Strategy
Mandy Williams writes Why the Bitcoin Market Is Stuck—and the Key Metric That Could Change It: CryptoQuant CEO
Wayne Jones writes Metaplanet Acquires 156 BTC, Bringing Total Holdings to 2,391
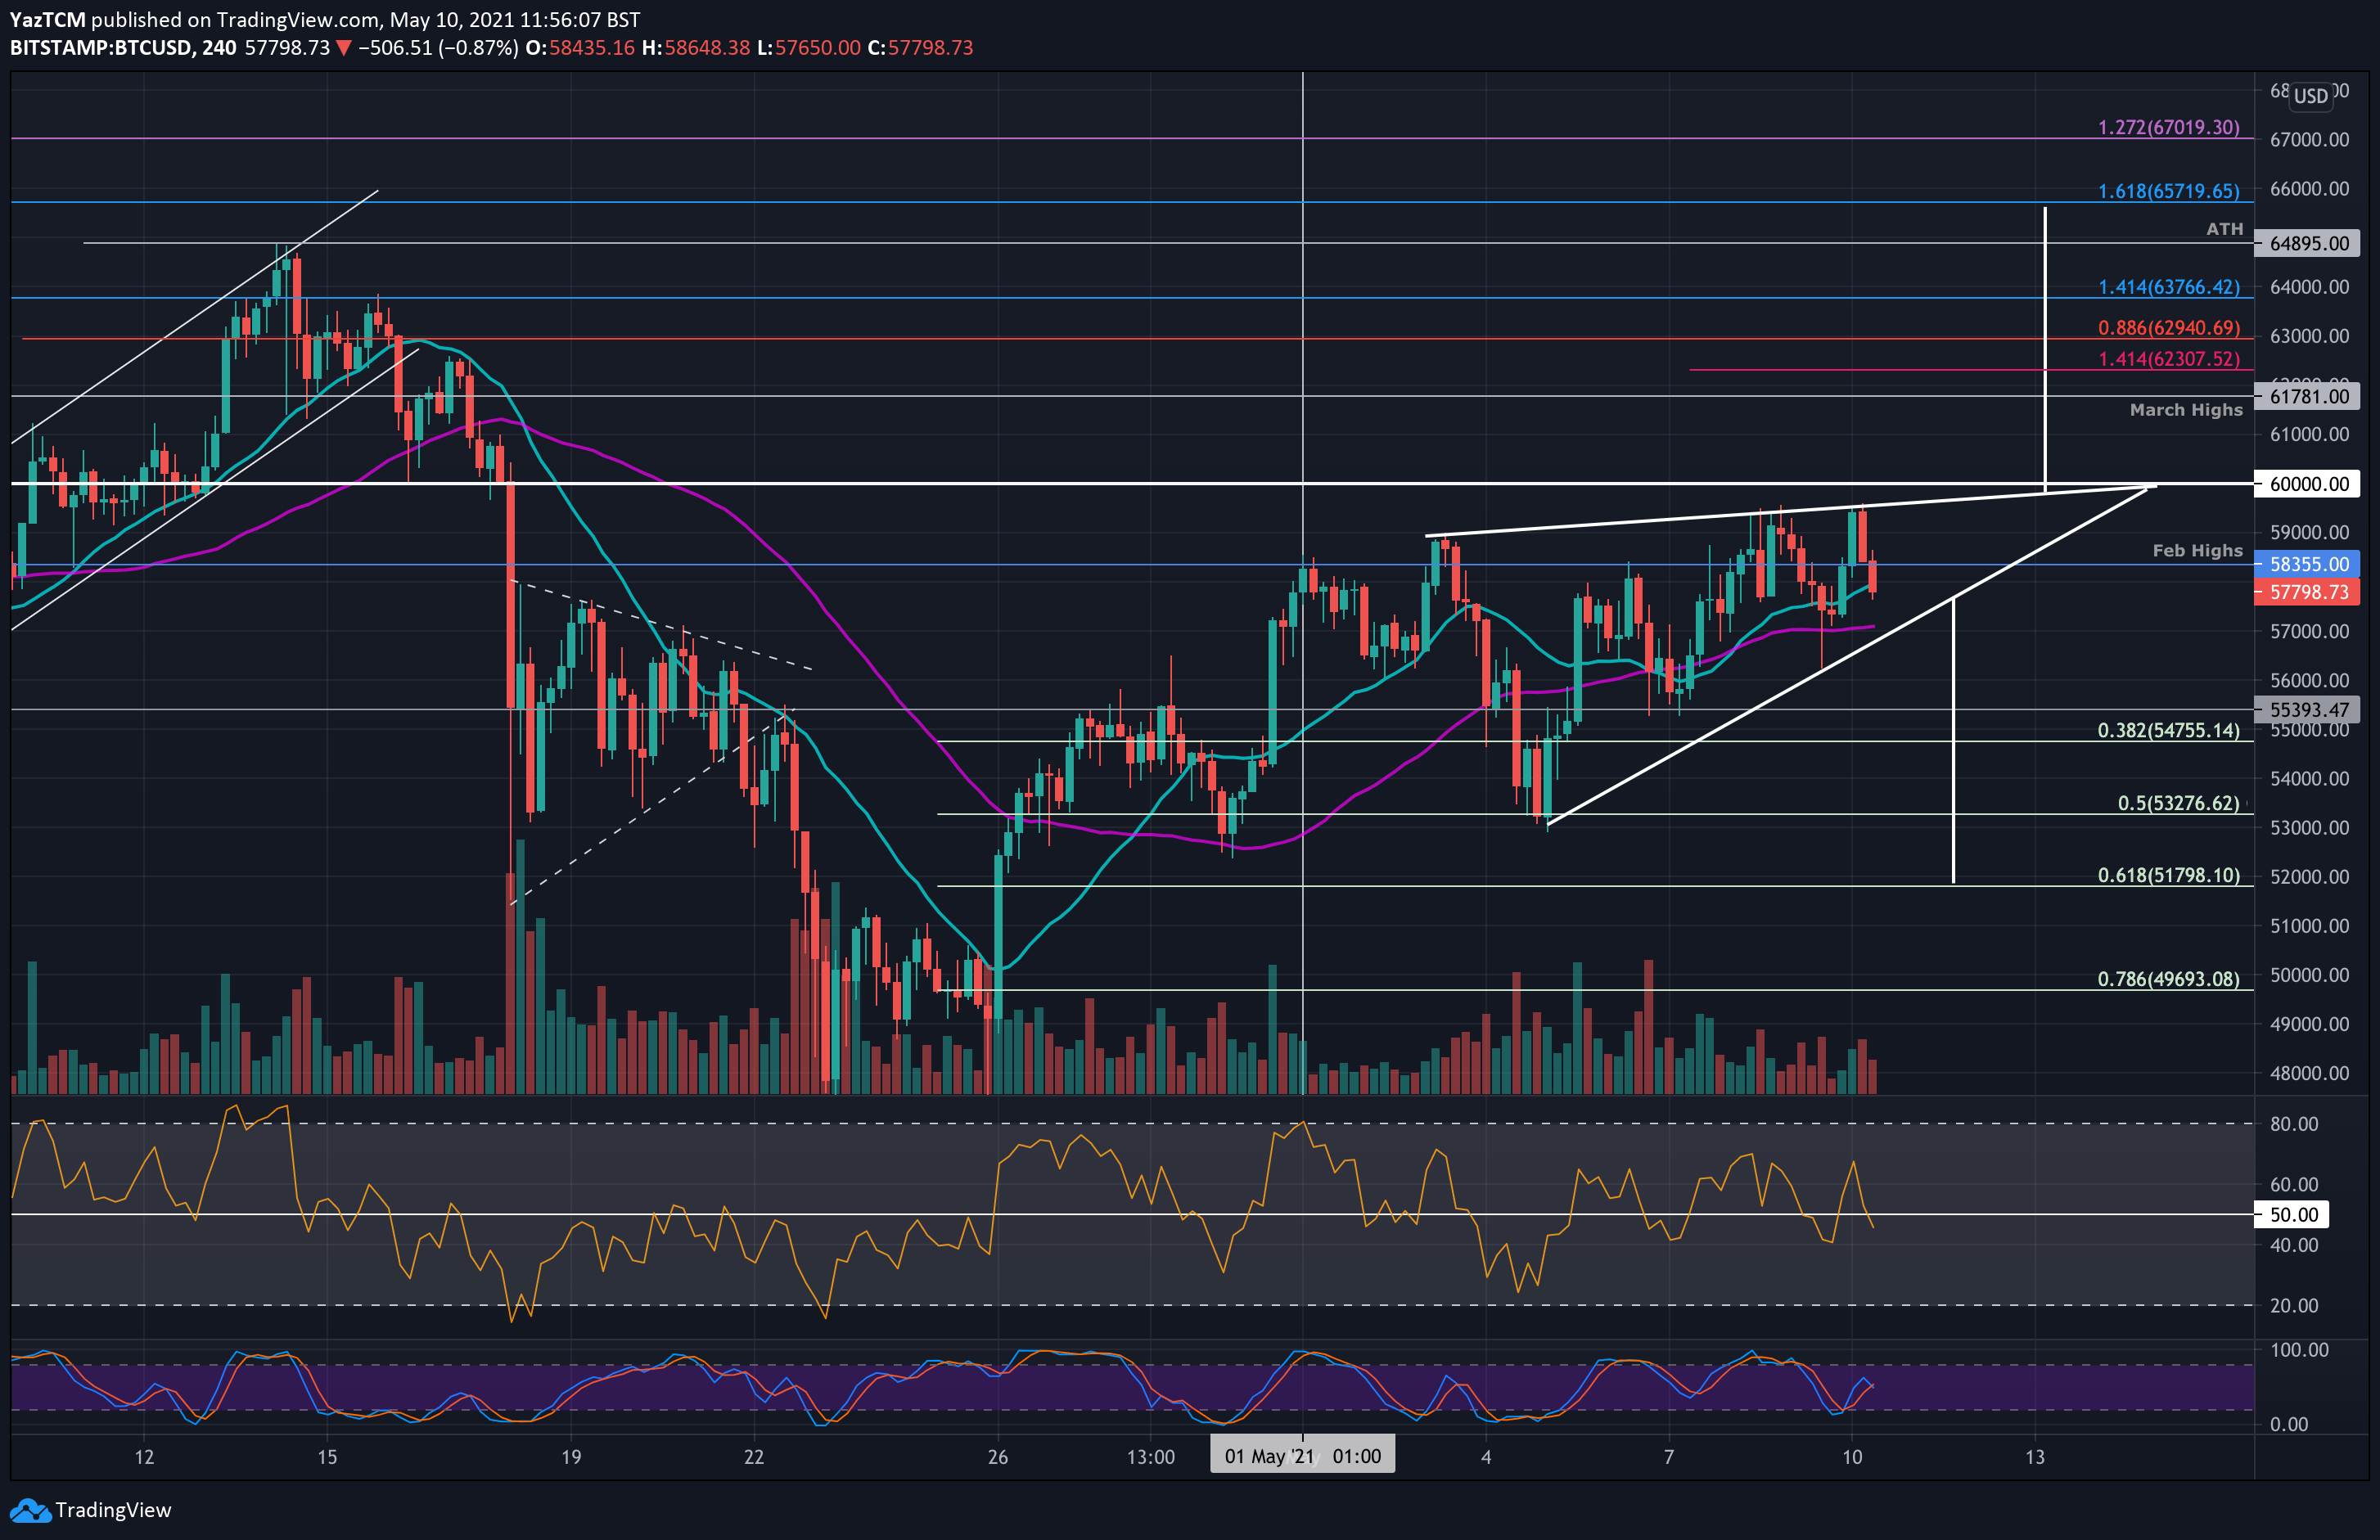
After reaching today’s high of $59,600 according to bitstamp, Bitcoin reversed back into the rising wedge it is currently trading inside as can be seen on the following 4-hour chart.
BTC performed well over the weekend as it broke above a descending trend line on Saturday, and climbed above the Feb 2021 highs of $58,355, however, yesterday’s daily close was below the significant resistance area.
As mentioned above, today’s current high is the upper boundary of an ascending wedge pattern – best seen on the short-term 4 hours chart below.
The current short-term wedge will need to be resolved in the next few days, however, a breakout toward the upside hands BTC a target price of the pole’s size, which will be around the current all-time high level of $65,720.
On the other hand, a breakout toward the downside would see BTC heading to $51,800 (.618 Fib and 20-days MA), before a possible retest of April’s lows around $46K – $47K.
BTC Price Support and Resistance Levels to Watch
Key Support Levels: $57,000, $56,765, $55,000 – $54,755, $54,000.
Key Resistance Levels: $58,355, $59,600 – $60,000, $51,780, $62,300, $62,960.
Looking ahead, if the bulls can climb back above the February highs at $58,355, the first resistance lies at the upper boundary of the wedge around today’s highs of $59,600. This is closely followed by the $60,000 milestone.
Beyond $60,000, added resistance lies at $61,781 (March previous all-time high), $62,300 (short term 1.414 Fib Extension), $62,960 (bearish .886 Fib), and $63,770 (1.414 Fib Extension).
On the other side, the first support lies at the lower boundary of the wedge at around $57,000. This is closely followed by the significant 50-day moving average line at around $56,765. Further down lies $55,000, $54,755 (.382 Fib), and $54,000.
The 4-Hour RSI is beneath the midline, and the daily RSI is producing hints of bearish divergence, which could be signaling a potential bearish price action in the next short-term.
Bitstamp BTC/USD Daily Chart

Bitstamp BTC/USD 4-Hour Chart