Bitcoin’s consolidation continues as it’s trading exactly where it was a week ago. It had made a push higher toward the end of last week but got heavily rejected by the -40k zone, where it met resistance at the upper boundary of a symmetrical triangle pattern (as shown below). From there, BTC headed lower over the weekend, reaching ,850 on Bitstamp, where it found support at the lower boundary of the same symmetrical triangle pattern. It has since bounced higher and it attempts to reclaim ,000. Looking at the short-term chart, bitcoin has penetrated above a short-term symmetrical triangle pattern last week and started to head higher inside an ascending price channel, which turned into a false breakout. BTC is back beneath this price channel over the weekend but is
Topics:
Yaz Sheikh considers the following as important: Bitcoin (BTC) Price, BTC Analysis, BTCEUR, BTCGBP, btcusd, btcusdt
This could be interesting, too:
Chayanika Deka writes XRP, SOL, and ADA Inclusion in US Crypto Reserve Pushes Traders on Edge
Chayanika Deka writes Why Arthur Hayes Is Bullish on Bitcoin Under Trump’s Economic Strategy
Mandy Williams writes Why the Bitcoin Market Is Stuck—and the Key Metric That Could Change It: CryptoQuant CEO
Wayne Jones writes Metaplanet Acquires 156 BTC, Bringing Total Holdings to 2,391
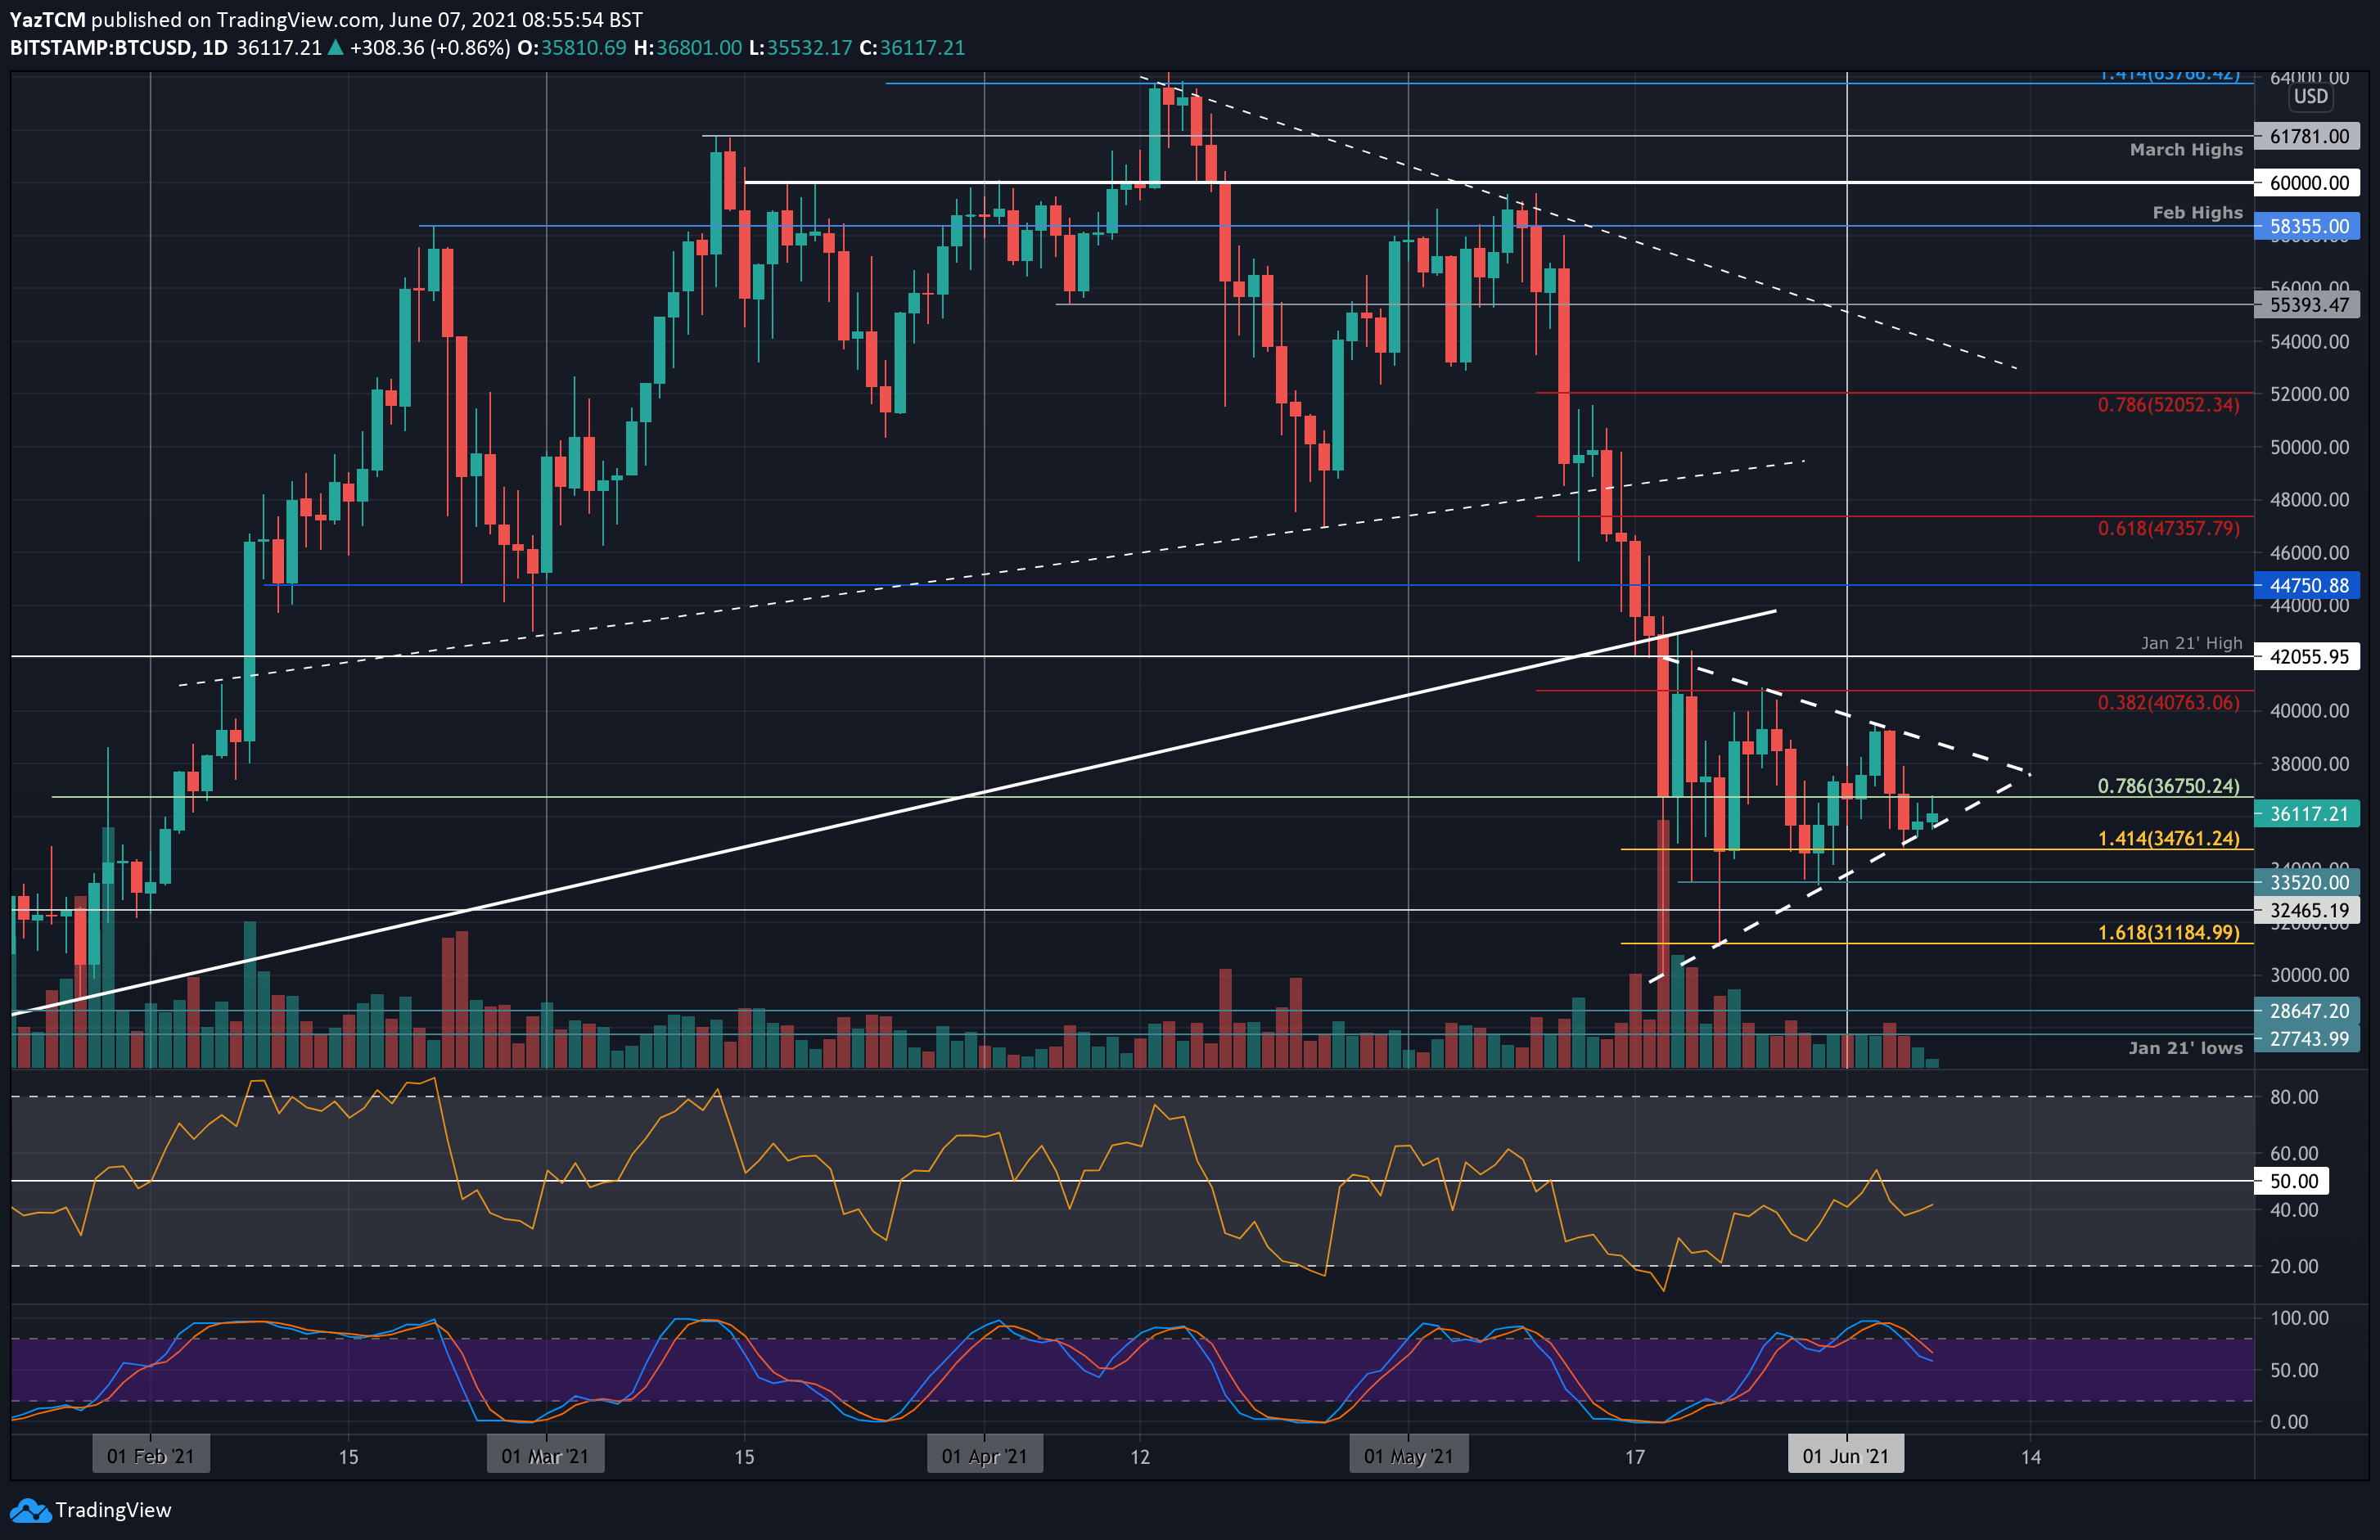
Bitcoin’s consolidation continues as it’s trading exactly where it was a week ago. It had made a push higher toward the end of last week but got heavily rejected by the $38-40k zone, where it met resistance at the upper boundary of a symmetrical triangle pattern (as shown below).
From there, BTC headed lower over the weekend, reaching $34,850 on Bitstamp, where it found support at the lower boundary of the same symmetrical triangle pattern. It has since bounced higher and it attempts to reclaim $36,000.
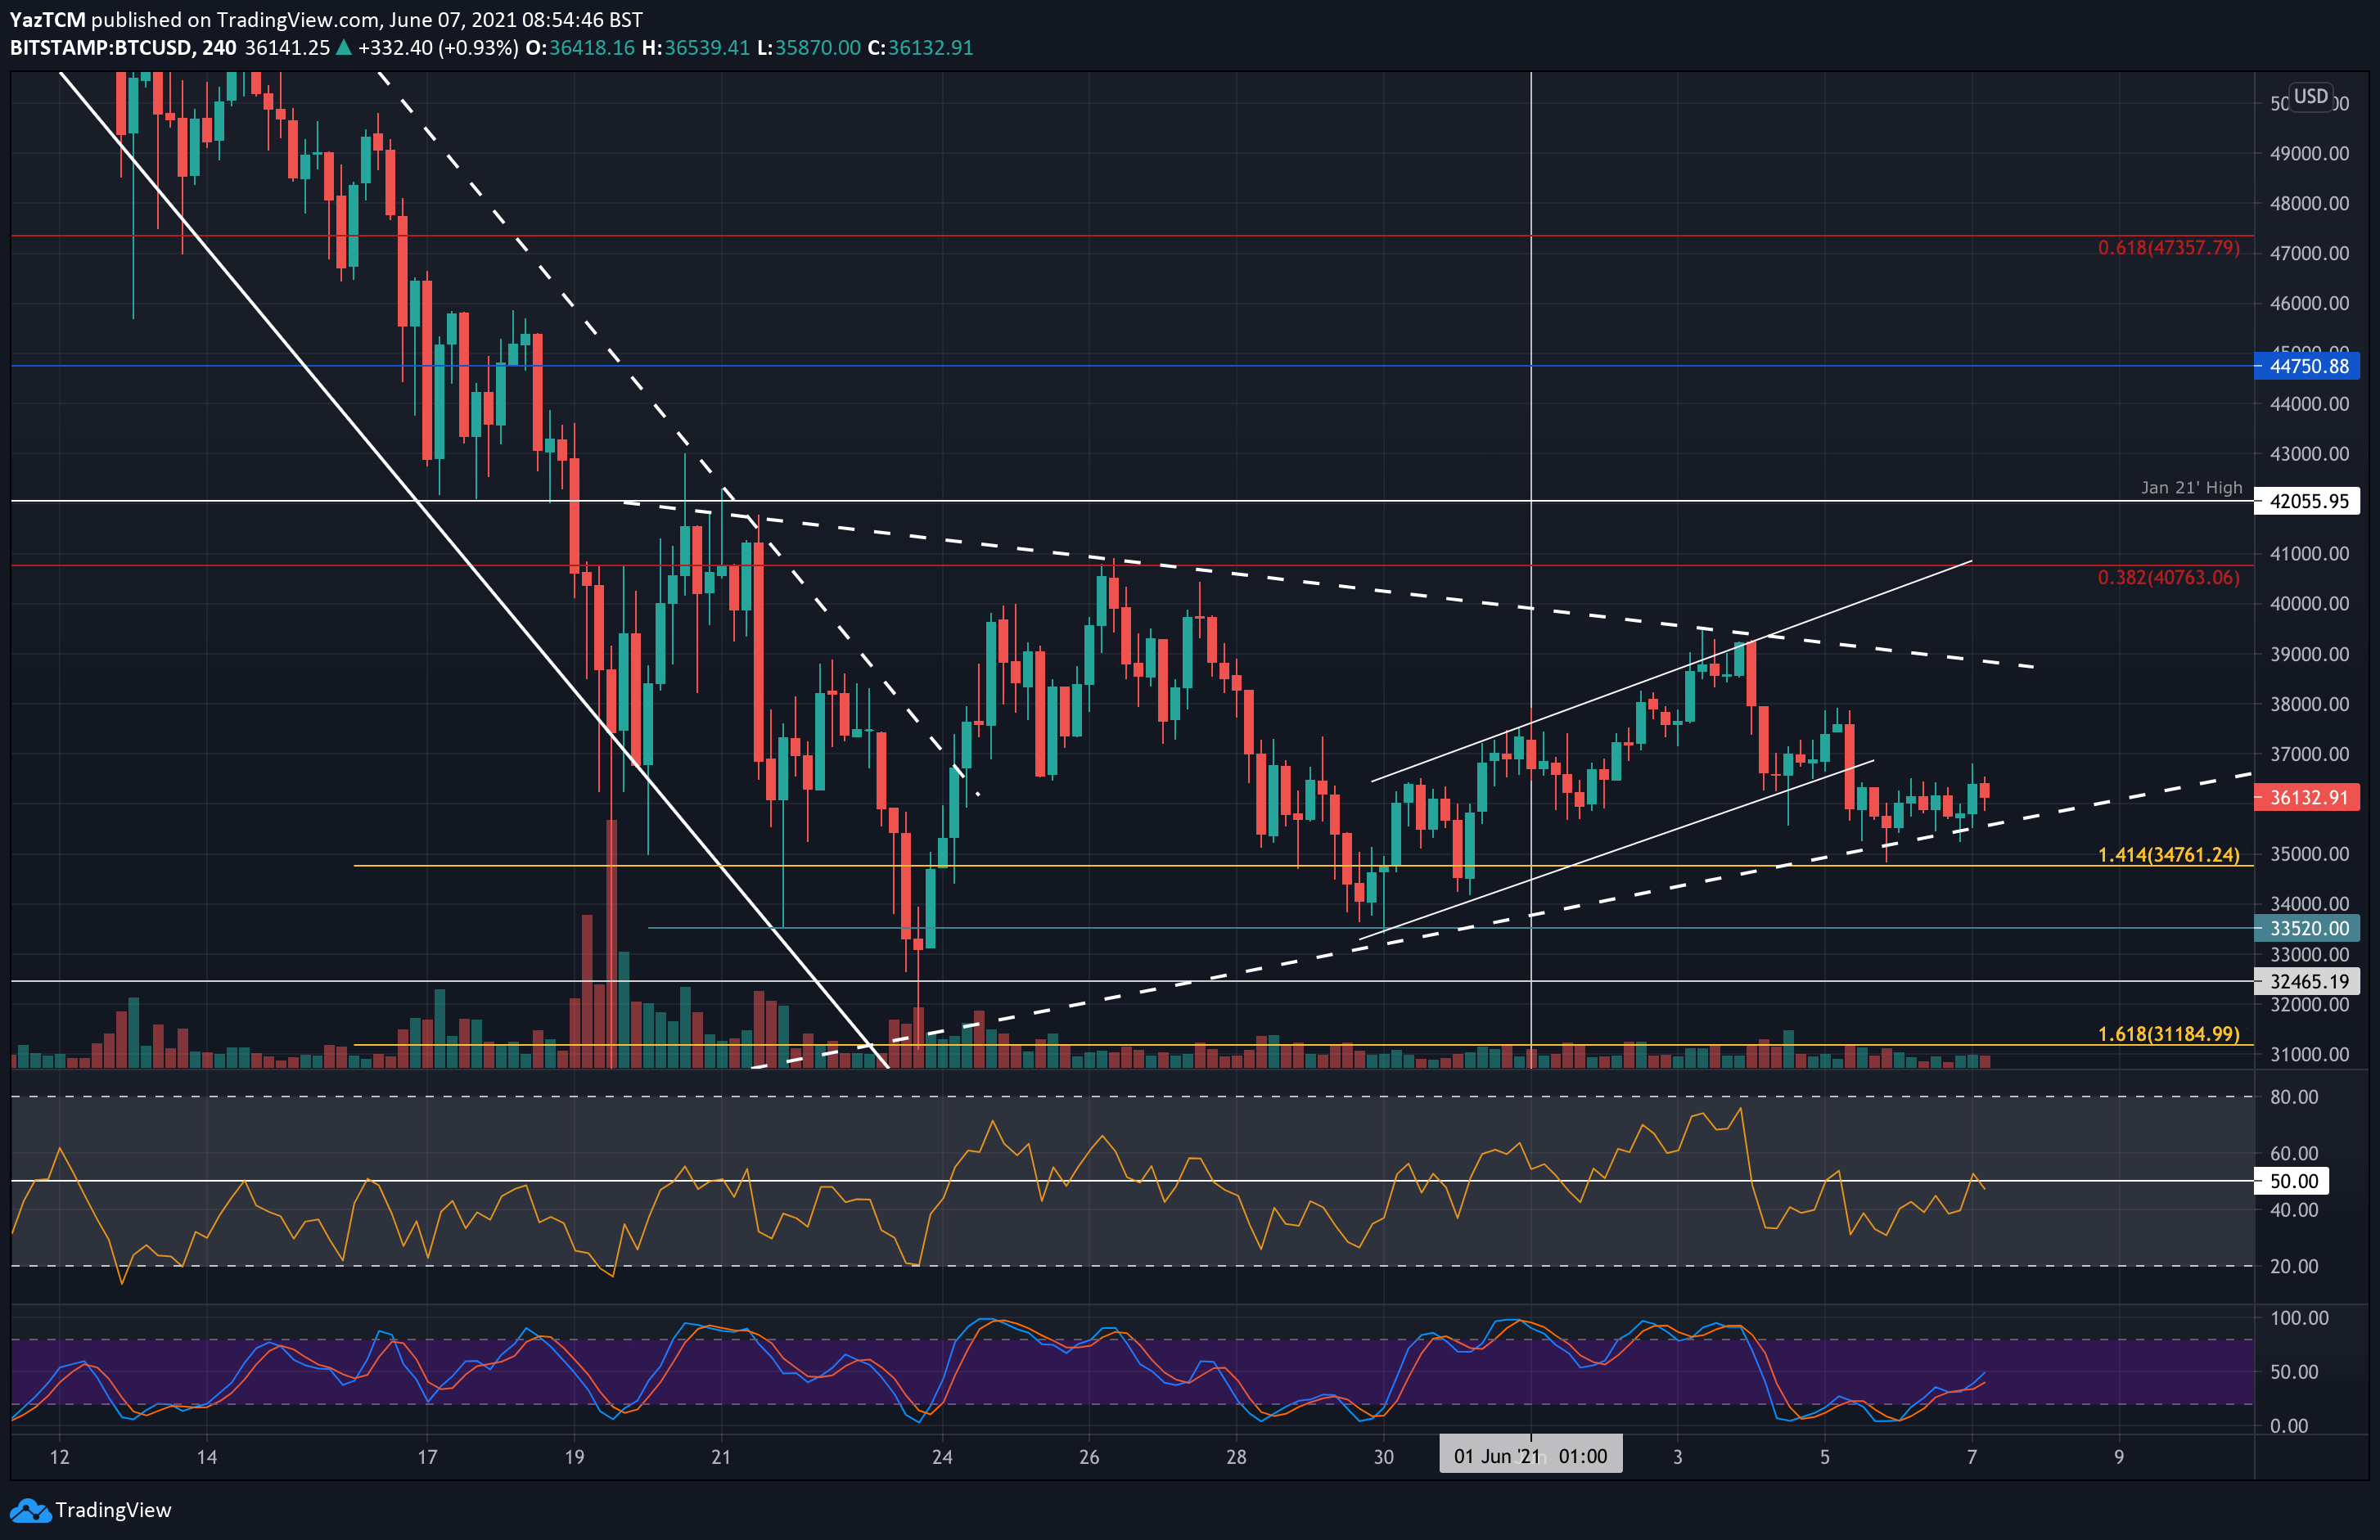
Looking at the short-term chart, bitcoin has penetrated above a short-term symmetrical triangle pattern last week and started to head higher inside an ascending price channel, which turned into a false breakout.
BTC is back beneath this price channel over the weekend but is battling to maintain itself above the longer-term symmetrical triangle. It has been in a phase of consolidation between $32,000 and $40,000 since the market capitulation seen in mid-May. It’s still unclear where BTC would head toward next, but the breakout direction would clarify this.
A breakout above the triangle should allow BTC to face one of the previous all-time highs which turned into solid resistance at $42k. Further above lies the $50,000 milestone.
On the other hand, a breakout below the triangle would see BTC heading toward $30,000, and potentially $27-28k next.
The apex is set for June 14th, and a breakout is likely to take place before it is reached – possibly this week.
BTC Price Support and Resistance Levels to Watch
Key Support Levels: $35,700, $35,000, $34,760, $34,000, $33,520.
Key Resistance Levels: $36,750, $38,500, $39,000, $40,000, $40,765.
Looking ahead, the first support lies at the lower boundary of the triangle at around $35,700. This is followed by support at $35,000, $34,760 (downside 1.414 Fib Extension), $34,000, $33,520, and $32,465.
On the other side, the first resistance lies at $36,750. This is followed by $38,500 (upper angle of triangle), $39,000 (last week’s resistance), $40,000, and $40,765 (bearish .382 Fib).
The daily RSI remains in the weak bearish territory as the bears fail to sustain any momentum. Therefore, for a bullish breakout, the RSI must rise past the midline and climb higher to indicate that the bearish momentum is increasing within the market.
Bitstamp BTC/USD Daily Chart
Bitstamp BTC/USD 4-Hour Chart